VLSFO: Back To Where We Started on ‘Day 1’ – What’s Next?
November 17, 2021
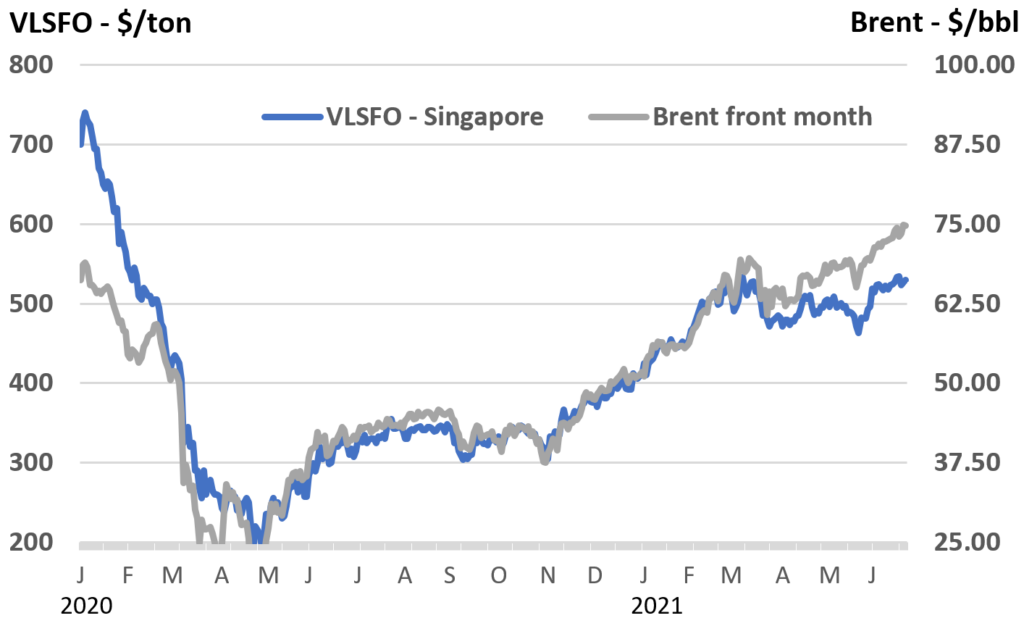
VLSFO prices back above $600
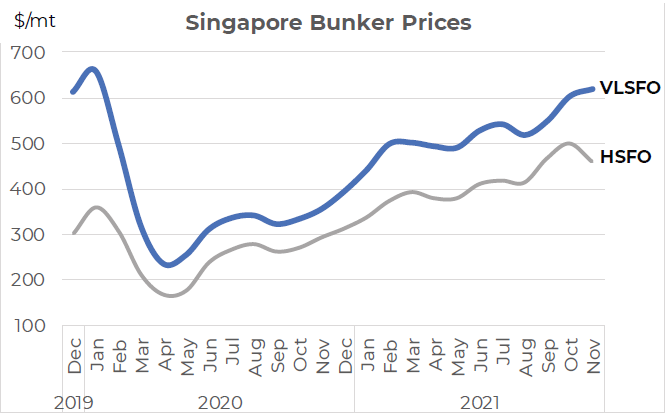
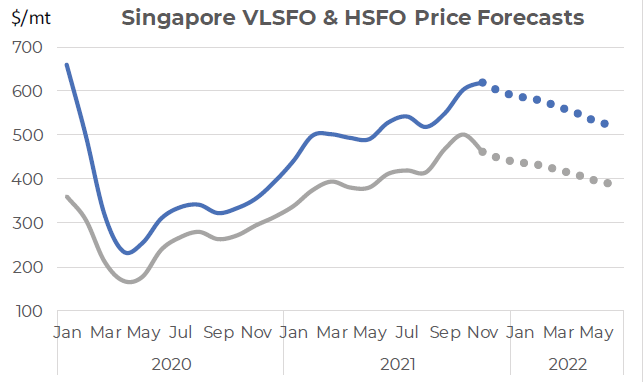
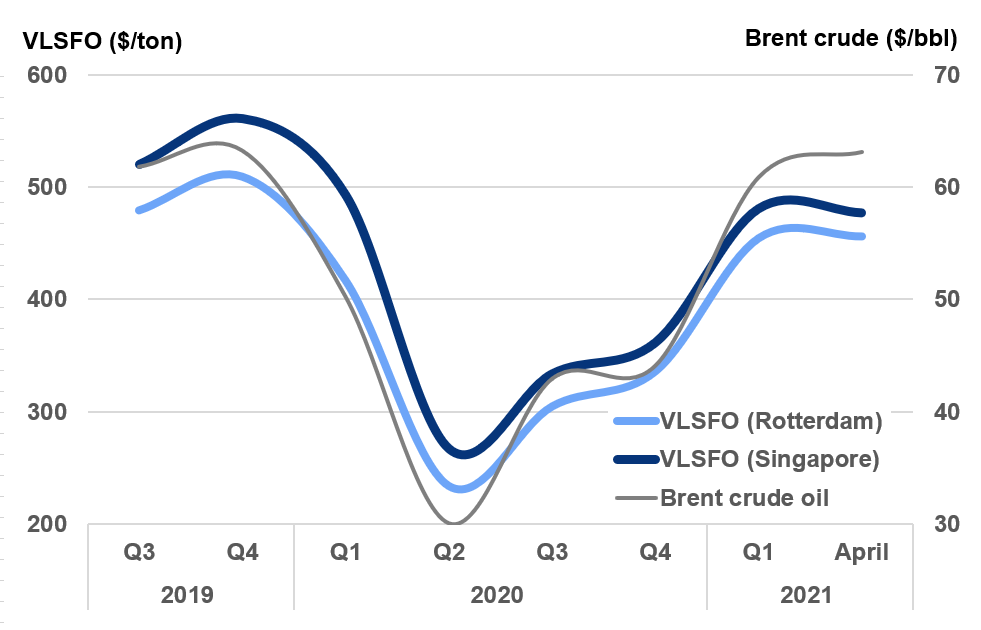
When VLSFO was fully introduced in December 2019/ January 2020, Singapore prices were in the range $615-660/mt; so far in November have averaged $620/mt – we are back to where it all started!
Source: Integr8 Fuels
Events over the past 22 months are well documented and will be written about for many years to come. The oil industry will be a mere microcosm of all this, but when you are involved in the bunker market these oil industry details become significant. The collapse in oil demand at the start of the pandemic led VLSFO prices down to around $250/mt. The subsequent cutbacks in OPEC+ crude production, combined with the loss of US crude supplies and the eventual rebound in oil demand have all contributed to the rise in oil prices and the reason why VLSFO has moved back above $600/mt. The clear question is: Where do we go from here?
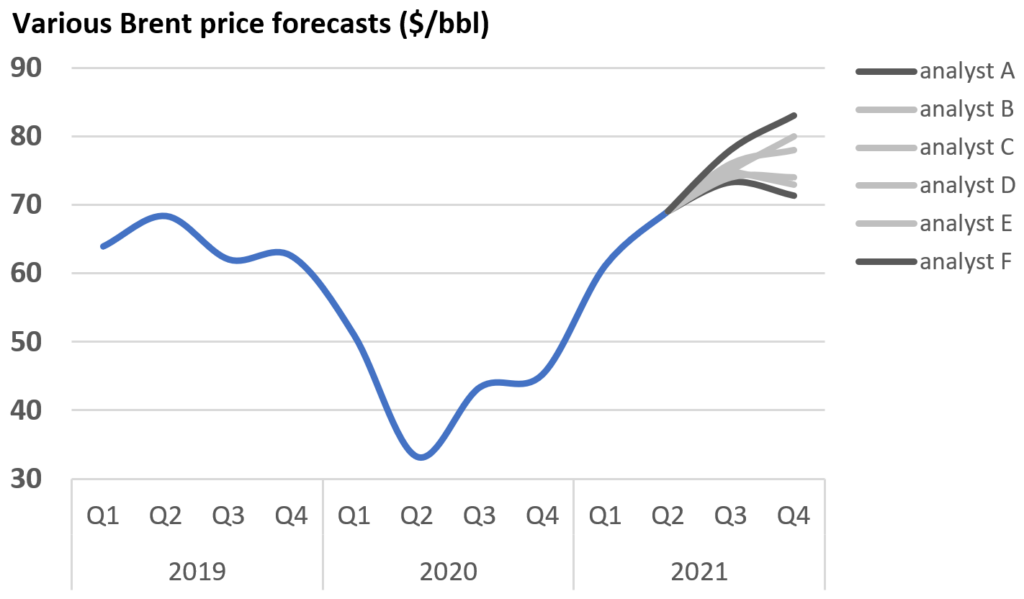
Analysts foresee prices falling from here
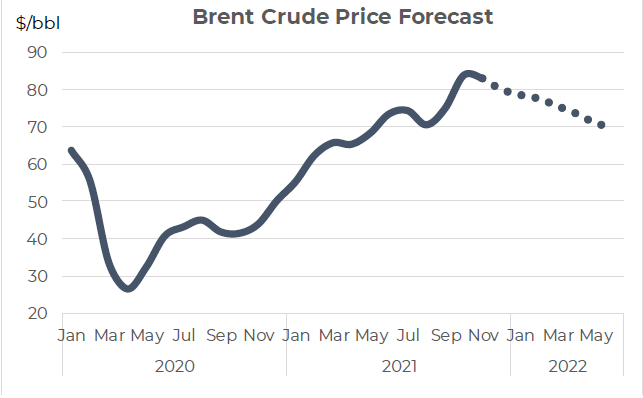
Some analysts are indicating that we are currently at a peak, and that prices will ease from here. Brent crude futures (front month) hit a high of above $86/bbl in late October and are currently trading around $82/bbl. The pointers now are towards $75/bbl in Q1 next year and $70/bbl by Q2. On this basis, it would imply Singapore VLSFO down from around $610/mt currently, to around $565/mt in Q1 and $530/mt by next June. Read More
VLSFO prices back above $600
When VLSFO was fully introduced in December 2019/ January 2020, Singapore prices were in the range $615-660/mt; so far in November have averaged $620/mt – we are back to where it all started!
 Source: Integr8 Fuels
Events over the past 22 months are well documented and will be written about for many years to come. The oil industry will be a mere microcosm of all this, but when you are involved in the bunker market these oil industry details become significant. The collapse in oil demand at the start of the pandemic led VLSFO prices down to around $250/mt. The subsequent cutbacks in OPEC+ crude production, combined with the loss of US crude supplies and the eventual rebound in oil demand have all contributed to the rise in oil prices and the reason why VLSFO has moved back above $600/mt. The clear question is: Where do we go from here?
Analysts foresee prices falling from here
Some analysts are indicating that we are currently at a peak, and that prices will ease from here. Brent crude futures (front month) hit a high of above $86/bbl in late October and are currently trading around $82/bbl. The pointers now are towards $75/bbl in Q1 next year and $70/bbl by Q2. On this basis, it would imply Singapore VLSFO down from around $610/mt currently, to around $565/mt in Q1 and $530/mt by next June.
The fundamentals always ‘win out’
The recent price highs have come about as oil demand continues to
rebound and OPEC+ maintain their planned, and constrained increases
in production. Despite some pressure from the US on OPEC+ to go beyond this, there has been no shift in OPEC+ (nor Saudi) policy for countries with spare capacity to raise output in light of current prices.
This is despite some member countries producing below their allocated quotas because of previous low prices and a lack of spending in their upstream sectors. This rise in demand and constraints on supply has left oil stocks at low levels, and markets fundamentally tight. Also, although US crude production is rising in the wake of higher oil prices, the gains are considered relatively low, with a number of upstream companies ‘forced’ to reduce debts or pay shareholder dividends rather than go out on a massive expansion in drilling activity.
The overall result has been that oil demand has exceeded oil supply so far this year, and we have been in an extended period of stockdraws, leaving the market tight and Brent prices well in to the $80s.
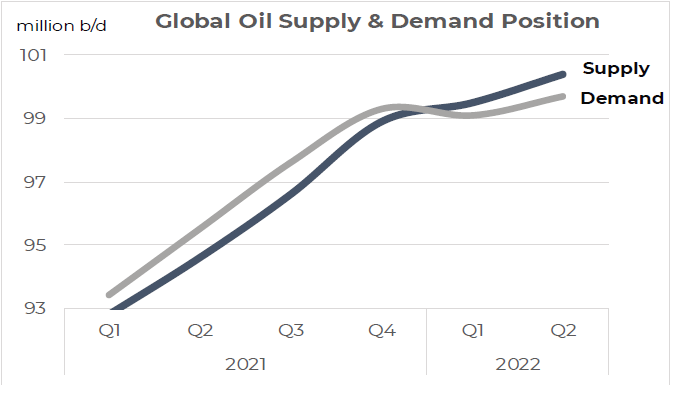
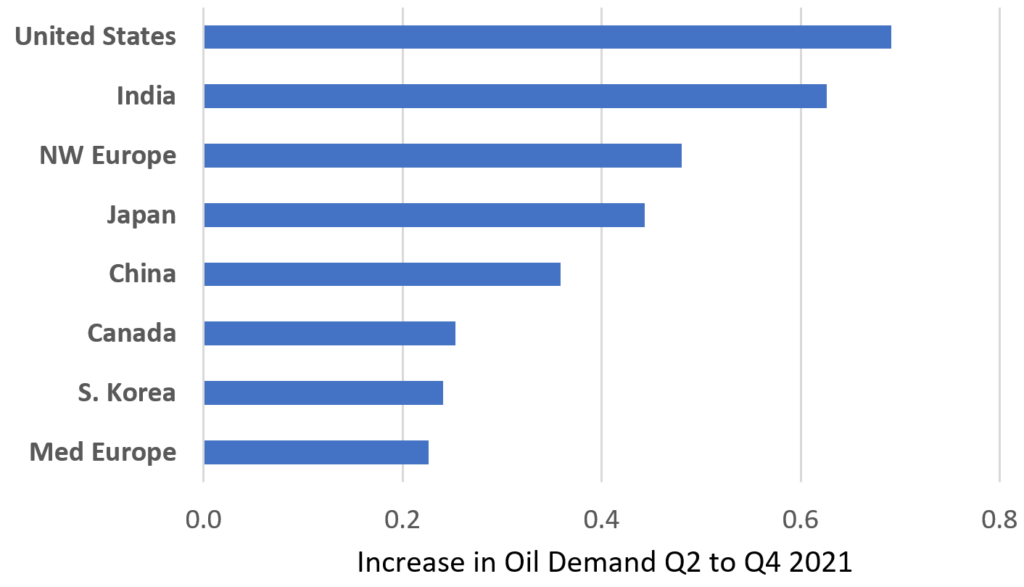
The expectations now are that oil supply will continue to increase, even under the current OPEC+ strategy. On the demand side, total consumption is now back close to pre-pandemic levels and so future gains are seen as far more modest, stalling at just above 99 million b/d through to the middle of next year.
 Source: Integr8 Fuels
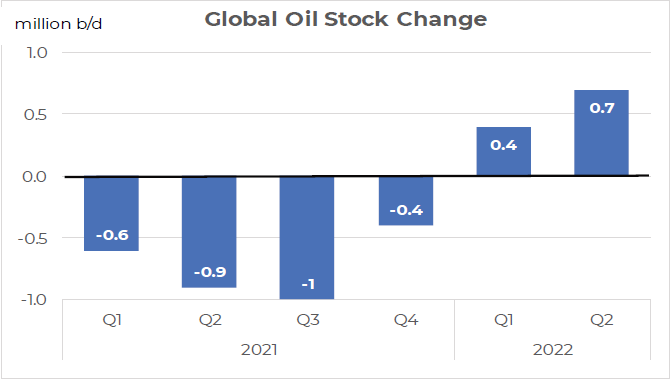
We are moving from a position of stockdraws to stockbuilds
This means we would shift from a global stockdraw averaging around 0.7 million b/d this year, to a stockbuild of 0.6 million b/d in the first half of next year. It is this anticipated shift in oil fundamentals that forms the backdrop to lower price forecasts through to the middle of next year.
 Source: Integr8 Fuels
Subject to change – Here are some of the known unknowns:
In addition to this ‘base’ position, there is also a possibility of developments and an agreement in the US-Iran nuclear talks, which resume at end November. The next 6 months may be too soon to see any material increase in oil supplies, but if sanctions on Iran are lifted, the expectations are that they could increase production and exports by 1.0- 1.5 million b/d. There are clearly a number of other variables that could affect this base case, not least with the pandemic (positive or negative), but also the extent of the northern hemisphere winter; any further demands on oil into power generation; what may happen to US production; and the OPEC+ strategy.
Finally, the economy, high prices and inflation can cause trigger responses, such as a reduction in oil demand and the release of strategic oil reserves (although the use of reserves usually has little long-term effect on oil prices). Any of these factors could lead to analysts changing their views.
Today’s mood is bearish on price
Working within the base case, analysts are indicating Brent prices falling back down to around $70/bbl by the middle of next year, as stocks build and tightness eases.
 Source: Integr8 Fuels
We have often outlined that the crude price largely sets the absolute
level of bunker prices, but with VLSFO and HSFO also having relative
strengthening or weaking positions against crude, driven by what is
happening in:
- The refining sector with margins and maintenance;
- Supply and demand developments for other oil products;
- At extremes, even what is happening to natural gas prices (as highlighted in one of our reports last month).
In the first instance here, we have taken a fixed relationship with crude prices, to at least show the extend of bunker price movements based on analysts’ current expectations for Brent. In subsequent reports we will
return to looking at the relative shifts in bunker prices versus crude oil and other product prices.
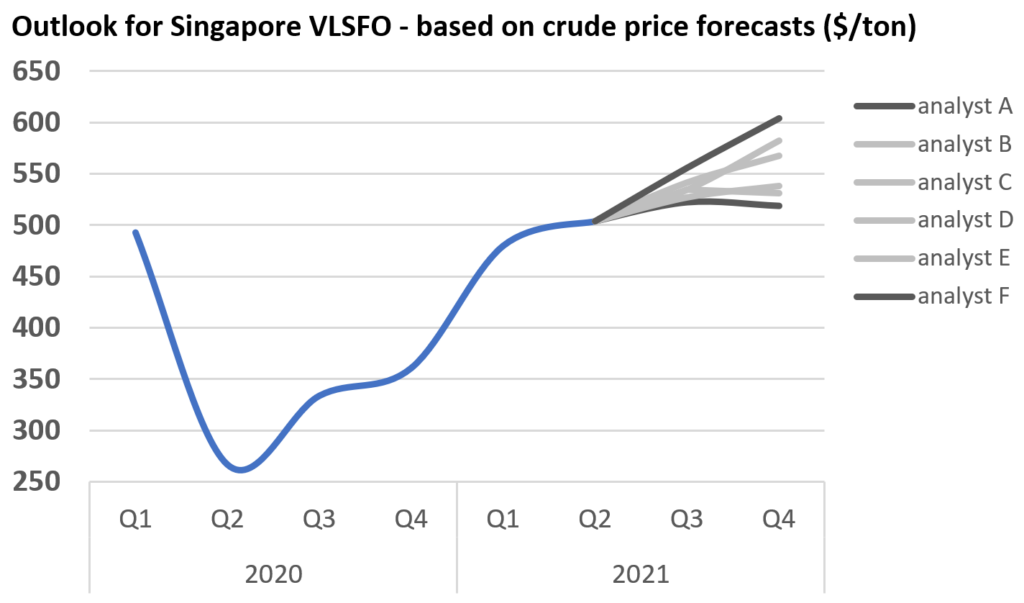
From this, current bunker prices are seen as towards their highs and that some downwards movement is expected. In this case it shows bunker prices will ease back towards levels seen at during the first half of this year, with Singapore VLSFO in the low $500s by the middle of next year. This is around $100/mt lower than today. On the same basis, Singapore HSFO would be around $380/mt by mid-2022.
 Source: Integr8 Fuels
The relative price of bunkers can easily shift, with any extreme cold weather ‘pulling’ more HSFO into power generation (such as in Pakistan, or in S. Kora/Japan) and giving relative strength to HSFO prices. Conversely, if global oil demand is stronger than forecast coming out of the northern hemisphere winter, we could expect higher refinery throughputs and more HSFO supplies, putting relative downwards pressure on HSFO prices. Typically, higher global oil demand would lead to a relative strengthening in VLSFO pricing (and vice versa). These are nuances around the underlying price of bunkers, but still important. By definition, things can change, but the sentiment today is one of weakening bunker prices in the near term.
Steve Christy, Research Contributor
E: steve.christy@integr8fuels.com
Download this article as a PDF »
What could the unstoppable environmental pressures mean for oil & especially the bunker market?
October 28, 2021
Natural gas & LNG prices have spiked & it has impacted on bunker prices
In the past, we have highlighted the impacts on the bunker market from demand and pricing issues for other oil products, such as gasoline, diesel and jet. However, we have just seen a surprising, larger narrowing in the VLSFO/HSFO price differential due to what is happening in the natural gas and LNG markets. Although the VLSFO/HSFO differential has widened again in the past few days, we are not necessarily ‘out of the woods’ and we have to extend the influences on supply and pricing in our markets in order to look at what is happening in the natural gas and LNG sectors.
Until now, it may have seemed strange that a bunker report was focused on what is happening in natural gas and LNG, but gas prices hit record highs earlier this month and have caused shock waves in power generation and industry. As a result, oil, and in particular HSFO, has become an attractive economic alternative into power generation.
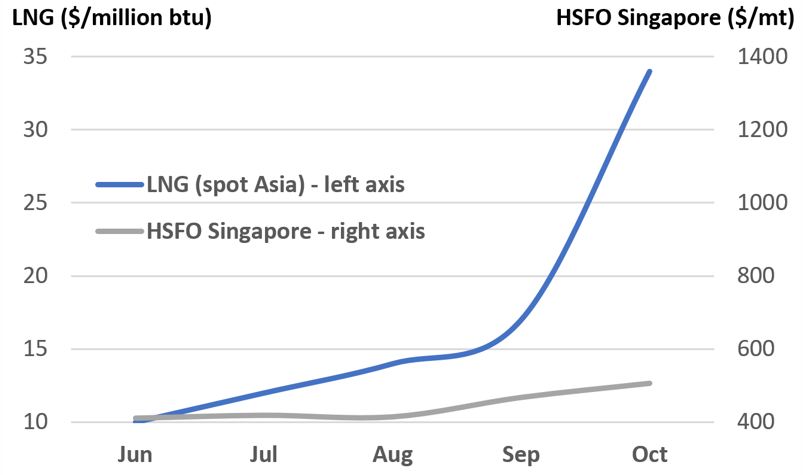
To give some backdrop to this, we are just starting the northern hemisphere winter and there has already been a tightness in stocks and rising demand for natural gas/LNG as we continue coming out of the pandemic. The net result has been spot LNG prices spiked at record highs of $56 per million btu earlier in October; up from $6 in May, $10 in June and around $17 in September. Prices have since eased back to around $34 per million btu, but they are still at exceptionally high levels.
Where-as spot LNG prices are up by almost 300% since July, monthly average crude prices are up by $9/bbl for Brent (plus 13%) and HSFO bunkers in Singapore up $87/mt (plus 21%). The graph below uses comparable scales on each axis and illustrates clearly the extent of the current price premium for LNG over oil. This explains why power generation companies with oil-fired capacity have come looking at ‘our’ market to use oil to produce electricity. Read More
Natural gas & LNG prices have spiked & it has impacted on bunker prices
In the past, we have highlighted the impacts on the bunker market from demand and pricing issues for other oil products, such as gasoline, diesel and jet. However, we have just seen a surprising, larger narrowing in the VLSFO/HSFO price differential due to what is happening in the natural gas and LNG markets. Although the VLSFO/HSFO differential has widened again in the past few days, we are not necessarily ‘out of the woods’ and we have to extend the influences on supply and pricing in our markets in order to look at what is happening in the natural gas and LNG sectors.
Until now, it may have seemed strange that a bunker report was focused on what is happening in natural gas and LNG, but gas prices hit record highs earlier this month and have caused shock waves in power generation and industry. As a result, oil, and in particular HSFO, has become an attractive economic alternative into power generation.
To give some backdrop to this, we are just starting the northern hemisphere winter and there has already been a tightness in stocks and rising demand for natural gas/LNG as we continue coming out of the pandemic. The net result has been spot LNG prices spiked at record highs of $56 per million btu earlier in October; up from $6 in May, $10 in June and around $17 in September. Prices have since eased back to around $34 per million btu, but they are still at exceptionally high levels.
Where-as spot LNG prices are up by almost 300% since July, monthly average crude prices are up by $9/bbl for Brent (plus 13%) and HSFO bunkers in Singapore up $87/mt (plus 21%). The graph below uses comparable scales on each axis and illustrates clearly the extent of the current price premium for LNG over oil. This explains why power generation companies with oil-fired capacity have come looking at ‘our’ market to use oil to produce electricity.
Source: Integr8 Fuels
Given the tight fundamentals in the natural gas (and coal) markets, this demand for oil in the power sector could hit at various times throughout the northern hemisphere winter, even if we see mild weather conditions. The current LNG forward curve suggests this, with prices above $30 per million btu right through to next March. There are forecasts of a colder winter, and if this is the case then demand on oil-fired power generation could be even greater.
New demand for HSFO into power generation
Although gasoil is part of the oil supply into power generation, especially in small, local back-up generators, big utilities have put out tenders for HSFO. For instance, Kuwait has already been in the market for 420,000 mt of HSFO in the third quarter and Pakistan was looking for 275,000 mt for November delivery (last November they were looking for 70,000 mt). There are wide ranging views of how much oil-fired power generation is available, but the vast majority of capacity is in Asia (Japan, Pakistan, Bangladesh and S. Korea) and the Middle East.
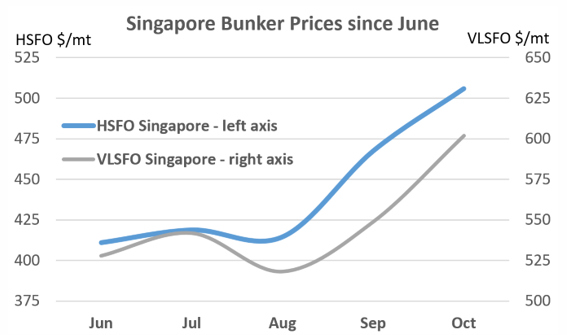
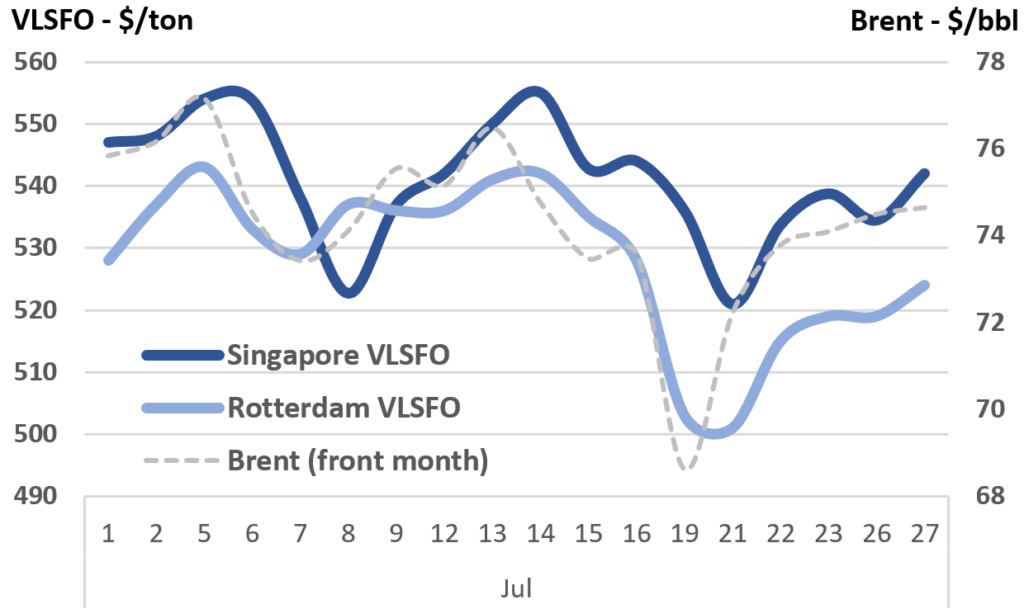
During this period when power utilities were buying oil, greater pricing pressures were on HSFO, rather than the 0.5% sulphur VLSFO. This is shown in the graph below, highlighting monthly average bunker price developments in Singapore HSFO and VLSFO since June (HSFO pricing is against the left axis with an axis range of $150/mt and VLSFO against the right-hand axis with the same $150/mt axis range).
Source: Integr8 Fuels
The emphasis in Singapore has been more on HSFO than VLSFO. The price of VLSFO largely tracked the increases in crude oil prices between July and mid-October, but the added demand for high sulphur fuel oil into power generation pushed the relative price of HSFO bunkers much higher.
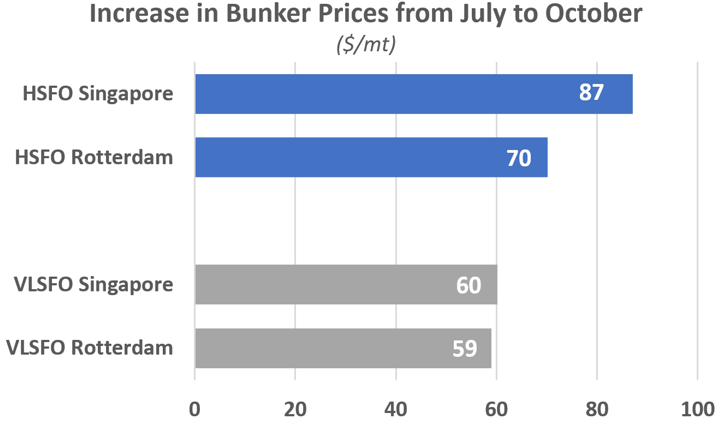
Because the vast majority of oil-fired power generation buying is east of Suez, so the recent impact was focused on the Singapore bunker market rather than in the West. Over the three months to October, average HSFO bunker prices in Rotterdam have still risen by more than VLSFO, but the strains have not been as great as in Singapore. Summarising the July to October period, VLSFO was up by around $60/mt in both markets, whereas HSFO was up $70/mt in Rotterdam, and Singapore was the most extreme with HSFO up $87/mt.
Source: Integr8 Fuels
High gas prices did narrow the Singapore VLSFO/HSFO spread
The outcome of these pressures and price movements was an unexpected shift in the VLSFO/HSFO spread in Singapore. In earlier reports we have highlighted the impact of the pandemic and that demand losses in the bunker market have been far less than most other oil products (e.g. gasoline, diesel, gasoil and especially jet). With VLSFO typically a blended product, the weakness in demand and pricing for these other products and components meant VLSFO pricing was relatively weak. In contrast HSFO pricing was relatively strong against the rest of the oil barrel because of the ‘better’ demand position and a huge cut in supply from much lower refinery throughputs.
These divergent trends in VLSFO and HSFO pricing last year led to the squeeze in their price differential, to only $60/mt in Singapore and close to $40/mt in Rotterdam. Expectations were always that as global oil demand increased coming out of the pandemic, this squeeze would be reversed; higher demand for gasoline, diesel/gasoil and components would strengthen their relative prices and also drive the price of VLSFO along with it. At the same time, there would be only minimal gains in HSFO demand and refineries would operate at much higher levels, increasing the availabilities of HSFO; so, the relative pricing for HSFO would become weaker. All this played out ‘as expected’ from the back end of 2020 right through until early August this year; the VLSFO/HSFO spread doubled, to $110-120/mt in Singapore and to$100-110/mt in Rotterdam.
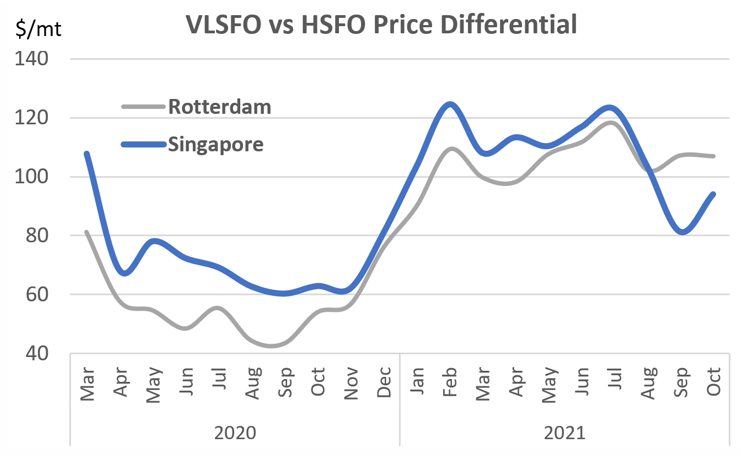
Source: Integr8 Fuels
Because of developments in natural gas/LNG pricing, all this started to change around mid-August. That was when power utility buyers entered the high sulphur fuel oil market and the VLSFO/HSFO spread ‘unexpectedly’ narrowed again, to average $80/mt in September and get as low as $60/mt in early October. The impact in the West was nowhere as evident, with the VLSFO/HSFO spread still averaging more than $100/mt.
These developments are not permanent, but could be repeated
In the past few days, we have seen another dramatic change, with the VLSFO/HSFO spread widening again to more than$120/mt in Singapore. Some of the contributing reasons for this have been a build in Singapore stocks and lull in power utilities buying or putting out tenders for fuel oil, with for instance Pakistan stepping back from the market.
However, we are still only at the start of the northern hemisphere winter and these pressures in the market for natural gas/LNG are expected to last through to February/March. We could easily see power utilities entering the market again with another buying surge for HSFO east of Suez.
We have to watch the weather, the natural gas/LNG markets and the potential buying from oil-fired power utilities and if this takes place, we could expect another narrowing across the VLSFO/HSFO spread in Asia this winter.
As we come out of winter, demand for oil-fired power generation is expected to ease and any pricing pressures on HSFO removed. However, the squeeze we have just seen at an early stage in the northern hemisphere winter may not be a one-off. The pressures look as though they could be here for a number of years to come and if so, we could see more squeezes and seasonality in the Singapore VLSFO/HSFO spread.
Steve Christy, Research Contributor
E: steve.christy@integr8fuels.com
Download this article as a PDF »
What could the unstoppable environmental pressures mean for oil & especially the bunker market?
September 23, 2021
The environment & COP 26 come back into focus
Over the past 18 months all of the talk has been related to the pandemic, but worldwide politics is shifting and the environmental question is coming back into focus. The build-up to COP 26 starting on October 31st in Glasgow is likely to re-energise the debate. In this report we take an overview of the longer-term prospects for the oil markets and where this could leave the bunker sector in the run-up to political targets set for 2050; it is intended to be agnostic and an attempt to summarise current expectations over the much longer term.
Oil demand forecast to continue growing for at least another 10 years
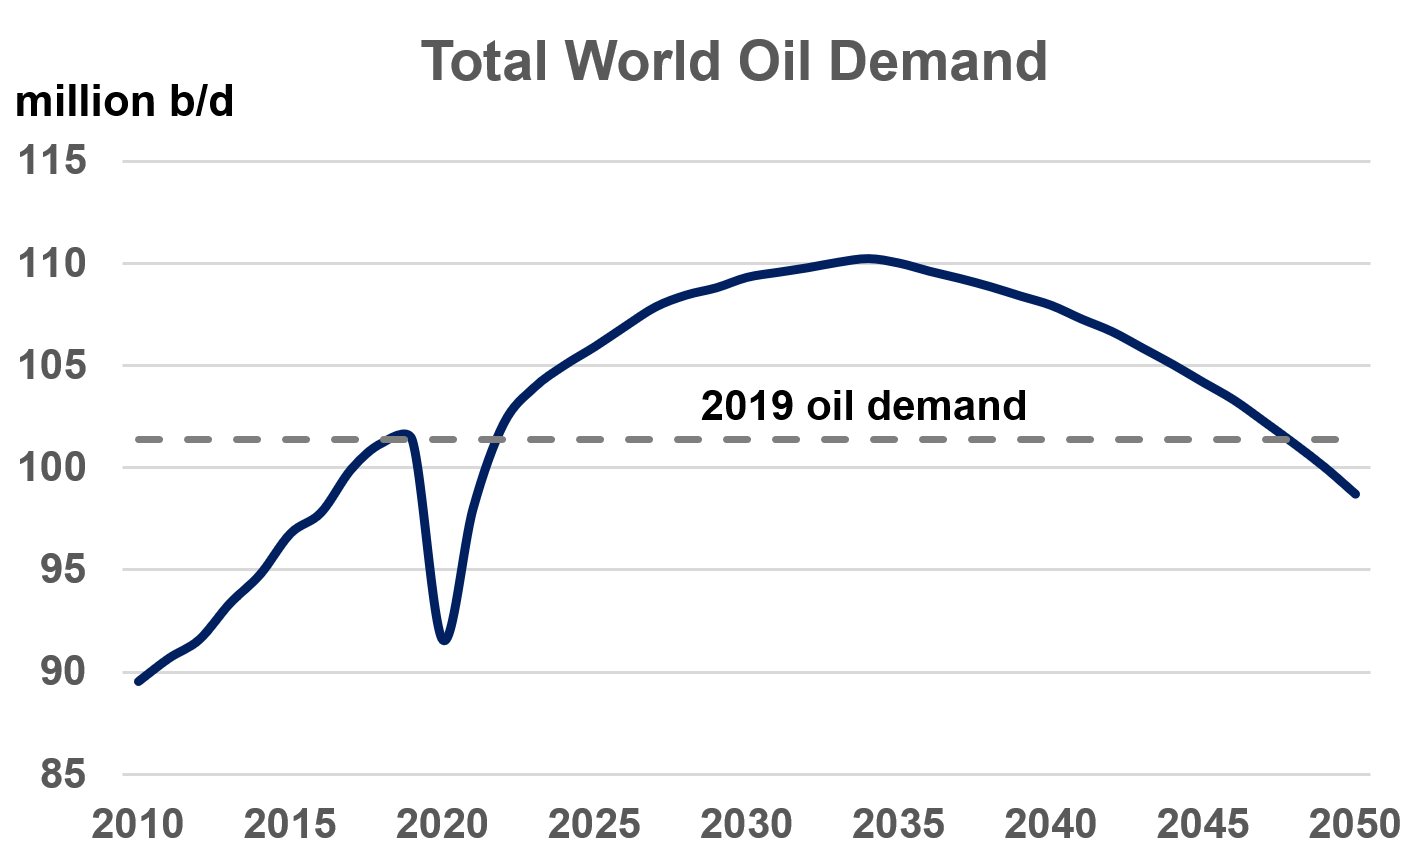
The first headline is that after the collapse in demand last year, expectations are that the oil market will continue to grow for at least another 10 years, with a number of analysts generally pointing to peak oil demand being reached in the early to mid-2030s.
A consensus view is that the political agenda, legislation, company strategies and personal choices will start to reverse growth in global oil demand from the mid-2030s onwards. The trajectory of decline is difficult to asses at this stage, and analysts have tended to set out various scenarios, but in the illustration here we show a decline that puts oil demand in 2050 just below the peak level seen in 2019 (and more-or-less at the same level as expected for this year). Read More
The environment & COP 26 come back into focus
Over the past 18 months all of the talk has been related to the pandemic, but worldwide politics is shifting and the environmental question is coming back into focus. The build-up to COP 26 starting on October 31st in Glasgow is likely to re-energise the debate. In this report we take an overview of the longer-term prospects for the oil markets and where this could leave the bunker sector in the run-up to political targets set for 2050; it is intended to be agnostic and an attempt to summarise current expectations over the much longer term.
Oil demand forecast to continue growing for at least another 10 years
The first headline is that after the collapse in demand last year, expectations are that the oil market will continue to grow for at least another 10 years, with a number of analysts generally pointing to peak oil demand being reached in the early to mid-2030s.
A consensus view is that the political agenda, legislation, company strategies and personal choices will start to reverse growth in global oil demand from the mid-2030s onwards. The trajectory of decline is difficult to asses at this stage, and analysts have tended to set out various scenarios, but in the illustration here we show a decline that puts oil demand in 2050 just below the peak level seen in 2019 (and more-or-less at the same level as expected for this year).
Though environmental measures will hit oil & bunker demand
The oil market is huge, and structural changes take a long time; for example, most of the gasoline and diesel cars coming out of showrooms today will still be around in the early 2030s and fossil-fuelled ships from the yards will still be operating in the 2040s. However, during the 2040s almost all new cars sales are expected to be electric vehicles (EVs), along with a number of new electric commercial vehicles, leading to the reverse from a growth oil industry to a declining one. This is hugely significant and why companies are adapting (or will be forced to adapt) to this new ‘more environmental’ world, including the shipping and bunker sectors.
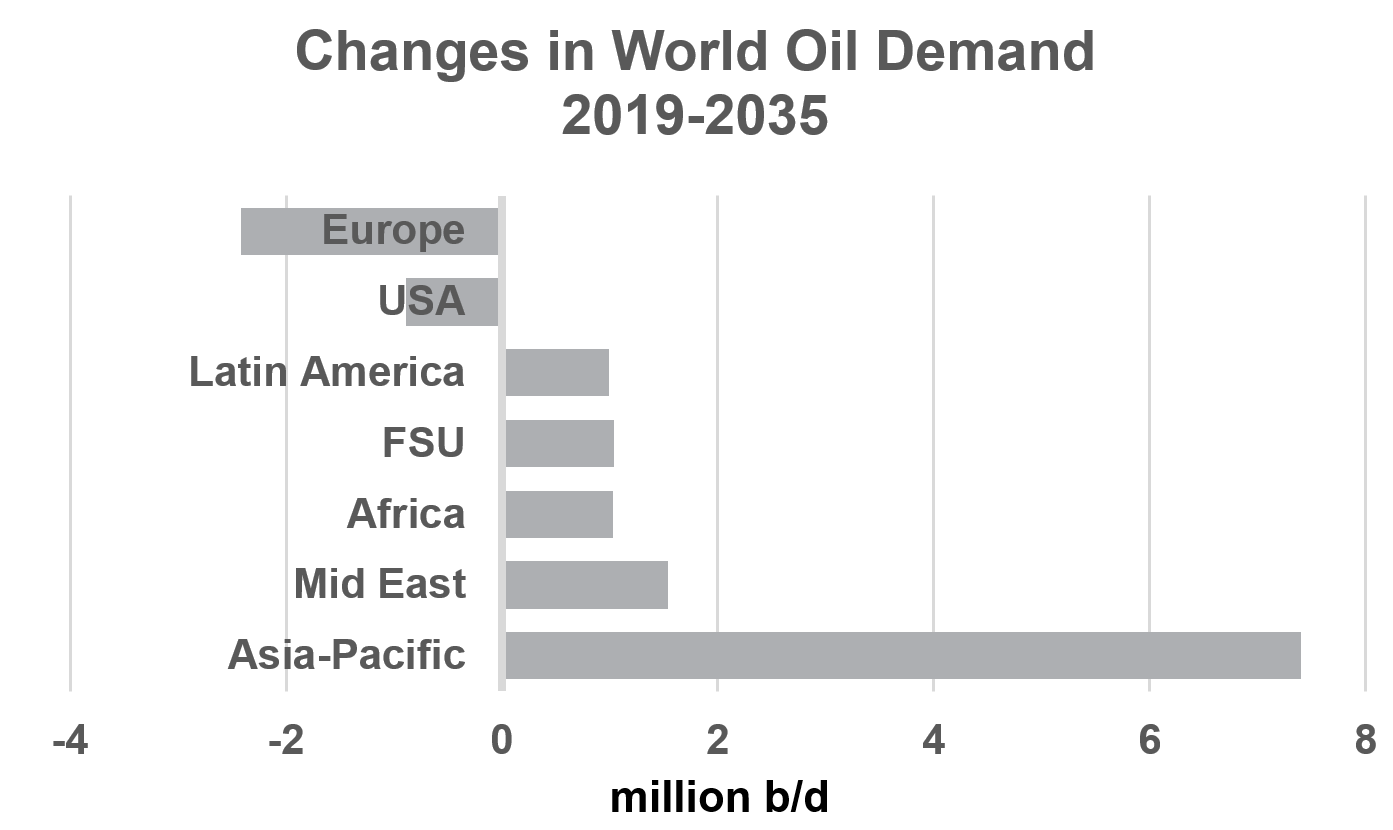
Different regions will be ‘hit’ at different times; Europe first?
The ‘helicopter view’ of the global market shows this rise and fall through to 2050, but governments, economies and regions will all trend at a different pace. Generalising on Europe as a whole, this is a well-established, ‘low growth’ economy and structurally easier to achieve a reduction in oil demand; oil demand in Europe could fall by around 2 million b/d between 2019 and 2035 (close to a 15% drop).
The shift in the US administration is now expected to support greater environmental moves, and here oil demand is also expected to fall through to 2035, although at a lower rate of around 5%.
However, in all other regions oil demand is expected to continue growing, with economic developments outweighing the environmental shifts over the next 10-15 years. The obvious ‘power-house’ behind the oil markets in this period is Asia-Pacific.
Ultimately oil demand is expected to decline
It is the long-term nature of structural changes in the oil sector that means the big, global shift in demand is more likely to start in the mid-2030s and accelerate through the 2040s. Changes in environmental regulations, consumer demands and company responses take time; existing legislation, decisions from COP 26 (and further down the line) are only likely to be seen on a global scale some 15-20 years from today.
It is in this longer time frame that all the big changes are likely to take place. European demand is expected to fall even further (down by around 20% over 2035-50), but the US market could see an even bigger structural change (down 30%), and significantly, demand in the Asian economies could be reversed and start to fall (by around 10% between 2035-50) as environmental developments overtake drivers from economic expansion.
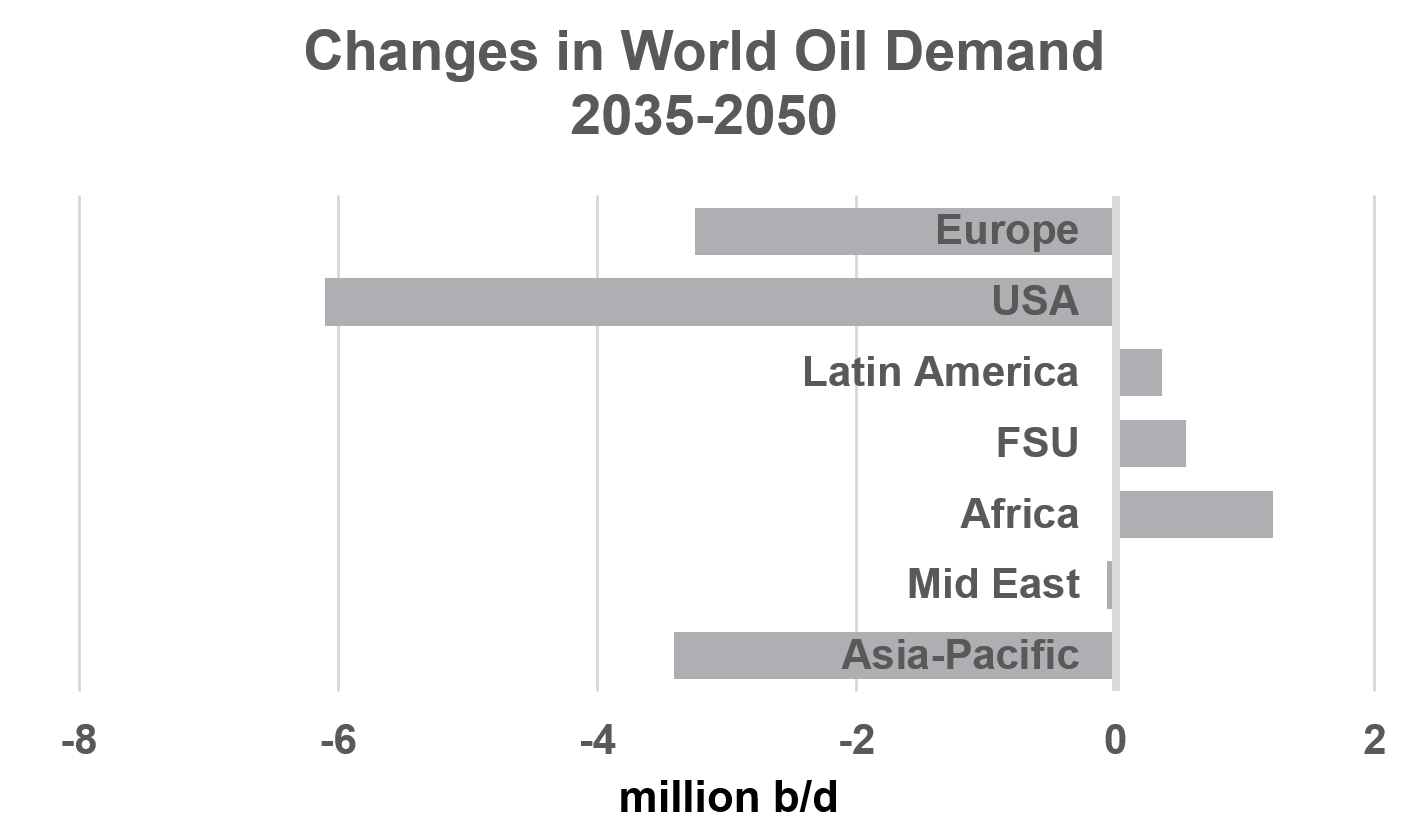
Oil demand in some regions is still forecast to grow in this longer-term period, but the dominance of Asia-Pacific, the US and Europe all in ‘environmental mode’ would far outweigh developments in these other areas; oil demand globally would be in decline.
Impacts on demand for different oil products will also vary
So far, we have looked at overall oil demand globally and by region, but what about individual products, and specifically demand in our sector, the bunker market?
Growth in oil demand over the next 10-15 years is focused on petrochemicals (naphtha and LPG) and transport fuels in Asia-Pacific (gasoline and jet). The general view is that demand for marine fuel oil will start to fall in the next few years and that requirements could be some 0.4 million b/d (25 million tons p.a.) lower by the mid-2030s, equivalent to a 10% drop.
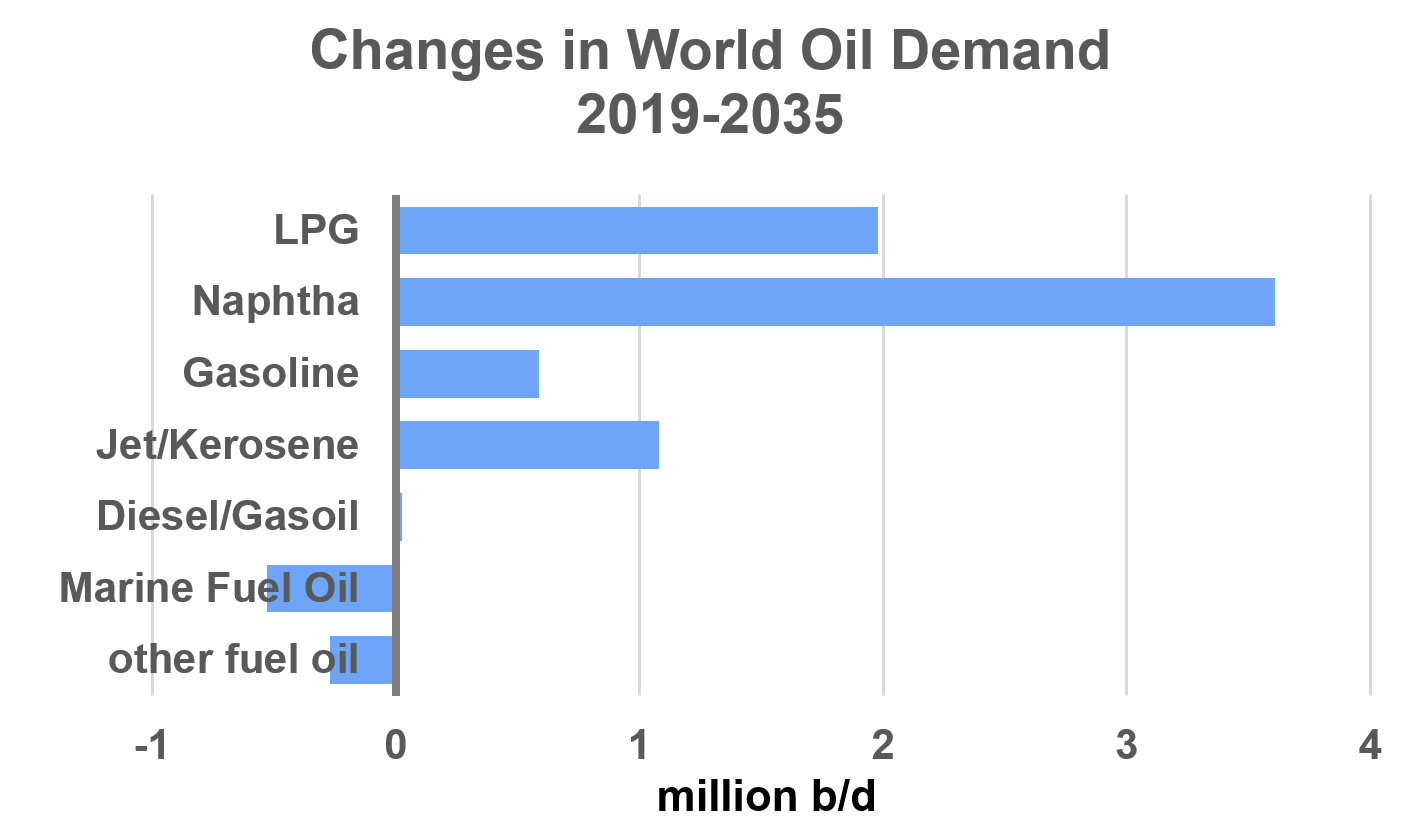
This shift is not surprising given the current push towards greater efficiency in the shipping industry and the IMO mapping out legislation and indices for the measurement of carbon intensities. These are destined to come into effect in 2023 with the Energy Efficiency Existing Ship Index (EEXI), the Ship Energy Efficiency Management Plan (SEEMP) and the Carbon Intensity Index (CII).
There is talk and discussion around alternative fuels, but even in this longer time-frame to 2050 the mainstay of the shipping industry is still likely to rely on fossil fuels and so any environmental gains are most likely to be met by the lower use of fuel oil and gasoil (i.e. greater efficiency).
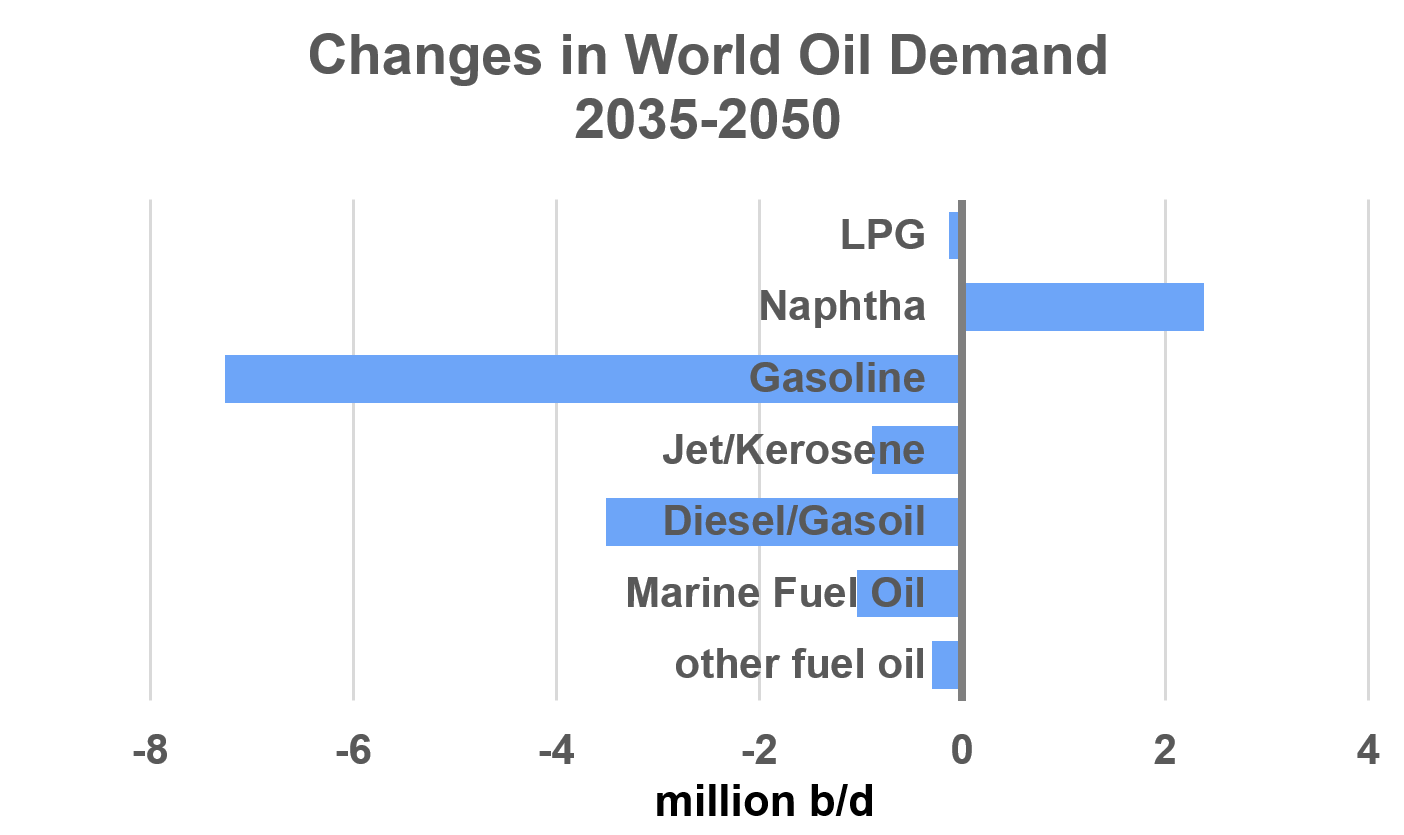
In the longer-term period to 2050, petrochemical demand is still forecast to grow (although there is obviously a huge debate here about plastics use). However, the structural change towards electric vehicles (EVs) is expected to ‘kick-in’, hence a reversal in gasoline and diesel demand, with global gasoline falling by around 7 million b/d (minus 25%) and diesel by 3 million b/d (minus 10%). Jet fuel demand is also expected to fall, with increased aircraft efficiency and the use of biofuels.
In our business, bunker demand is expected to continue falling throughout the longer term to 2050, but other parts of the oil market are likely to overtake ours in terms of radical shifts. Again, the size of the bunker is expected to fall with greater environmental efficiency gains, rather than any decline for international trade and movements.
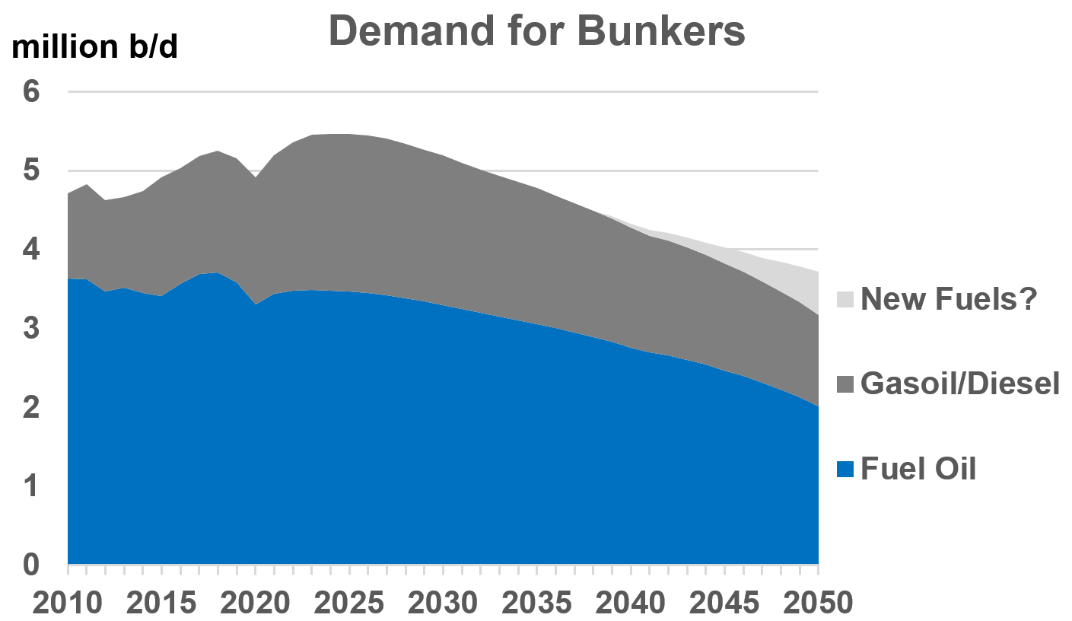
What could this mean for the size of the bunker market?
There are various indications of the total size of the bunker market, but for these purposes it is estimated at around 275 million tons p.a. for all ships (5 million b/d). The IMO has recently published a lower figure of 213 million tons p.a. for vessels above 5,000 GT in international trades.
With IMO legislation and strategies, plus political pressures from outside of our business and more stringent environmental requirements from the users of shipping, the demand on the shipping industry to hit environmental targets is clear.
Whilst there is talk of alternative fuels, ‘traditional’ fossil fuels are still likely to dominate our sector by 2050. This means the industry will have to achieve much greater efficiency (slower steaming for older vessels in the near term and technological advances in the longer term?). The bottom line is the size of the bunker market will fall from a current estimate of around 275 million tons p.a. and could reach around 250 million tons by 2035 and 175-200 million tons by 2050; its still a big business, but not as big as today; down 10% by 2035 and another 25%between 2035 to 2050?
It’s a long way out to forecast, but the environmental pressures are there
Summarising, this is a consensus case, where a number of higher and lower scenarios will also be valid. But it is always worth putting a ‘line in the sand’ and the discussions can move around this. Let’s see what the politicians and COP 26 come up with between now and November, and then the impact from the unstoppable moves towards a more environmentally acceptable path.
Steve Christy, Research Contributor
E: steve.christy@integr8fuels.com
Download this article as a PDF »
Sulphur Compliance & Enforcement
September 9, 2021
It was widely anticipated that IMO 2020 would bring significant challenges as to fuel quality and compliance with the new sulphur limit for VLSFO 0.50% Wt. not least due to the initial changes required for the infrastructure and because of the changing face of blends needed to achieve these lower limits.
It therefore wasn’t too much of a surprise when a spike of claims occurred initially, these perhaps due to cross-over or cross contamination of High Sulphur and Very Low Sulphur Fuels.
However, since then we have settled into a new normal whereby Sulphur Claims are worryingly still responsible for around 1 in 3 of every off- specification notice alleged for VLSFO.
Current Statistics
Data available for the last 90 days suggests that the global average for VLSFO Sulphur Content is 0.46%Wt which on the face of it appears good news.
Globally, when comparing thousands of lines of data, 97.5% of all VLSFOs tested at or below 0.50%Wt Sulphur during this time, 1.7% tested between 0.51 and 0.53%Wt Sulphur and 0.7% tested at or above 0.54%Wt Sulphur
However, when we drill into this further and consider key bunker hubs it is very noticeable how some blending hubs perform much worse than others. For example 4.3% of Rotterdam fuels test between 0.51% and 0.53% and 1.9% of VLSFO’s at 0.54% or above.
Singapore on the other hand, is seen to perform far better with less than 1% of all fuels testing above the 0.50% Sulphur limit which somewhat bucks the general trend that blend hubs are by far the highest risk areas for Sulphur Compliance. Read More
It was widely anticipated that IMO 2020 would bring significant challenges as to fuel quality and compliance with the new sulphur limit for VLSFO 0.50% Wt. not least due to the initial changes required for the infrastructure and because of the changing face of blends needed to achieve these lower limits.
It therefore wasn’t too much of a surprise when a spike of claims occurred initially, these perhaps due to cross-over or cross contamination of High Sulphur and Very Low Sulphur Fuels.
However, since then we have settled into a new normal whereby Sulphur Claims are worryingly still responsible for around 1 in 3 of every off- specification notice alleged for VLSFO.
Current Statistics
Data available for the last 90 days suggests that the global average for VLSFO Sulphur Content is 0.46%Wt which on the face of it appears good news.
Globally, when comparing thousands of lines of data, 97.5% of all VLSFOs tested at or below 0.50%Wt Sulphur during this time, 1.7% tested between 0.51 and 0.53%Wt Sulphur and 0.7% tested at or above 0.54%Wt Sulphur
However, when we drill into this further and consider key bunker hubs it is very noticeable how some blending hubs perform much worse than others. For example 4.3% of Rotterdam fuels test between 0.51% and 0.53% and 1.9% of VLSFO’s at 0.54% or above.
Singapore on the other hand, is seen to perform far better with less than 1% of all fuels testing above the 0.50% Sulphur limit which somewhat bucks the general trend that blend hubs are by far the highest risk areas for Sulphur Compliance.
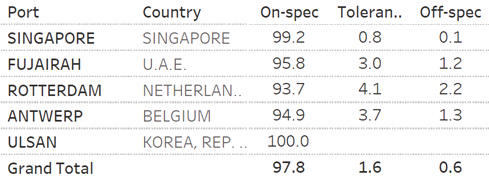
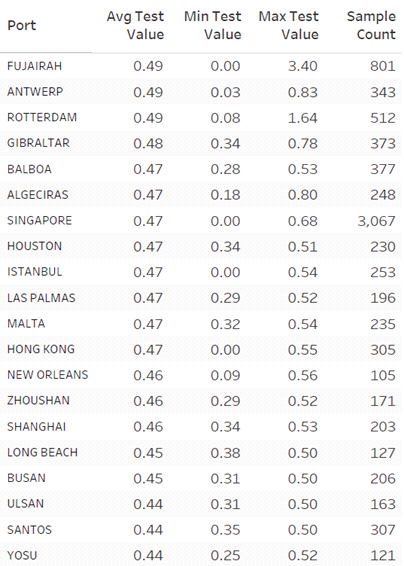
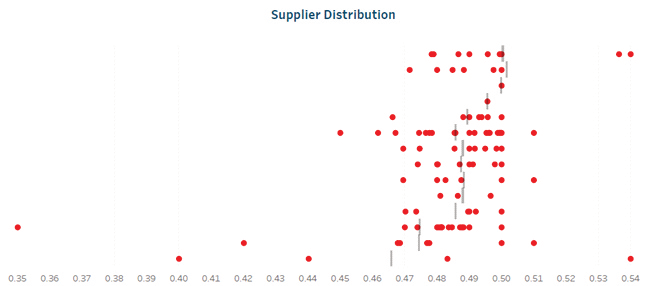
Table 3 – Distribution of Sulphur Content by Supplier in Rotterdam LSMGO however is seen to perform far better over the same period with 99.4% of all samples testing at or below 0.10%Wt, 0.3%testing at 0.11%Wt Sulphur and 0.3% of samples testing 0.12% or above.
We can therefore conclude that we are likely to receive four times as many notifications for Sulphur non- compliance for VLSFOs than MGOs and as a result it is essential that data driven purchasing is considered especially for VLSFOs.
Compliance
To refresh our memories let us first clarify what constitutes a non-compliance within Marpol Annex VI when it comes to Sulphur in bunker fuels.
For VLSFO, the Marpol Sample provided by the Supplier (& listed on the BDN) cannot exceed 0.50% Wt. Sulphur and they do not benefit from the tolerance (written around 95% confidence limits) that the vessel enjoys whereby the ‘In Use’ or ‘Onboard samples’ are only non-compliant at the 0.54%Wt Sulphur level or above.
Similarly for MGO, the supplier cannot exceed 0.10%Wt Sulphur but the ‘in use’ or ‘onboard’ samples are only non-compliant at 0.12%Wt Sulphur or above.
Moreover, it is important to draw a clear line in the sand between the commercial samples as governed by the bunker contract and the Marpol sample placed onboard the vessel for regulatory purposes with regard their value in defining compliance (or otherwise).
Simply put, commercial samples are not defined in the Sulphur verification procedure within Appendix VI of Marpol Annex VI. Marpol Annex VI does not even mandate the testing of an owner’s sample, only that a compliant BDN is placed onboard the vessel along with a Marpol Sample, this borne out by anecdotal evidence of owners requesting Sulphur is not reported on their quality reports due to the difficulties that may arise as a result.
Enforcement
Sadly, the only consistent part of enforcement by Port State Control (PSC) is their inconsistent approach to non-compliance.
Examples of concern include Authorities treating a fuel as non-compliant based on a single in use sample testing within the tolerance levels at 0.51 or 0.52% or even debunkering being demanded basis an owner test marginally above 0.50%Sulphur.
This lack of clarity has been causing concern for some time but despite lobbying by IBIA within IMO we are still no closer to a consistent global approach as to the basis that PSCs determine that a fuel is non-Compliant as per Marpol Annex VI.
IBIA pushed to ensure a consistent approach to verification by implementing the amended Sulphur verification procedure (as adopted by MEPC 75) however this was rejected.
This is disappointing as these procedures cover the analysis of the Marpol sample to verify the fuel delivered to the vessel and the use of ‘in use or onboard’ samples to verify the fuel in use, this again incorporating 95% confidence
Therefore it remains possible that a black and white outcome still could be enforced onto a vessel despite the shades of grey basis the inherent errors of the test method itself and these concerns can only lend themselves to adjusting your buying strategies accordingly and trying to prevent these issues at source.
It is important therefore to use online platforms such as Engine where quality benchmarking gives us the best chance to navigate through this minefield and allows our customers to sail on with fair winds and calm seas. So to conclude, whilst these inconsistencies remain it is imperative in to ensure that purchasing strategies incorporate port and supplier risk and benchmarking of suppliers and ports can save you a lot more than money, it can stop a claim spoiling your day?
Chris Turner, Manager – Bunker Quality & Claims
E: Chris.T@integr8fuels.com
Download this article as a PDF »
Additional costs can make bunker buyers pay more
August 19, 2021
In the previous articles we looked into how bunker buyers unknowingly pay more for the fuel bought, either by buying fuel with a low energy content or by suffering losses due to density short-lifts. However, the total cost of fuel is also influenced by the additional charges and fees, which vary significantly by port and often between suppliers in the same port. Additional costs are generally known at the point of enquiry however these are sometimes overlooked when planning or buying bunkers, resulting in overpayments.
Additional fees can significantly add to stem cost
A sample of over 6,000 stems globally covering the first half of 2021 has been analysed of which over 30% were found to contain some sort of additional fee.
These fees typically include barging, port charges and dues, various taxes and surcharges, among others (Figure 1). On average, among the stems with additional fees the cost of the fuel itself contributes around 92% to the total stem value, however this varies dramatically by stem.
Figure 1 - Additional fees broken down. Source: Integr8 Fuels Europe Ltd.
Knowing where additional costs can hit hard is critical to buying bunkers competitively, particularly when it comes to the barging fees as these on average represent over 5% being by far the largest contributor of all non-fuel related costs.
Depending on the port, barging fees are often charged on a tiered basis with the lumpsum charges for up to a certain quantity and a $/mt charge for the quantities above.
In a number of ports in Americas different suppliers charge different barging fees (example New York), which makes it even more difficult for a bunker buyer to calculate the true cost of bunkers and compare suppliers between themselves. The problem is compounded by additional fees and taxes that are often chargeable as a percentage of the total stem value.
Additional fees in the bunker industry ironically remind of the fee structure when ordering a takeaway delivery online. To what otherwise looks like a cheap meal one needs to pay extra for a side, the platform then charges delivery and service fees, and because demand is high it gives an option to pay extra for prioritised delivery. In the end, what initially looked like a good value lunch becomes a relatively expensive meal overall. Read More
In the previous articles we looked into how bunker buyers unknowingly pay more for the fuel bought, either by buying fuel with a low energy content or by suffering losses due to density short-lifts. However, the total cost of fuel is also influenced by the additional charges and fees, which vary significantly by port and often between suppliers in the same port. Additional costs are generally known at the point of enquiry however these are sometimes overlooked when planning or buying bunkers, resulting in overpayments.
Additional fees can significantly add to stem cost
A sample of over 6,000 stems globally covering the first half of 2021 has been analysed of which over 30% were found to contain some sort of additional fee.
These fees typically include barging, port charges and dues, various taxes and surcharges, among others (Figure 1). On average, among the stems with additional fees the cost of the fuel itself contributes around 92% to the total stem value, however this varies dramatically by stem.
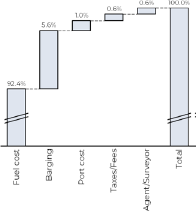
Figure 1 – Additional fees broken down. Source: Integr8 Fuels Europe Ltd.
Knowing where additional costs can hit hard is critical to buying bunkers competitively, particularly when it comes to the barging fees as these on average represent over 5% being by far the largest contributor of all non-fuel related costs.
Depending on the port, barging fees are often charged on a tiered basis with the lumpsum charges for up to a certain quantity and a $/mt charge for the quantities above.
In a number of ports in Americas different suppliers charge different barging fees (example New York), which makes it even more difficult for a bunker buyer to calculate the true cost of bunkers and compare suppliers between themselves. The problem is compounded by additional fees and taxes that are often chargeable as a percentage of the total stem value.
Additional fees in the bunker industry ironically remind of the fee structure when ordering a takeaway delivery online. To what otherwise looks like a cheap meal one needs to pay extra for a side, the platform then charges delivery and service fees, and because demand is high it gives an option to pay extra for prioritised delivery. In the end, what initially looked like a good value lunch becomes a relatively expensive meal overall.
Watch out for extra fees in North America, Med and Red Sea
Similarly, in the bunker industry additional fees can easily make what looks like a competitive price quoted by a supplier into a rather expensive quotation overall, particularly when quotes from different ports are compared.
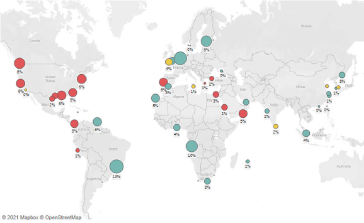
Figure 2. Key ports by prevalence of additional cost stems and proportion of such costs in average stem value. Source: Integr8 Fuels Europe Ltd.
Figure 2 shows the share of stems with additional costs in the key global ports as well as the share of additional costs in the average stem value. This may vary depending on the data sample given that additional costs often include a single lumpsum element which is less felt for larger quantity stems, however the map shown should still be representative.
On Figure 2, the green circles are for ports where less than one in three stems come with additional fees. Yellow circles are for ports where between one and two in three stems have additional fees applied, while in red ports additional fees are charged on most occasions. The larger the circle the higher the proportion of additional fees in a stem hence the larger red circles are of the most interest. These can typically be found in North and Central America as well as around Mediterranean and Red seas. Although some green ports have rather large circles meaning a small proportion of stems have high additional fees, these are mostly due to the smaller sized stems which are invariably charged for barging, while their larger quantity counterparts are not.
While some ports have red circles, these can also be due to the addition of the non-barging fees. Port fees and agent costs can often be packaged with the fuel (example Lisbon) and almost as often be paid as part of voyage expenses (example Gibraltar). These costs, however, apply in any case and can hardly be avoided although running a fair comparison by either including (preferably for bunker only calls) or excluding them is nevertheless important.
Detailed costs calculations are key
Figure 3 shows an example of bunker planning between Houston and Panama. Please note this example may not always be representative and depends on the market conditions, however the main point is to show the importance of calculating the total bunkering cost, including barging and other fees and how these may influence the end result.
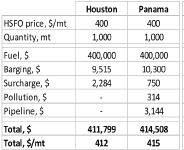
Figure 3. Houston vs Panama bunker intake planning – Source: Integr8 Fuels Europe Ltd.
In the current market environment HSFO can often be found offered at competitive prices in Panama, often a few dollars below Houston, however assuming that both ports are priced equally buying 1,000mt of HSFO turns to be more expensive in Panama, given the additional fee structure whereby the owner will overpay just under $3,000 for the stem. This calculation does not include any agency fees for Panama or out of port charges in Houston.
However, due to the structure of the fees, Panama will not always be the expensive port of the two. Figure 4 (below) shows the sensitivity chart which illustrates that Panama is the cheaper port for quantities up to around 700mt and over 2,000mt.
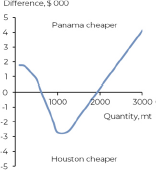
Figure 4. Total paid difference between Houston and Panama on a HSFO stem. Source: Integr8 Fuels Europe Ltd.
While in this case the monetary difference may be relatively small, it can add up significantly over the course of a year or for a fleet of vessels. The differences can also vary if bunkering is considered in ports with a different structure of additional fees or with none fees overall – this could be for a voyage whereby Suez is compared with Malta or a voyage where Piraeus is competing with Istanbul, among others.
Overall, additional costs including barging can significantly alter the economics of buying fuel from a supplier or a port and taking this into account, together with calorific value, density short-lifts and overall fuel quality should yield a good benefit for the bunker buyer.
Anton Shamray, Senior Research Analyst
E: Anton.S@integr8fuels.com

Where do forecasters see VLSFO prices by the end of the year?
July 28, 2021
High prices took a sharp dip last week; but it was only very brief
In our report a month ago we highlighted the bullish nature the oil market has adopted and through the first half of this month the average Brent crude price (front month futures) was at $75/bbl; its highest for almost 3 years. Throughout this period Brent traded in the $74-78/bbl range, but prices never stay the same, and at the start of last week there was a ‘wobble’ and we saw Brent fall by $5/bbl, to below $70/bbl (minus 7%)
This sharp drop came with ‘jitters’ in the financial markets surrounding higher Covid cases and at a time of a two-week delay in OPEC+ reaching an agreement from its early July meeting.
However, what is interesting is that the bearish signals were very short-lived, and prices have very quickly rebounded, with Brent back above $74/bbl; the underlying price sentiment is still supportive at these levels.
Read More
High prices took a sharp dip last week; but it was only very brief
In our report a month ago we highlighted the bullish nature the oil market has adopted and through the first half of this month the average Brent crude price (front month futures) was at $75/bbl; its highest for almost 3 years. Throughout this period Brent traded in the $74-78/bbl range, but prices never stay the same, and at the start of last week there was a ‘wobble’ and we saw Brent fall by $5/bbl, to below $70/bbl (minus 7%)
This sharp drop came with ‘jitters’ in the financial markets surrounding higher Covid cases and at a time of a two-week delay in OPEC+ reaching an agreement from its early July meeting.
However, what is interesting is that the bearish signals were very short-lived, and prices have very quickly rebounded, with Brent back above $74/bbl; the underlying price sentiment is still supportive at these levels.
Bunker prices will trend with crude price movements, and the crude price drop last week led to VLSFO quotes in Rotterdam and Singapore falling by $25-30/ton (minus 4-5%). This was slightly less than the 7% fall in Brent prices, but the price tracking is clear.
Like crude, the drop in bunker prices was extremely brief and since then there has also been a rebound, with prices now back to where they were one and a half weeks ago.
OPEC+ has come up with a strong, price supportive agreement
In our report a month ago we highlighted the demand-led nature in the price recovery, and in particular the drive from the US. We then made some concluding comments on oil supply, with US oil production, Iranian sanctions and what the OPEC+ group will do.
Oil supply is an important feature of ongoing price determination, and this was clouded in the wake of initial disagreement at the July 1st-2nd OPEC+ meeting. At this session the UAE blocked any extension to the current agreement, wanting an increase in its’ baseline reference allocation. Things were resolved after two weeks, with 5 OPEC+ countries getting a higher reference allocation from next May and the end date of the agreement was extended from April 2022 to December 2022. On this basis there now appears to be a rigorous agreement in place, gradually phasing in a production increase of 0.4 million b/d per month through to April next year, and then further increases through to December 2022.
This ties in with OPEC’s general approach to the market, managing an underlying price (it is impossible to micro-manage an exact and consistent price). It also gives international markets the confidence of sufficient supplies to prevent prices surging and damaging economic growth; any damage to future economic growth will ultimately come back to lower oil demand and reduced requirements for OPEC crude. In fact, the Saudi oil minister stressed the importance of looking further ahead, and in this case to end 2022.
The graph below illustrates the extent of the major production cutbacks undertaken by the OPEC+ group and how the planned, managed return in output is expected to take place.
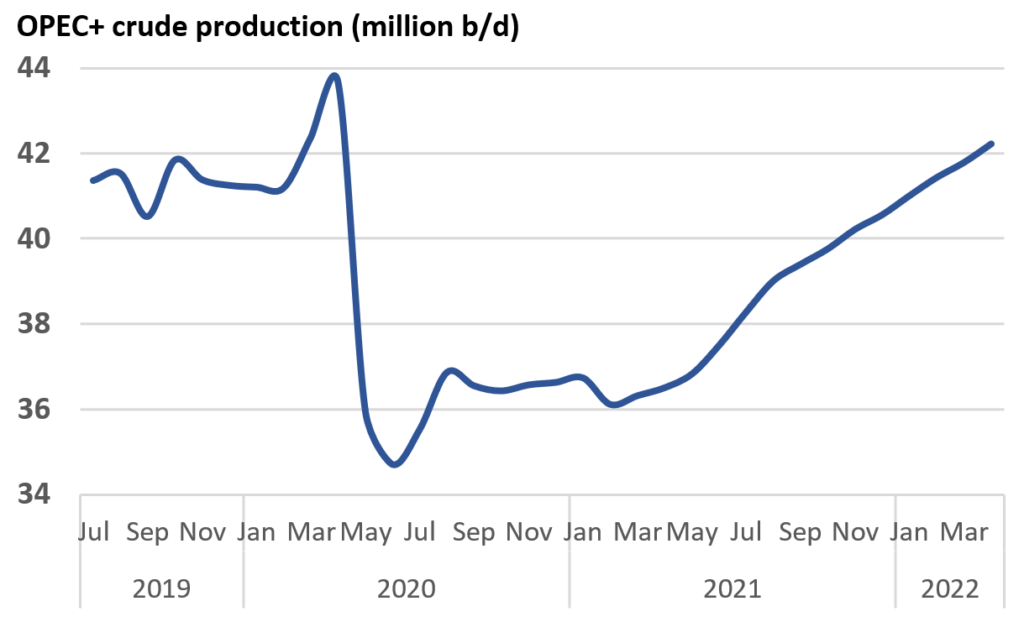
Within this, there may be issues that some OPEC+ countries are not able to get back to their pre-pandemic production levels because of deterioration in their upstream sector over the past 18 months. This could cause a potential spike in prices, and one analyst is still talking about $100 prices in the middle of next year. However, if this is the case, it is highly likely that OPEC will respond by using some of its’ spare production capacity to make up the shortfall in order to prevent any such extreme price spike.
This managed and gradual increase in OPEC+ production is now seen as supportive to oil prices. At the same time, anticipated increases in oil demand with successful vaccination programs will keep oil fundamentals ‘tight’. This is the general view in the market at the moment and is reflected in the leading forecasts of oil prices over the rest of this year and going into 2022.
Analysts see crude prices at, or above current levels for the rest of the year
Price dips like last week may be a continued feature of the market, with economic concerns being raised with any hint of increased lockdowns, negative news on Covid variants, or even delays to opening up. But as long as there is a visible path back to ‘normality’ with oil demand rising and OPEC+ managing, then it seems the underlying bullish nature in the market will continue.
Looking at a range of crude price forecasts over the rest of this year, the view is that prices will at least remain around current levels. The lowest forecasts for Brent crude through to end year are in the low $70s, with the higher forecasts some $10/bbl above this, in the low $80s. A number of forecasters then fall somewhere within this relatively narrow range.
The consensus view is that we are definitely well beyond low oil prices, and all the listed analysts’ price projections are considerably higher than we saw throughout 2019, before the pandemic hit. In fact, you have to go back to mid/late 2018 to see prices at similar levels to these forecasts.
What does this mean for bunker prices?
It is often ‘dangerous’ when there is such a close consensus on the outlook, but this does reflect current thinking and a relatively balanced world; lower covid numbers and a well-managed production profile going forward.
The question then is: what does this look like for bunker prices? With the end 2019 introduction of the VLSFO grade, there is not the same period of historical comparison, but if these crude price analysts are correct, it would mean VLSFO prices at least remaining close to current levels through to the end of the year, and a consensus view that prices could be slightly higher.
Singapore VLSFO prices are currently quoted around $535/ton, and based on the lower crude price outlook this would suggest Singapore VLSFO averaging around $525/ton in the 4th quarter this year. Taking the higher forecast of Brent at just above $80/bbl would imply Singapore VLSFO slightly above $600/ton in Q4; some $70/ton higher than today.
It then depends on how much you believe the forecasters. These groups only work with what they know and their view of the future based on today’s understandings. We have seen how rapidly new events can change things, but it is still important to understand what is happening in the market and what is driving prices in our business (and it also keeps forecasters employed).
Steve Christy
E: steve.christy@integr8fuels.com

The oil market is bullish and crude prices are now higher than just before the pandemic started; what’s driving this and what about bunkers?
June 28, 2021
Around this time each month we tend to take a step back and look at the ‘bigger picture’ developments in the oil market. What happens here clearly underpins the price of bunkers.
The recent headline news in the oil market has been very bullish. In this report we look at why this is happening, draw some pointers for the future and see how bunker prices relate to this.
Brent now close to $76 and higher than just before the pandemic.
The recent hike in crude oil prices has pushed Brent front month futures close to $76/bbl, which is $6/bbl more than the January 2020 highs, just before the pandemic hit. The main drivers to this latest price rise are that oil demand is rising and expected to continue to recover, (especially in the US) and that headline stock levels are falling.
The graph below illustrates the phases where Brent crude prices have increased from their extreme lows in April last year (and how VLSFO prices have generally tracked this):
Firstly, Brent up to and then remaining in the low $40s throughto November;
Then rising almost continuously to a peak of $70/bbl in earlyMarch;
Followed by and easing and stuttering around $65/bbl for 2months;
And now Brent moving well into the $70s in June. Read More
Around this time each month we tend to take a step back and look at the ‘bigger picture’ developments in the oil market. What happens here clearly underpins the price of bunkers.
The recent headline news in the oil market has been very bullish. In this report we look at why this is happening, draw some pointers for the future and see how bunker prices relate to this.
Brent now close to $76 and higher than just before the pandemic.
The recent hike in crude oil prices has pushed Brent front month futures close to $76/bbl, which is $6/bbl more than the January 2020 highs, just before the pandemic hit. The main drivers to this latest price rise are that oil demand is rising and expected to continue to recover, (especially in the US) and that headline stock levels are falling.
The graph below illustrates the phases where Brent crude prices have increased from their extreme lows in April last year (and how VLSFO prices have generally tracked this):
- Firstly, Brent up to and then remaining in the low $40s through
to November; - Then rising almost continuously to a peak of $70/bbl in early
March; - Followed by and easing and stuttering around $65/bbl for 2
months; - And now Brent moving well into the $70s in June.
Demand expectations in the big economies is pushing prices higher
In the report last month, we highlighted how the COVID impact on bunker demand has been far less than almost all other
As always, the market is responding a number of fundamental supply and demand factors, along with expectations and
sentiment. The current headlines centre on successful vaccination programs in the big economies, the easing in restrictions and the accompanying boost to oil demand (New York and California have both recently lifted restrictions).
These expectations are backed up by a number of analysts looking at a very positive view for oil demand increasing over the rest of this year (and into 2022). The chart below shows forecast growth in demand by country or main region from Q2 to Q4 this year and clearly emphasises the anticipated rises in the big economies of the US, India, Europe and China. The regions in this graph account for more 3 million b/d growth out of a World total just over 4 million b/d over this period; hence the significance and focus on these countries.
News on vaccination programs, easing in restrictions and Covid infections in these big economies will strongly influence market sentiment on prices.
US weekly stocks data add to the bullish sentiment
The recent very positive sentiment can be further backed up by looking at product stock levels. The problem here is that almost all data is at least 1-2 months delayed. The exception is in the US, where weekly data is published and does ‘grab’ the headline news. Although this is typically later revised with monthly data, the weekly stocks release (API on Tuesdays and EIA on Wednesdays) can have a huge influence on futures prices.
The graph below shows the published development in US gasoline, distillate and jet fuel stocks combined, covering 2019, 2020 and 2021 so far. Using 2019 as a reference position, it is clear the 2020 collapse in oil demand related to the pandemic meant oil stocks surged (not only in the US, but also globally).
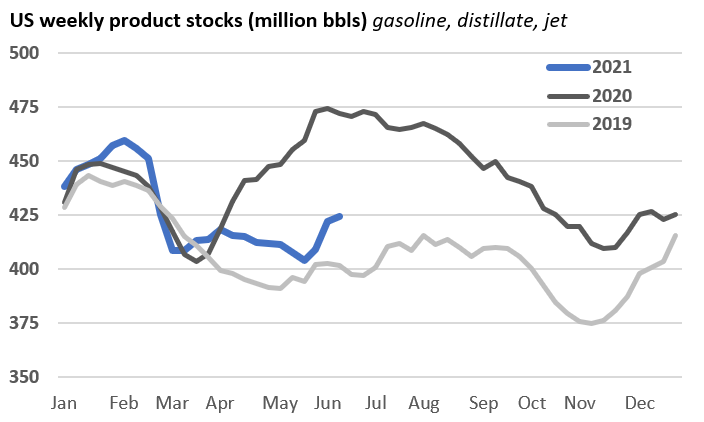
However, more recently US product stocks have been running relatively close to 2019 levels, and way below the peaks seen this time last year. If the strong demand expectations in the US play out, then published stocks data is likely to remain ‘more balanced’ and so be price supportive; of course, the converse is also true. The weekly US stocks data is very often a contributing factor to price sentiment.
Crude prices have risen, but what about bunkers?
Combining these more recent bullish sentiments has pushed crude prices to above pre-pandemic levels and the following graph is a closer focus on what has happened over the past 8 weeks. There has been a near continuous rise in Brent crude prices towards $75/bbl over this period. However, although VLSFO prices generally moved with crude in May, this has not happened in June; VLSFO prices in Singapore have remained relatively flat whilst Brent has climbed another $4.50/bbl
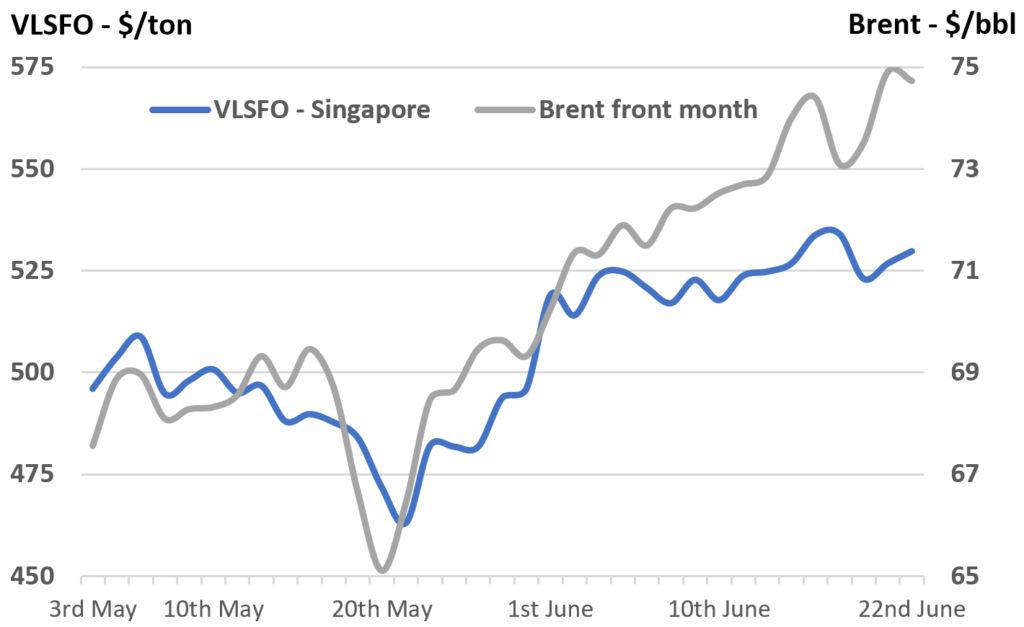
In our report from late May we highlighted the possibilities that VLSFO prices are likely to weaken relative to crude as demand for other products rise. This could be the case here, with further increases in product demand in the big economies. However, these are subtleties, and crude prices will continue to generally underpin prices in our sector.
Demand has been the story, but supply will also become a feature
Looking ahead, market sentiment will be driven by the confidence in oil demand increases in the US, India, China, other Asian economies and also Europe; headline stories on infections, lockdowns and vaccinations are key to watch.
This report is a focus on the demand side issues that have led to the latest increase in crude prices, but in the outlook we also have to take oil supply into account. With crude prices getting back to above pre-pandemic levels, it can be argued that the OPEC+ agreement to cut production has worked well. At its height, this group removed around 5 million b/d supply from the market.
At their June 1st meeting, OPEC maintained the existing plan to raise production through to July, and a focus will now be on what decisions are taken at their July or possibly August meetings to raise output.
Apart from demand, the other factor for the group to consider is non-OPEC production and here only limited gains in output are expected over the remainder of this year. In fact, despite the recent sharp rise in oil prices, US production increases will take some time to come through.
Indications are that increases in cash flows are going more towards debt reduction rather than any big rise in drilling activity. As a result, total oil output in the US is forecast to remain fairly flat for most of the rest of this year. Also, the US/Iran negotiations on a nuclear agreement and the lifting of sanctions are expected to go on for longer, pushing back any immediate large-scale increase in Iranian crude exports to the market.
Looking at the demand and supply fundamentals, there is significant room for OPEC+ to implement increases in production over the rest of this year, as long as demand increases are in line with general expectations.
Also, OPEC has traditionally managed prices not going ‘too high’, so as not to kill off economic growth and subsequent increases in oil demand. Hence, the internal pressures to raise output and the political direction not to let oil prices escalate too ‘excessively’, gives the OPEC+ group the perfect platform to continue raising output.
Demand could hit record highs next year, but prices….
Many forecasters are raising their price expectations for this year, with a general target of Brent in the $70s. Some people are even talking about $100 crude oil prices, and these comments often grab the headlines. Never say “never”, but if prices remain around current levels, the OPEC+ group will raise output and supplies will increase over the rest of this year. On a final note, behind all of this, demand for oil is still rising, and global consumption is forecast to exceed 100 million b/d later next year and even reach record highs by the end of the year. Concluding, almost everything here is relatively bullish; we keep watching the demand factors, what OPEC+ does and Iran to see how things actually pan out.
Steve Christy
E: steve.christy@integr8fuels.com

How are bunker prices doing compared with the rest of the oil market and in what direction are they going?
May 27, 2021
Recent Price Movements: A divergence between crude & bunkers
In mid-April we looked at the ‘bigger picture’ developments in the oil market and highlighted the key drivers that are likely to influence the absolute price of oil (and how bunker prices fitted into this). In this report we dig a bit deeper, looking at what is happening to the price of bunkers in relation to crude and other main oil products; are there differences and are we back to ‘normal’ yet?
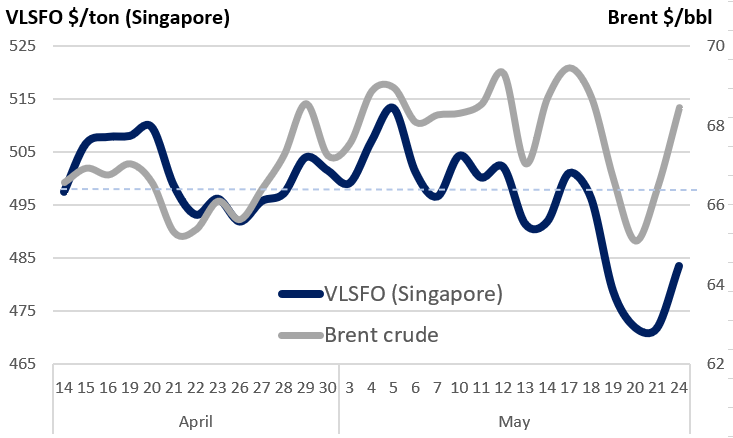
Current crude oil prices are $2/bbl higher than in mid-April (equivalent to $15/ton), but conversely VLSFO prices in Singapore and Fujairah are more than $10/ton lower. Singapore VLSFO prices tended to track crude price movements through the second half of April and early May, but over the past 3 weeks there has been a big divergence. Brent crude is currently towards the high of the recent $66-69/bbl range, but VLSFO prices East of Suez are now in a much lower trading range than in mid-April, at around $485/ton. Read More
Recent Price Movements: A divergence between crude & bunkers
In mid-April we looked at the ‘bigger picture’ developments in the oil market and highlighted the key drivers that are likely to influence the absolute price of oil (and how bunker prices fitted into this). In this report we dig a bit deeper, looking at what is happening to the price of bunkers in relation to crude and other main oil products; are there differences and are we back to ‘normal’ yet?
Current crude oil prices are $2/bbl higher than in mid-April (equivalent to $15/ton), but conversely VLSFO prices in Singapore and Fujairah are more than $10/ton lower. Singapore VLSFO prices tended to track crude price movements through the second half of April and early May, but over the past 3 weeks there has been a big divergence. Brent crude is currently towards the high of the recent $66-69/bbl range, but VLSFO prices East of Suez are now in a much lower trading range than in mid-April, at around $485/ton.
Reiterating what is happening to demand by product
In the report last month, we highlighted how the COVID impact on bunker demand has been far less than almost all other products; especially against the jet market as a proportion of its overall size (which has been hardest hit of all), and for gasoline in volume terms.
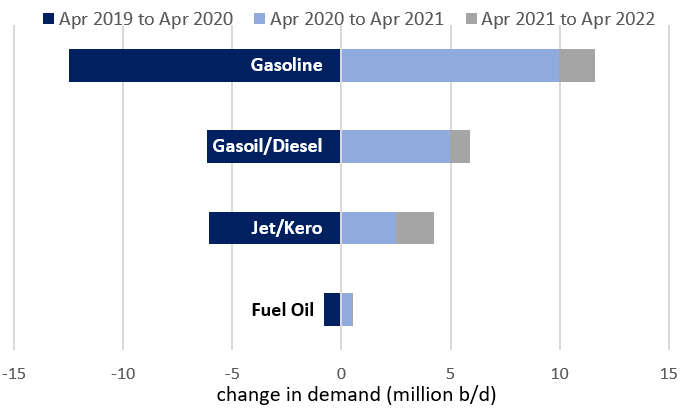
The graph below illustrates how hard demand volumes have been hit in each main sector, and clearly shows the extreme demand impacts on gasoline, gasoil/diesel and jet and how well ‘protected’ the fuel oil market was; there was only a minimal drop in fuel oil demand between April 2019 and April 2020 levels.
However, after demand for these other products collapsed in early 2020, the pattern has been reversed and demand has rebounded over the past 12 months, albeit on a stuttering and regional basis. Because bunker demand was least affected, so there is no major, overall rebound in our market.
The underlying global position now is that there is growing support for other products, and expectations are that this will continue. This then helps support crude prices and higher refinery throughputs.
Based on the demand rebound over the past 12 months, it would seem that a lot of the re-balancing has already taken place, but there are still some more demand gains to be seen in other products over the coming 12 months. This would suggest pricing relationships between bunkers and other products have already made a major move back to pre-pandemic ‘normality’, but we could see some further movements over the next year.
Singapore VLSFO prices relative to jet have fallen to their lowest levels
For bunkers, future relationships are not necessarily going back to their pre-pandemic ‘norms’. VLSFO had only just started to be mass-marketed a few months before the pandemic hit.
Also, going forward, high sulphur fuel oil may be weaker against most other products than the historical ‘norms’, because of the large-scale switch out of this product with IMO 2020.
However, looking at the relative price of bunkers versus the jet market, the premise that we have already seen a major revision is borne out. In Singapore, VLSFO peaked at 40% above jet prices at the outset of the pandemic (on a weight basis). During the second half of last year VLSFO and jet were priced more-or-less the same, but over the past month this relationship has eased and VLSFO is now at its weakest relative position to jet, at around 87% of the price. This ties in with the demand picture outlined above, and as jet demand increases over the next 12 months, this price relationship may well weaken further.
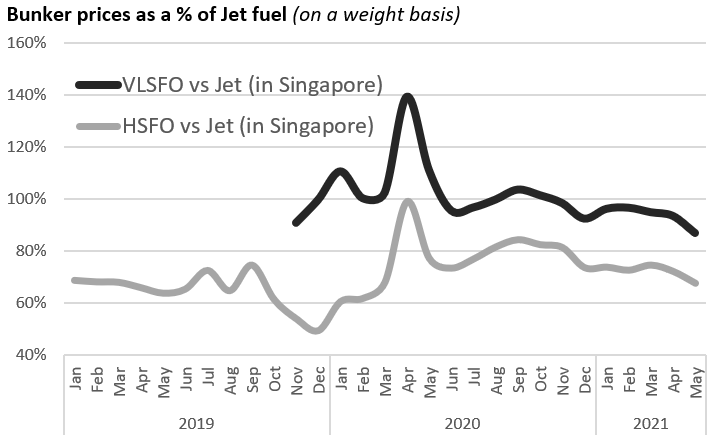
The trend has been similar for HSFO against jet prices. In ‘normal’ times before the pandemic, HSFO was priced at around 65% of jet. The unprecedented pandemic condition meant that HSFO and jet prices were briefly the same! Again, the situation has eased and fallen more sharply over the past month. Current relative prices put HSFO back to the 2019 levels versus jet, at around 65%. However, the specification and demand changes in the bunker market may mean HSFO continues to weaken on an underlying basis against jet.
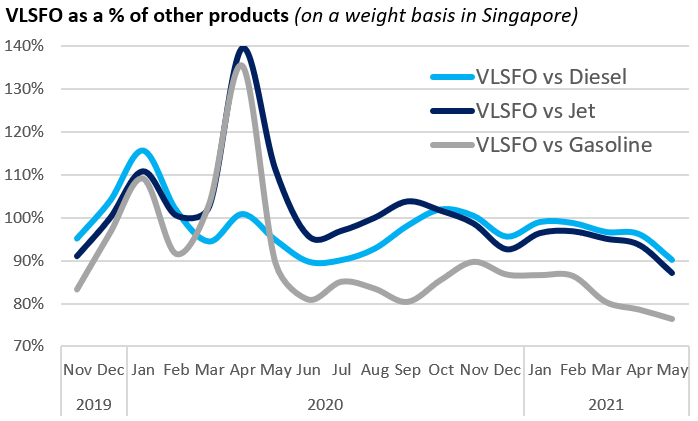
Singapore VLSFO is also at relative lows versus other products
These relative bunker price movements have not been isolated just to the jet market. The graph on the next page illustrates Singapore VLSFO prices against other local cargo product prices and shows the relative price of VLSFO falling across the barrel.
Current VLSFO prices relative to other product prices in Singapore are now at their lowest since the large-scale introduction at end 2019
Bunker prices relative to crude incorporate most of the key factors
All of these individual product issues are wrapped up in the crude price, and it is no surprise that bunker prices relative to crude have followed a very similar pattern to those outlined above. VLSFO and HSFO prices in Singapore have fallen further relative to Brent over the past month. Whereas VLSFO hit a peak of 20-40% above crude in Q1 2020, and then traded at a 0-10% premium to crude over the past year, it is only this month that the VLSFO price has fallen to a slight discount to Brent. In the same way, relative HSFO prices have also dipped more recently.
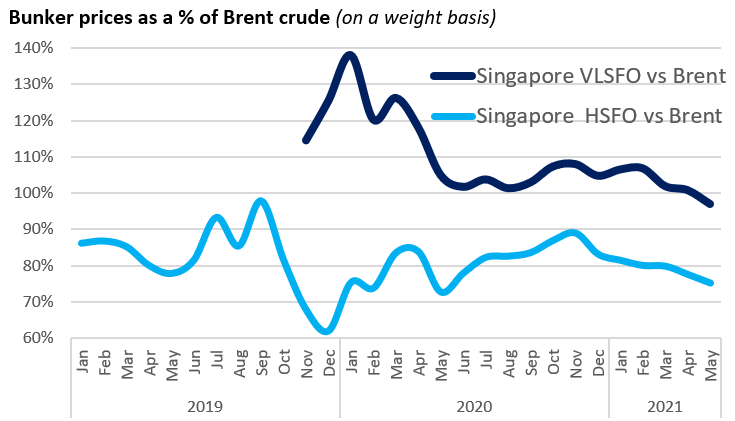
If oil demand does continue to rise, as most analysts are forecasting, then underlying bunker prices relative to the rest of the barrel, and ultimately to crude, could ease further.
Big-picture factors will determine absolute oil prices, but there are nuances and relative bunker prices could weaken further
Ultimately, the crude oil price will reflect the various market dynamics across the barrel, along with refinery issues and
developments, political and covid uncertainties, plus an input of market psychology. The ‘bigger picture’ market issues outlined in the mid-April report still hold true, plus a few others to consider:
- The demand rebound across all products, including air passenger flights;
- Oil supply developments and the OPEC+ strategy;
- COVID developments, and in particular what is happening in India;
- Progress or not in the Iran/US talks on a nuclear deal and the lifting of sanctions;
- Refinery margins and output;
- Outcomes from the recent Chinese tax hike.
So, a lot of the relative price readjustment for bunkers may have already been accomplished in the past month, but given the demand dynamics already outlined in this report, bunker prices could still continue to weaken relative to jet, other products and crude over the next 12 months.
Steve Christy
E: steve.christy@integr8fuels.com
Minimising density discrepancy to achieve bunker savings
May 10, 2021
Brent crude oil prices are now back to the low $60s and where they were at the end of 2019, before the pandemic hit. Read More
With the rise in bunker prices, shipowners are increasingly focusing on achieving savings when buying fuel, particularly in the shipping sectors where earnings have not shown similar growth. This time we look into the importance of minimising the discrepancy between the BDN (bunker delivery note) and the tested density, also called density short lift, as well as highlight the best and the worst performing ports and discuss the options the shipowners have to manage this risk.
Higher bunker prices push to focus on savings
Bunker prices have been on the rise following the increases in Brent. This happens as oil demand continues to recover, despite the surge in the covid-19 cases in several countries.
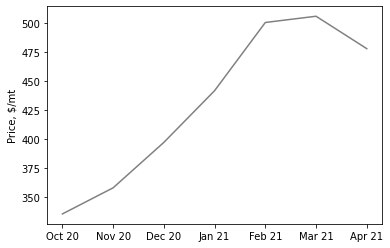
Figure 1: Average VLSFO monthly delivered price in Singapore (source: Integr8 Fuels)
As seen on Figure 1, the average VLSFO price in Singapore increased by over 40%, from around $335/mt in October to $480/mt in March, with a small correction in April, although recently Brent achieved a new multi-year high of around $70/bbl. The same pattern is seen around the ports globally.
As demand continues to recover, oil prices are likely to carry on going up, particularly as it is believed supply may not be able to react quickly to the changes in demand.
Goldman Sachs in its recent oil price forecast expect Brent to reach $80/bbl over the next six-month period, which will in turn continue pushing bunker prices higher with shipowners increasingly looking to make fuel bill savings.
In the previous articles we covered a number of ways to achieve such savings, from being flexible on the bunkering port and going beyond the main hubs to buying on calorific value and ensuring a longer lead time to avoid the prompt premiums. Another way to save money is to minimise the discrepancy between the BDN and the tested density.
Density short lift control as a way to reduce bunker bill
As bunker fuel is most often sold by metric tons, it is not only important to have the correct measurements of the volume and temperature taken before and after the transfer of the bunker fuel, but also to have the accurate density stated in the BDN as this directly impacts the metric tons bought and paid for.
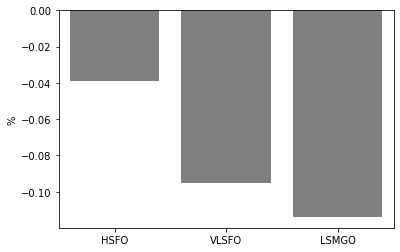
Figure 2: Average difference between BDN and tested density in Jan-Apr 2021 (Source: Integr8 Fuels)
On average, as seen from Figure 2, the discrepancy between the BDN and the tested density is close to zero meaning that for a truly globally trading (or rather bunkering) fleet not much savings can be achieved here. The reality however is that a large share of the global fleet operates between or within a particular region and depending on the trade, the fleet could be exposed to buying in a limited number of ports with significant density short lifts.
Having analysed over 30,000 fuel quality tests as well as BDNs of over 4,000 stems covering the first four months of 2021, three Brazilian ports came at the top of the list, meaning that on average when buying bunkers in these ports the tested density of the fuel is higher than the density stated in the BDN, meaning a gain for the shipowner (Figure 3).
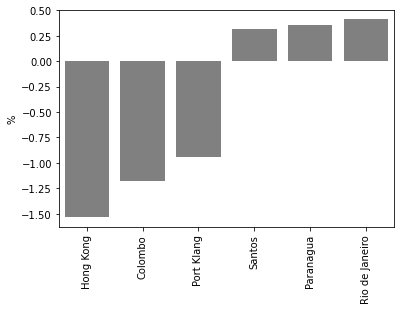
Figure 3: Top 3 and bottom 3 ports by density short lift in Jan-Apr 2021 (Source: Integr8 Fuels)
On the opposite, there was on average an over 1% density loss on the fuel bunkered in Hong Kong, Colombo, and Port Klang. In comparison, the average density discrepancy in Singapore is around 0% due to the use of mass flow meters. The fast-growing bunkering hub of Zhoushan has an average density discrepancy of -0.28%.
The scale of the gains and losses can be estimated through the examples shown in Figure 4.

Figure 4: Examples of density discrepancy gains and losses
In Rio de Janeiro, buying 750 mt of VLSFO at the current price would on average have resulted in an over $1,500 gain for the shipowner. While this is a somewhat extreme case, shipowners will still benefit from buying bunkers from all the other ports with positive density gains; examples would be Tenerife, Kingston, Santos, Barcelona, Lisbon, and others.
In Hong Kong a 750 mt VLSFO stem would on average result in an over $6,000 loss for the owner and this multiplied by the number of stems and vessels bunkered per year can add up substantially.
There are a number of reasons why some ports may have larger density discrepancies than others. It is often the case that a generic density is used in the BDNs across bunker deliveries, while the individual batches’ density may vary. It may also be down to lab testing or in some cases such discrepancies are simply the result of buying from the less reliable suppliers.
This is not to say that shipowners should avoid certain ports or suppliers, but to make the necessary adjustments to the quoted price with the density short lift in mind. When buying bunkers, it is often a dollar or two per mt that tips the scale in favour of a certain supplier or trader, and these could easily be “hidden” in the fuel’s density.
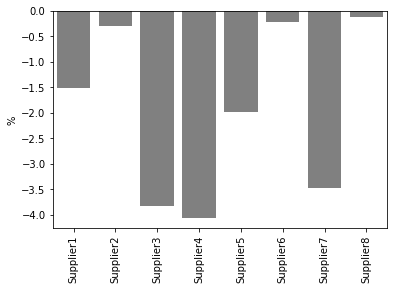
Figure 5: Suppliers in Hong Kong by average density short lift Jan-Apr 2021 (Source: Integr8 Fuels)
Even in Hong Kong, a port with a high average density short lift, shipowners should consider looking at the individual suppliers before fixing. Figure 5 shows that supplier 2, 6 and 8 are actually within the global average when it comes to the density short lift, however others may result in losses if such a difference is not reflected in the quoted price.
While it is not easy to avoid density short lift loss, there are some steps that shipowners can take to minimise it.
One way is for the shipowners to collect, structure and analyse the BDN and quality test data for their own fleet. This data could be consulted prior to enquiring or fixing a stem to see if there have been any recent cases of density discrepancy and if so, how these may affect the quoted price. Besides using the data, building trust and relationships with suppliers have been and will continue to be key.
Lastly, minimising density short lift is one out of the many solutions shipowners could use to achieve the bunker bill savings. Ideally, a combination of them should be used however this requires handing a vast amount of data and conducting continuous research and analysis, which could both be done in house or outsourced to an intermediary. Whatever the approach is, with the increasing bunker prices the desire to achieve savings will only grow stronger.
Anton Shamray, Senior Research Analyst, +44 207 4675 856
E: anton.s@integr8fuels.com
Bunker prices are back to their pre-pandemic levels; What should we look out for in the next 12 months?
April 14, 2021
Brent crude oil prices are now back to the low $60s and where they were at the end of 2019, before the pandemic hit. Read More
Brent crude oil prices are now back to the low $60s and where they were at the end of 2019, before the pandemic hit.
Although VLSFO price quotes are not quite back to earlier levels, part of this will be because of the market assessments and initial introduction of the VLSFO grade at end 2019/early 2020; in general terms we are back where we started.
After prices more-or-less halved in the first 3 months of 2020, the huge shifts in global oil supply & demand over the past 9-12 months have led prices back up.
Major cutbacks in crude oil production from the OPEC+ group, plus production losses because of low prices, principally in the US, have pushed prices higher. At the same time, oil demand has increased since the Q2 2020 low, although this has generally been slower than most people expected, with second and potential third waves of the virus. Nonetheless, demand is rising and the introduction of vaccination programs is supporting higher demand and higher prices.
This prompts the question: after the most turbulent 12 months in recent history, what should we be looking at for bunker price direction in the coming 12 months?
Bunker Demand & prices compared with the rest of the oil market
As always, the answers lie outside our markets. In fact, the bunker market has been one of the least affected sectors in terms of the demand impact from the pandemic. However, price falls for bunkers have been similar to crude oil, gasoline and diesel/gasoil, where the loss of demand has been far greater; we are not an ‘isolated’ market and it is what is happening in the other areas of the oil industry that almost entirely determine the absolute price we pay for bunkers.
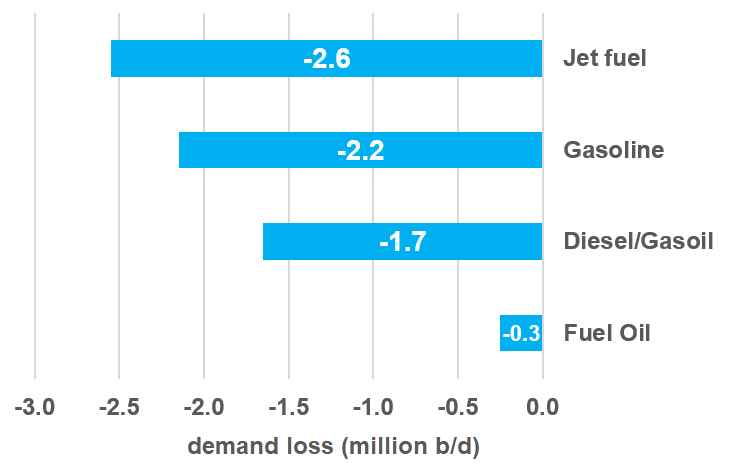
Putting this in context, jet fuel has taken by far the biggest hit in demand because of the pandemic. Demand for jet in the main markets of the US, Europe and Asia was down by 2.6 million b/d (42%) in 2020. In contrast, fuel oil demand in the same area dropped by only 0.3 million b/d (7%). The volume demand impact on gasoline and diesel/gasoil lay somewhere between these two extremes.
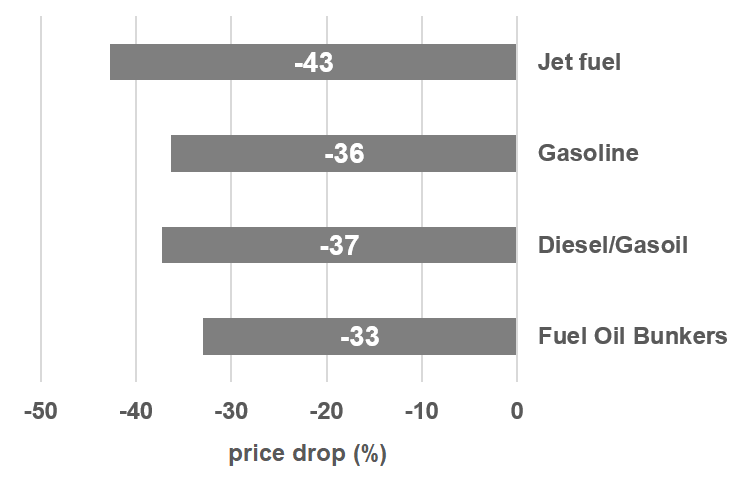
However, these relative shifts in demand are ‘lost’ when it comes to price movements. Jet prices did fall by slightly more than other products, but price falls in the gasoline, diesel/gasoil and bunker markets were all very similar, at around 33-37% lower in 2020 than in 2019.
The inter-relationship between product prices and what happens within the refinery means prices in the bunker market are always going to reflect what is happening across the entire oil barrel.
It is worth noting that these ‘big issues’ will always be the main driver for the underlying price of bunkers, but there is also a ‘fine tuning’, with changes in the relative price of products. In fact, going forward the relative price of VLSFO could rise as gasoline demand picks up, with VGO shifted away from bunker blending to what was its typical use as a feedstock to produce gasoline.
What is happening to world oil supply?
On the oil supply side, indications are that crude production will increase, at least through to July. This follows the recent OPEC+ decision at its April 1st meeting to allow a staged increase of 1.1 million b/d from the quota allocations. In addition, Saudi Arabia is easing its additional voluntary cutback of 1 million b/d over the same period. Therefore, an additional 2.1 million b/d crude production is likely within the next 3 months.
The OPEC+ group is on a planned easing of their production cutbacks. However, some industry participants were slightly surprised by the decision, given that oil prices had already eased back by $5/bbl in the 4 weeks leading up to the meeting, and that there were further concerns surrounding the demand rebound, especially with another wave of lockdowns and a slower than anticipated vaccine uptake in Europe.
There is also another potentially bearish price indication on the supply side, with the possible return of the US to the Iranian nuclear deal. This is not immediate, with preliminary, indirect talks only starting earlier this month. However, further negotiations are planned and any indication of an agreement and easing of sanctions will have a bearish sentiment on prices, with the prospects of at least another 1 million b/d of Iranian crude entering the market.
There is also a risk that this goes beyond just these incremental Iranian supplies, or that these are heavy, higher sulphur crudes, with possible political ramifications involving Saudi Arabia’s oil policies.
From the crude supply side, it does look like more volumes are coming and this could put downwards pressure on prices generally. The focus for us will be on any further OPEC+ decisions and importantly, the triangular politics between the US, Iran and Saudi Arabia and what this may mean for Iranian and Saudi crude exports.
Where is the growth in world oil demand coming from?
If supply is likely to increase, then it is down to a more positive outcome on the demand side to counter this if prices are to rise. In the past month this hasn’t really been the case and Brent crude has fallen from a (strong) peak of $70/bbl in early March to $63/bbl more recently. The same kind of drop has taken place in the bunker market, with VLSFO in Singapore down by $40/ton in the past 5 weeks.
The prospects for further gains in oil demand are very much focused on a region-by-region approach. China and the US appear to be the ‘stand-out’ areas for increases in oil demand, where-as in Europe the concerns about the current surge in infections and more lockdowns make any strong demand gains here more unlikely.
In the US, the mass role out of vaccination programs, coupled with the announced $1.9 trillion fiscal stimulus policy is expected to get oil demand rising steeply. The net result is that the 2.4 million b/d loss in US oil demand in 2020 is expected to be more-or-less made up by end 2022 (+1.4 million b/d this year and another 0.9 million b/d gain in 2022). In China the market indications are even stronger, with the 0.4 million b/d demand loss last year already more than covered and the country well into ‘growth mode’.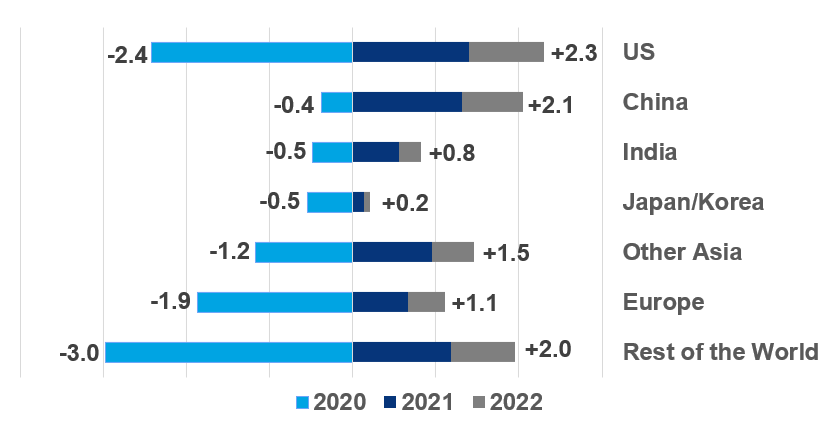
The rest of Asia (excluding Japan and Korea) is also projected to increase its demand for oil well above the 2019 levels, although current higher infection rates in parts of India could mean a slight risk in the near term. Elsewhere, demand prospects in Japan/Korea and Europe look as though they will remain very constrained and well below pre-pandemic levels.
In terms of individual products, gasoline and diesel/gasoil demand on a global level is expected to return to 2019 levels next year. It is the global jet market that is still taking the brunt of the demand loss and is not expected to fully rebound until 2023/24.
As outlined above, any loss of demand in our market has been limited and consequently there is no ‘rebound’ to take place. Total demand for bunkers is seen as relatively stable, but with the much stronger prospects in Asian economies, demand and trade, bunker demand east of Suez is likely to grow far more than west.
Can demand increases in China & the US exceed production increases in OPEC+ (and Iran)?
Bringing these fundamentals together highlights the market uncertainties we are facing. At a high level there will be a strong focus on demand prospects in the US and China countering the anticipated increases in crude production. Within these very broad parameters, how quickly (or not) the aviation industry can get flying and the US stance to the Iranian nuclear position will also have a huge bearing on price direction.
The forward curve is never a good forecast of where things are going, but it does represent a measure of sentiment at a given time and currently there is a slight bearish tinge to the curves. Even price forecasters have adopted a very cautious approach, with a number showing flat to slightly declining prices over the next 12 months.
With a number of extremely influential factors still to be determined, the key known issues to watch for are: the US economy/demand, China, OPEC+ and the ‘curved ball’ of Iranian sanctions being lifted and any potential political fallout from this, if it happens.
The current forward curve shows a gentle decline in prices over the next 12 months; looking at the factors outlined in this note, it doesn’t look like a ‘gentle’ period of pricing ahead of us.
Steve Christy
E: steve.christy@integr8fuels.com