News August 20, 2020
To see where bunker prices are going, we have to look at the bigger oil picture
Bunkers are a relatively small part of the overall oil market, accounting for just over 6%. It is what is happening elsewhere in the industry that sets the underlying price in our market, but of course with a number of factors that determine if VLFSO, HSFO or MGO prices are relatively strong or relatively weak in comparison with crude oil and other product prices.
This report is an update of our end June look at the oil industry fundamental outlook and the drivers behind prices in the bunker market. To summarise, the collapse in oil demand has been huge, but not as big as first thought. However, expectations now are the Covid-19 impact will last longer than originally forecast. Back in April, when the realization of what was happening became apparent, the drop in total oil demand in the second quarter was expected to be just over 23 million b/d, now that estimate is close to 16 million b/d (still incredibly big though). Demand is forecast to continue to rise, but figures for next year are still below the 2019 levels; it is not until 2022 that total oil demand is expected to get back to the 2019 levels.
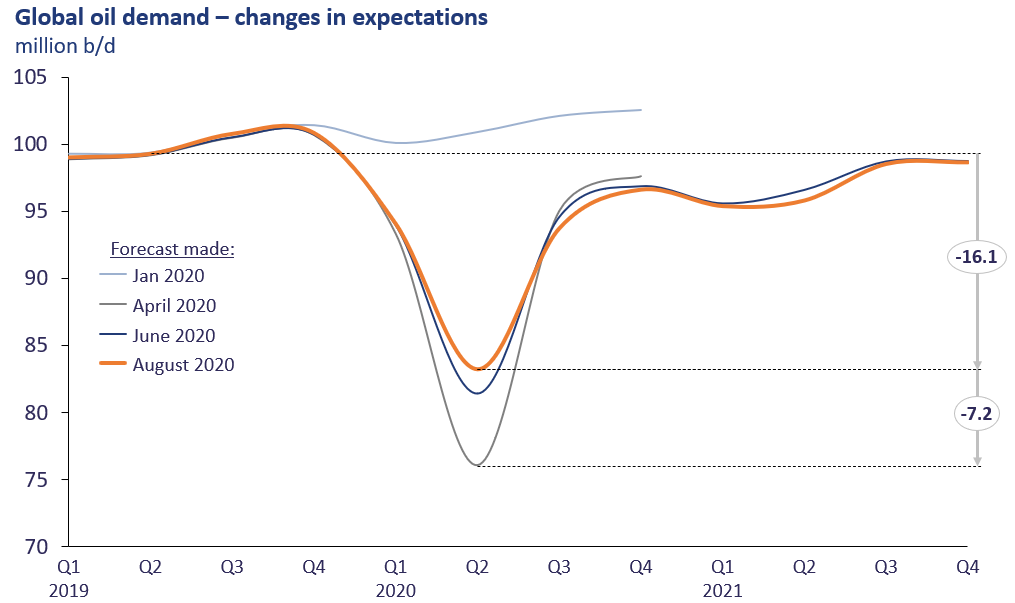
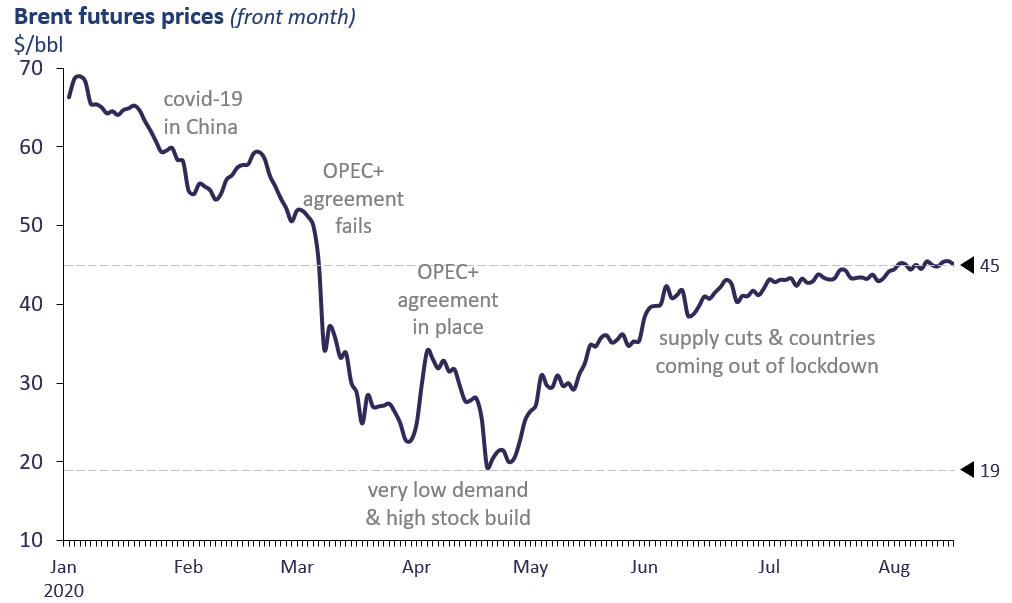
This suggests that demand is rising but is going to take more than 18 months to ‘recover’. Also, we have already seen a number of setbacks, with local and regional lockdowns being introduced. On this basis we can expect demand contributions towards higher prices, but not on a straight-line basis. We have already seen this over the past 7 weeks as crude oil prices have only edged higher in a relatively narrow range of $43-45/bbl for Brent front month futures. This is shown in the graph below, following the collapse in Brent prices from $70/bbl at the start of the year to a low of $20/bbl at the end of April.
The shape of price developments in the bunker sector has followed a similar pattern, a collapse from January through to late April and a gradual rebound since then, but with prices still well below those at the start of the year.
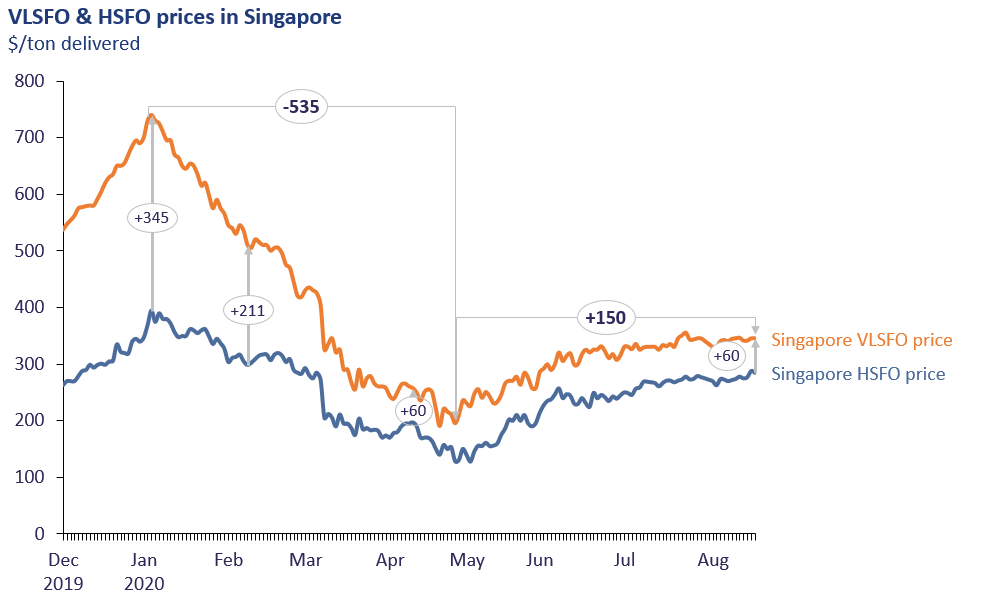
The graph above also illustrates the narrow position of the VLSFO/HSFO differential over the past 4 months, partly a reflection of ‘smaller differentials a lower prices’, but also a reflection of more specific developments in the oil markets. VLSFO is currently relatively weak within the price structure because it is typically a blended product and component prices are weak from the ‘hit’ in distillate/gasoline demand. Conversely, HSFO prices are relatively strong because demand has been less affected in this market than others and also the OPEC+ crude production cuts have largely centred on more heavy, higher sulphur crudes, so constraining the supply of HSFO.
It is the balance between total oil supply and total oil demand that will determine how overall prices respond going forward. If the analysts are correct, and we gradually move to higher demand over the next 18 months, then the question is: what happens to supply at the same time? This means a key focus on the OPEC+ agreement and how this is working, and more specifically the positions of Saudi Arabia and Russia within the agreement.
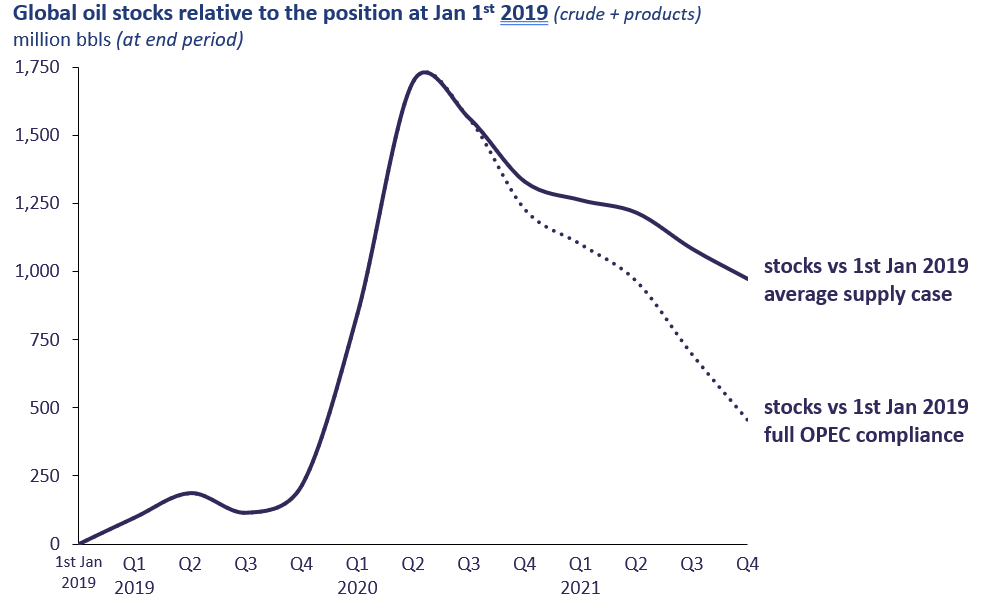
The market has seen a massive drop in demand over the first half of this year and a position where supply was much higher than demand, i.e. a period of huge stock build. The general outlook for the next 18 months is an increase in demand to levels just above supply, i.e. a gradual stock draw. Forecasts tend to show OPEC+ producers moving above quotas during next year, but If OPEC can maintain full compliance to the existing agreement, then the stock draw would be greater and so prices likely to be higher.
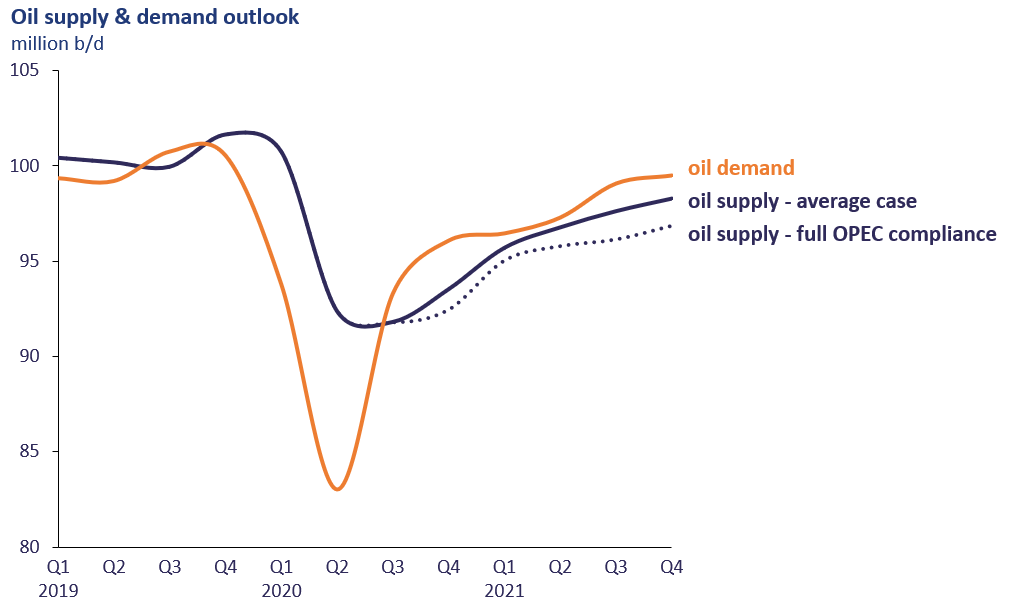
The final graph illustrates how global oil stock levels could react after the massive build we have seen during the first half of this year, where by June 2020 stocks were around 1.7 billion bbls higher than at 1st January 2019. Given the two supply scenarios, stock levels at the end of next year could be around 1 billion bbls above 1st Jan 2019 based on an OPEC ‘over-production’, or just 0.5 billion bbls higher if OPEC stick to the agreement.
Current forward curves for crude oil prices show a very flat profile for next year, rising by only $3.50/bbl by end 2021 for Brent. The curve for VLSFO is slightly steeper than for crude, at $42/ton higher at end 2021, which is also a reflection of a shift away from the current relative weakness in VLSFO pricing.
The implications from the graph above are not a return to prices at the start of this year, but a rise in prices and the extent dependent on how OPEC responds and how quickly demand can recover. Analysts’ expectations for oil demand plus full OPEC compliance suggests a higher price than the current forward curve. Within this, bunker prices will follow suit, along with more subtleties surrounding the VLSFO/HSFO price differential. We will continue to analyse and report on these industry fundamentals.
Steve Christy Strategic Communications Director P: +44 207 467 5860
E: SteveChristy@navig8group.com
Posted by
Elaina Cameron
Latest articles


Contact our Experts
With 50+ traders in 12 offices around the world, our team is available 24/7 to support you in your energy procurement needs.