
Bunker Prices Poised to Drop — But Watch for the Curveballs!
February 27, 2025
View this article as a PDF » Prices are down: Is Trump close to ending the Ukraine war? Uncertainty, uncertainty, uncertainty is running through the oil markets. The biggest news stories surround Trump and Putin getting closer and a potential negotiated end to the war in… Read More
Prices are down: Is Trump close to ending the Ukraine war?
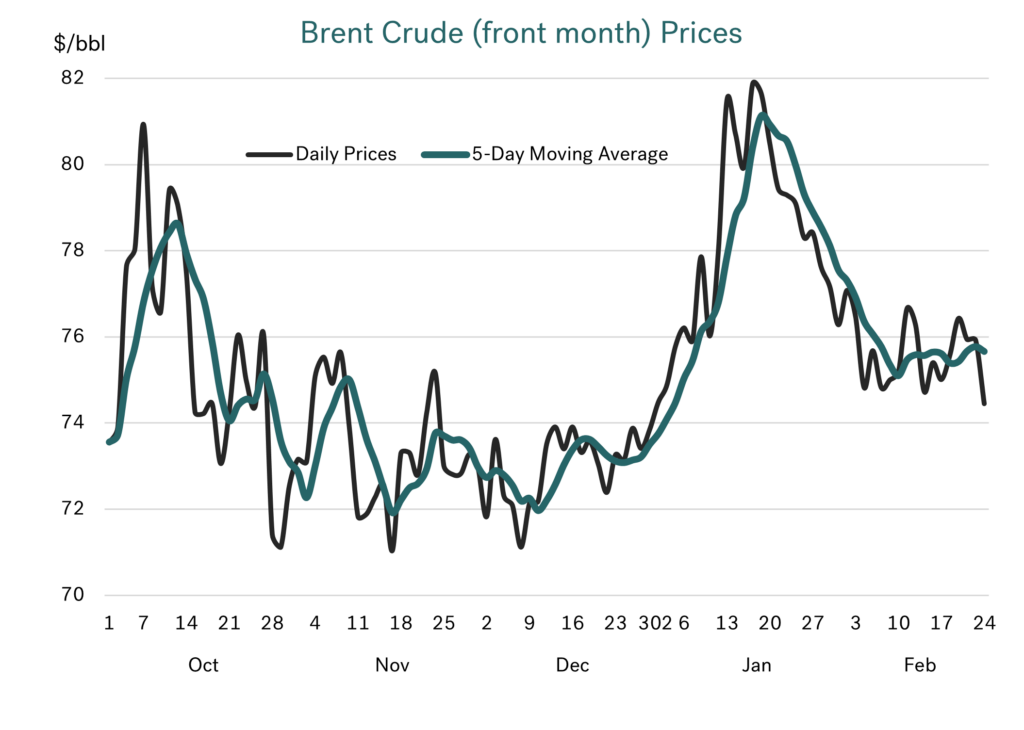
Uncertainty, uncertainty, uncertainty is running through the oil markets. The biggest news stories surround Trump and Putin getting closer and a potential negotiated end to the war in Ukraine. Who is involved in the negotiations, what might be ceded and how Ukraine comes out in all this is not yet precise. But when you look at crude prices, it shows the market has taken a general view that the situation has eased a lot since Biden’s 10th January, last gasp imposition of sanctions on Russia.
 Source: Integr8 Fuels
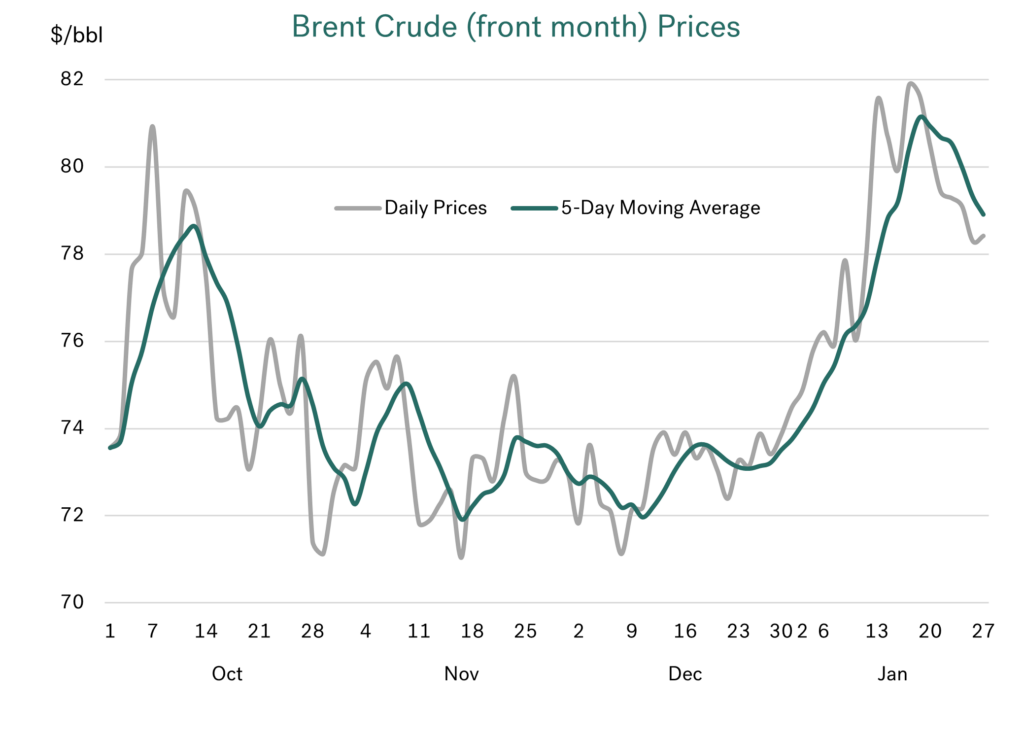
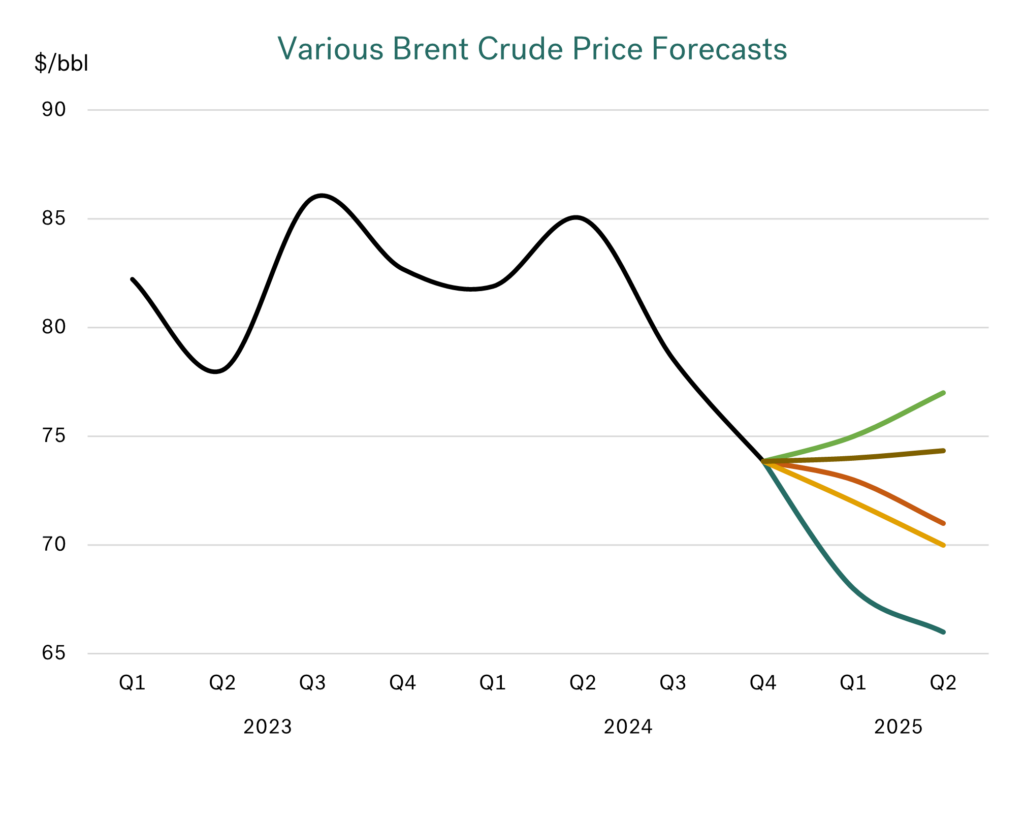
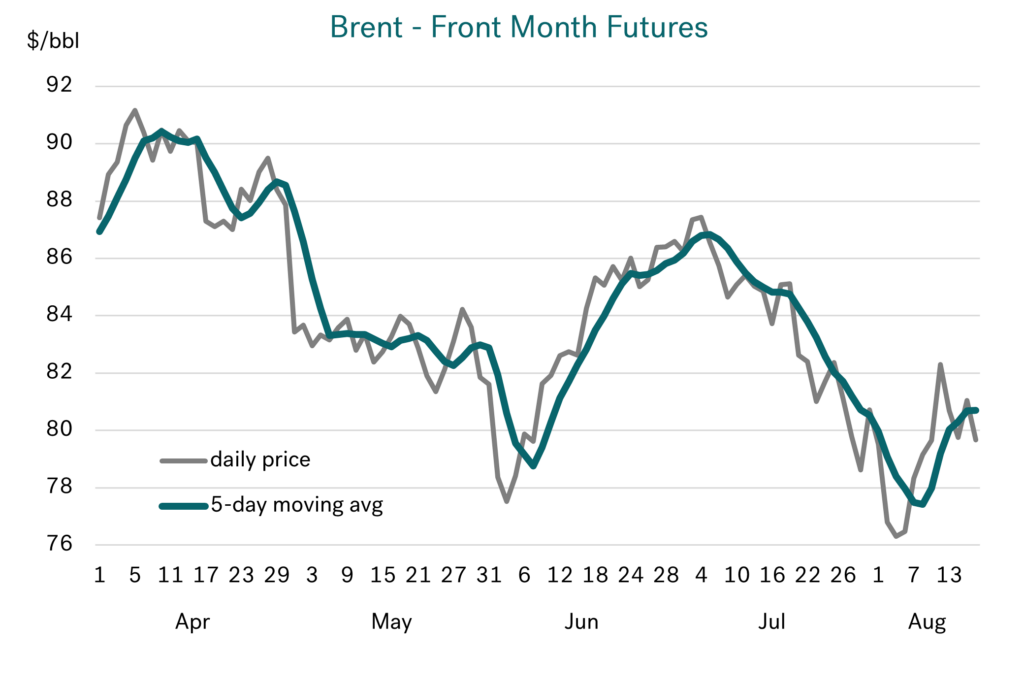
Front month Brent had fallen back by $6/bbl from its recent peak, and has seen another sharp drop this week. The market is certainly taking pointers towards a settlement in the Russia/Ukraine war.
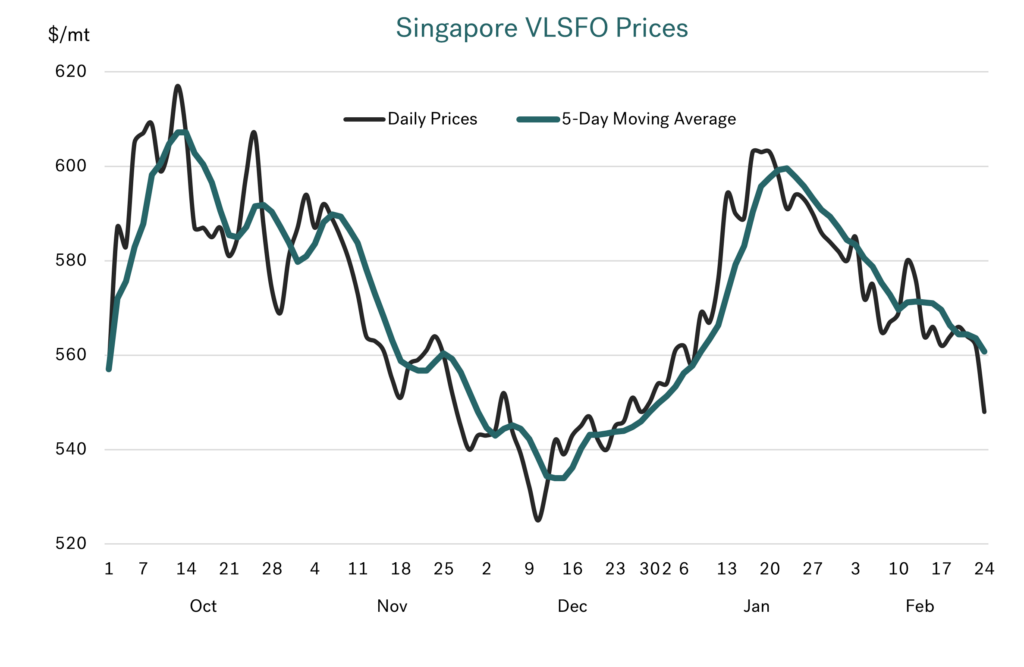
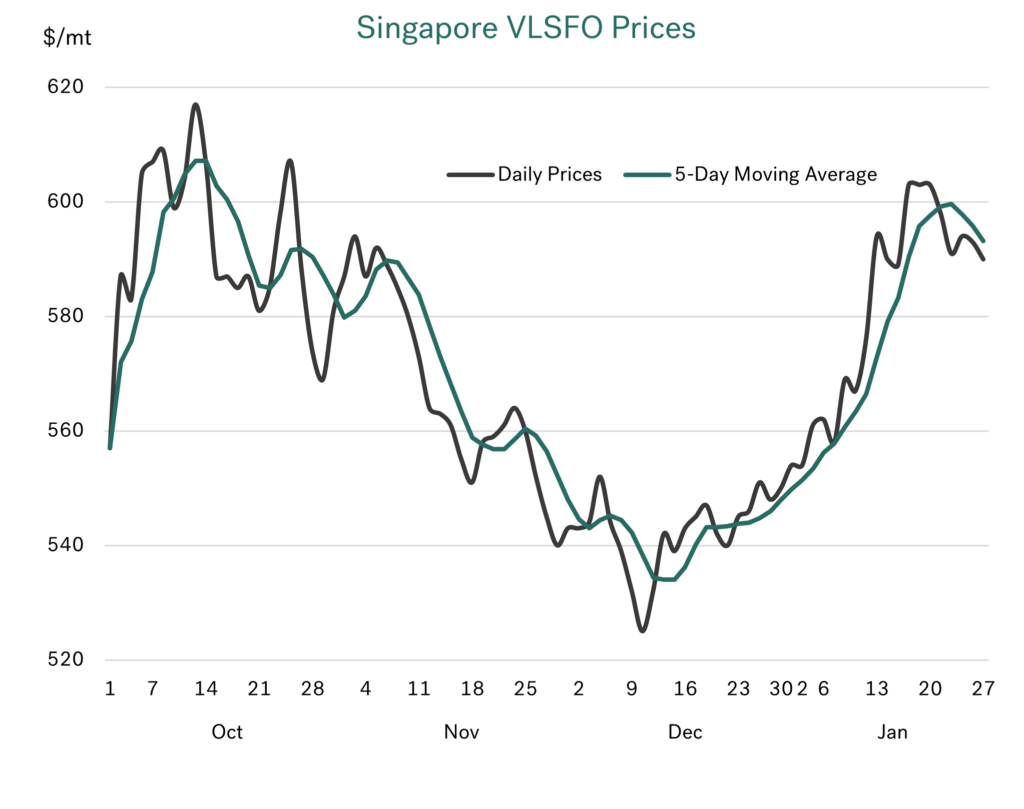
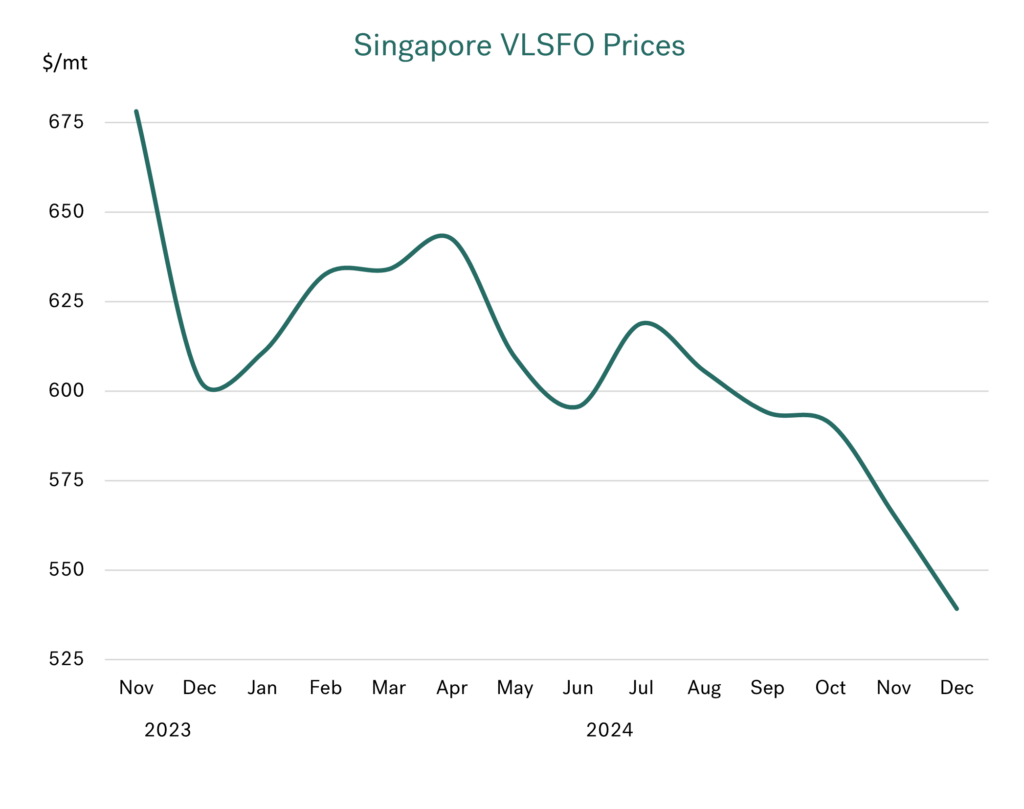
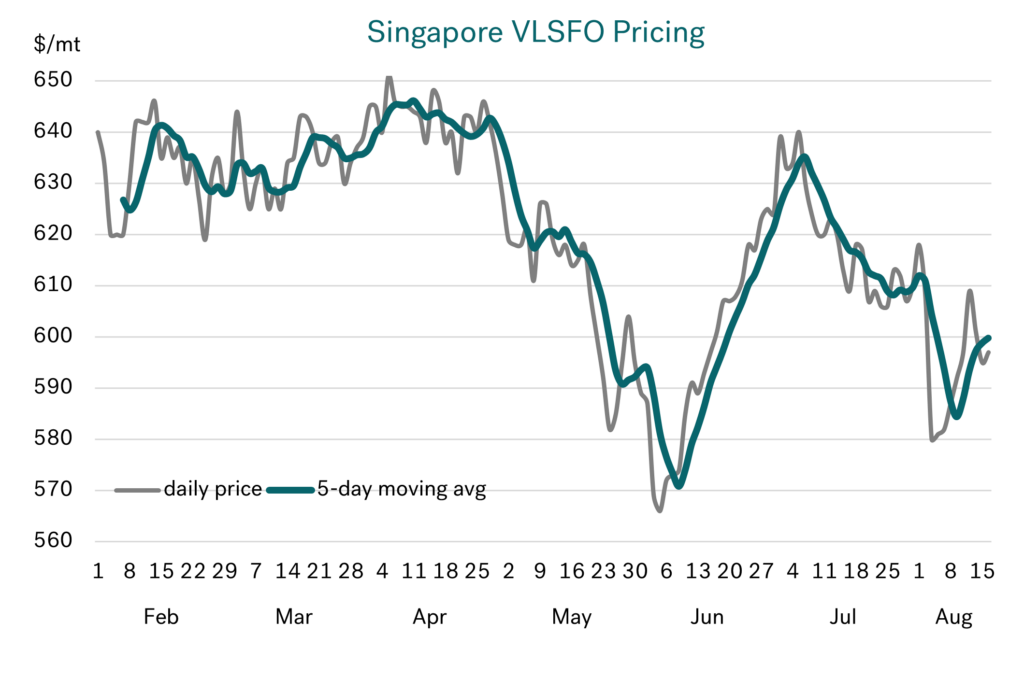
VLSFO prices have fallen alongside crude, with Singapore prices down from $600/mt to below $550/mt, including a significant fall at the start of this week. The drop in Rotterdam VLSFO prices has not been as great, with some strength in European middle distillate refinery margins and lower diesel trade from the US to Europe. Nonetheless, VLSFO prices are still lower than a month ago, although not yet back down to their December levels.
 Source: Integr8 Fuels
It must be intriguing being a political analyst
Even experts in the political world have been surprised by some of the recent rhetoric, and how political relationships have changed. We have no special insight into how the Russia, Ukraine, US, European affiliations may pan out, which may become more clear as a number of European leaders meet with Trump. However, at this stage it is worth us using our expertise in the oil markets to look at what could happen if the Ukraine war does come to an end and Russia is somehow brought back into the international (or at least the US) fold.
Has the door just shut on OPEC+
In our report a month ago we mentioned that a tightening of sanctions on Russia could further constrain Russian oil exports and finally open a door for OPEC+ to start unwinding their 1.7 million b/d of voluntary production cutbacks. At their early February meeting, the OPEC+ Joint Ministerial Monitoring Committee (JMMC) reiterated their previous plan to start unwinding cutbacks from April. However, the renewed Trump/Putin dialogue and moves towards ending the Ukraine war seem to have removed any ‘easy’ option for OPEC+ to bring back this production into the international market anytime soon.
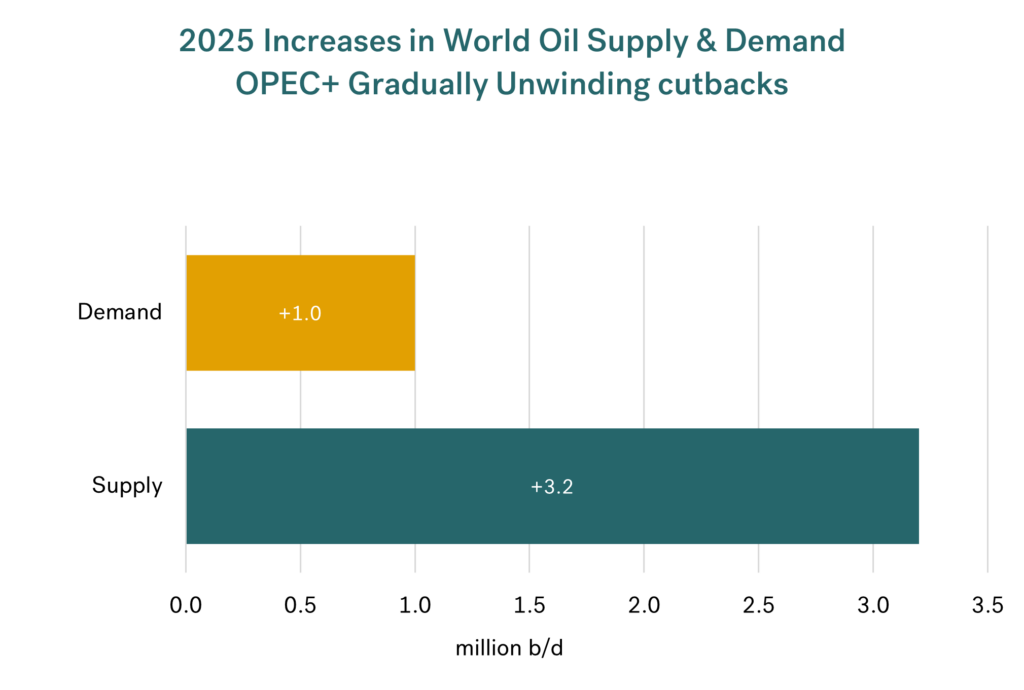
The world looks like it has more than enough oil, even without ‘extra’ OPEC+ volumes
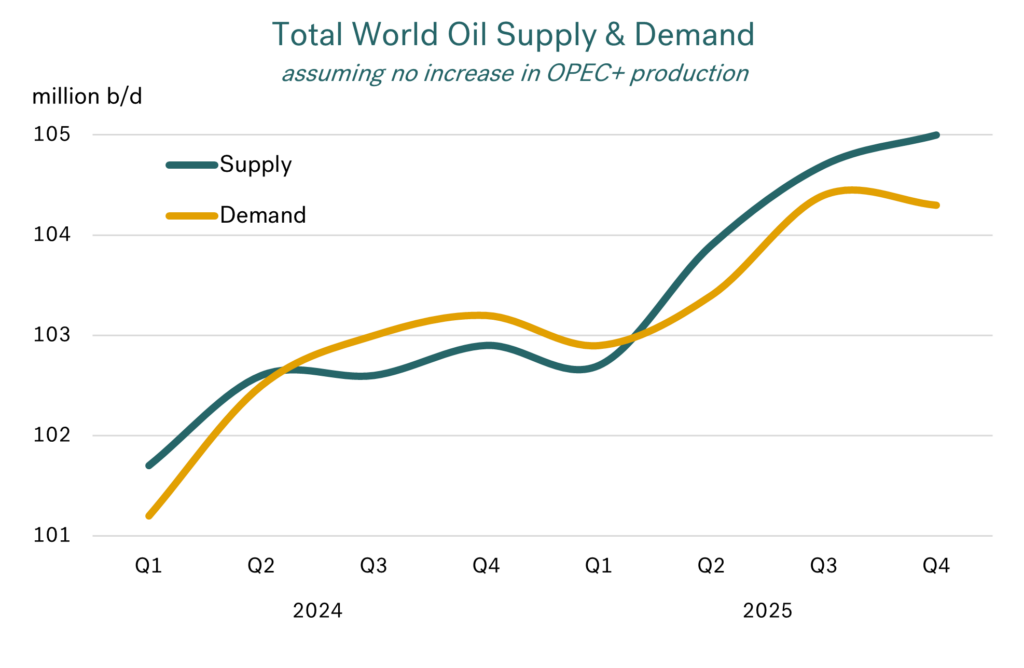
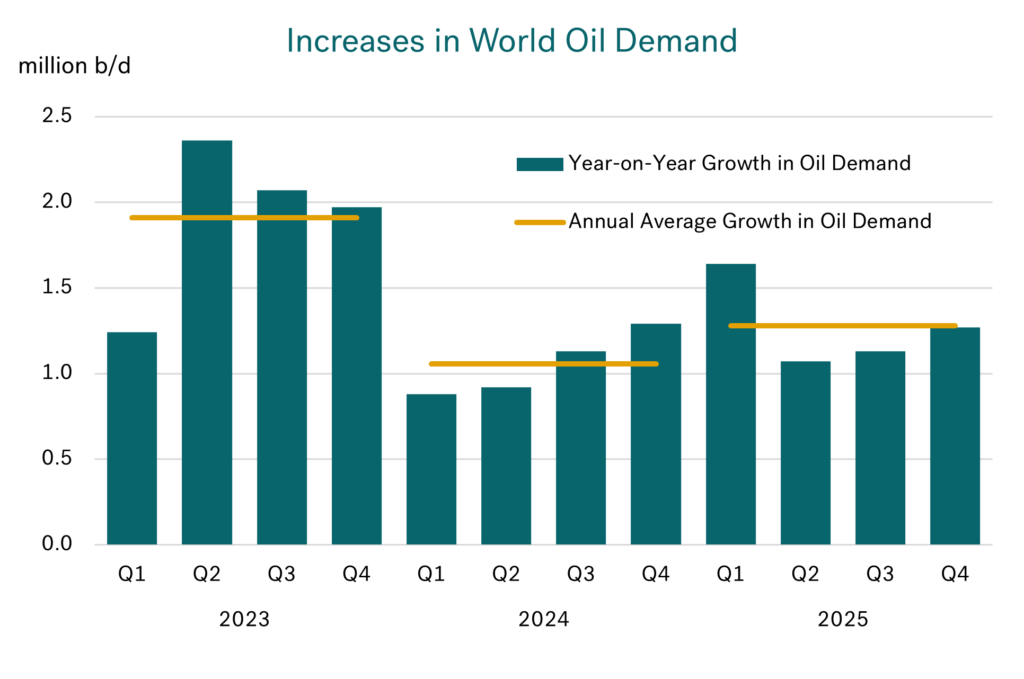
Looking at analysts’ views of the oil market for this year, the general expectation is that even if OPEC+ maintain their voluntary cutbacks until the end of the year, there is still ‘too much oil’. The chart below illustrates total world oil supply and demand for 2024 and the outlook for 2025. This shows markets shifting from demand higher than supply between the third quarter 2024 and the first quarter this year, to supply exceeding demand from the second quarter 2025 onwards; and this is based on OPEC+ maintaining their cutbacks for the entire year!
 Source: Integr8 Fuels
The expectation now is that although the increase in demand this year will be slightly bigger than in 2024, the gain will still be relatively modest, at around 1.2-1.3 million b/d. At the same time, production increase in the US, Brazil, Guyana, and Norway, along with minor gains elsewhere (and declines in some countries), means global oil supply is forecast to rise by around 1.6 million b/d, even without ‘extra’ OPEC+ oil.
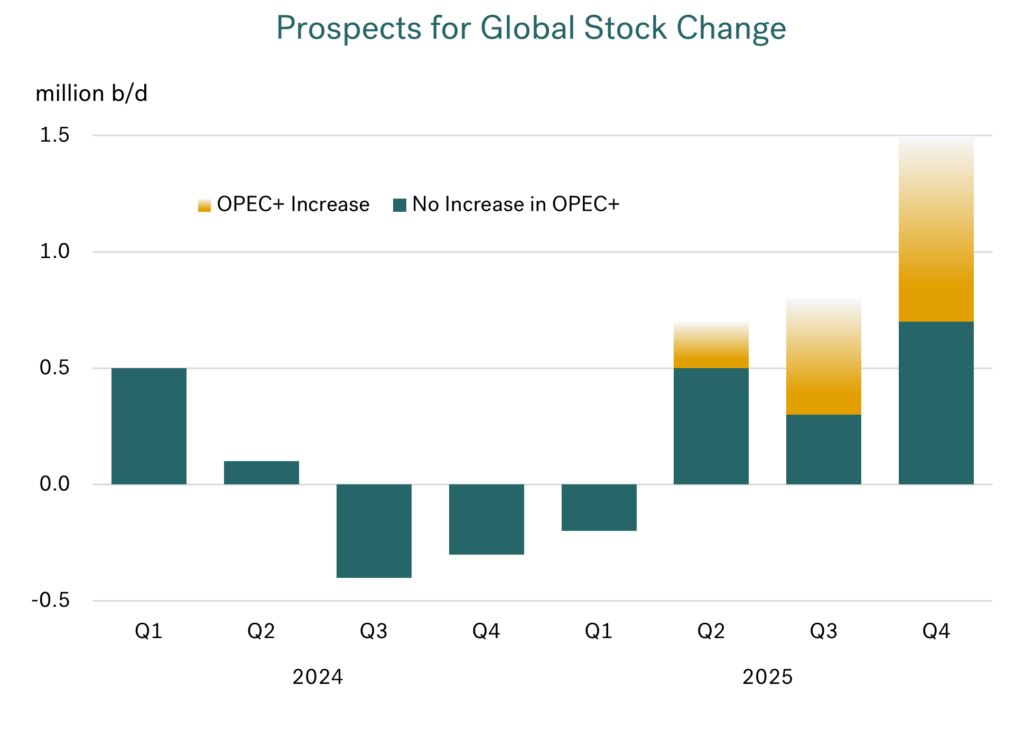
Taking the analysts’ work, it looks like we are moving from a global stock-draw in the first quarter 2025, to a phase of global stock-builds over the rest of the year. The underlying position is for potential gains of around 0.3-0.5 million b/d over the second and third quarters of this year, rising to about 0.7 million b/d in the fourth quarter (even assuming OPEC+ maintain their cutbacks).
 Source: Integr8 Fuels
If OPEC+ stick by their commitment to start ramping up production in April, then these stock-builds will be even bigger, at around 0.7-0.8 million b/d through Q2 and Q3, rising to well above 1 million b/d in Q4.
The signs are there for bunker prices to fall
If we were in a purely fundamental market (which we are not), this would imply oil and bunker prices falling this year, with the price declines even greater if OPEC+ unwind their cutbacks.
But we know we are also in a market which is highly driven by politics and psychology. Current politics are more extreme than in recent years, but if Trump can ‘pull off’ an end to the war, it will take a huge amount of ‘upside risk’ out of the market. If Russia can then trade oil more freely, it will also bring about a more settled position in the market.
This is obviously a very simplified view of what could happen, and a lot still has to be done internationally to bring an end to the war in Ukraine. But the starting position is one of a market that looks very well supplied for this year. If there is then an end to the war, and ‘normalisation’ in Russian oil trades, then we could see bearish price developments on a fundamental, a political and a psychological basis.
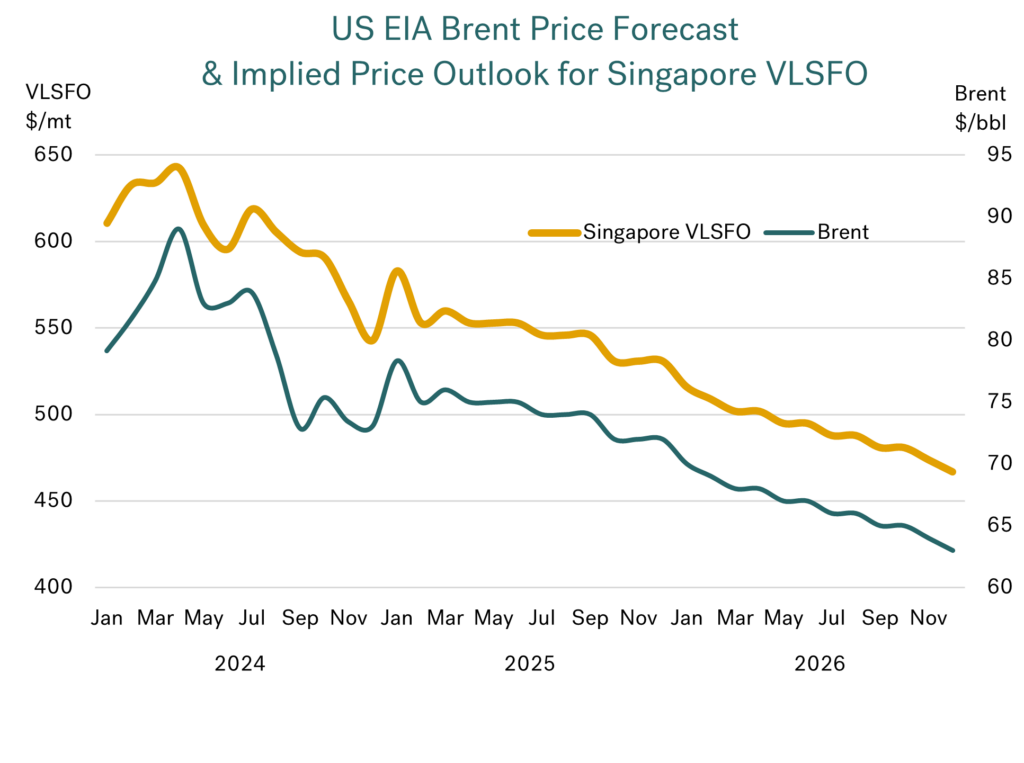
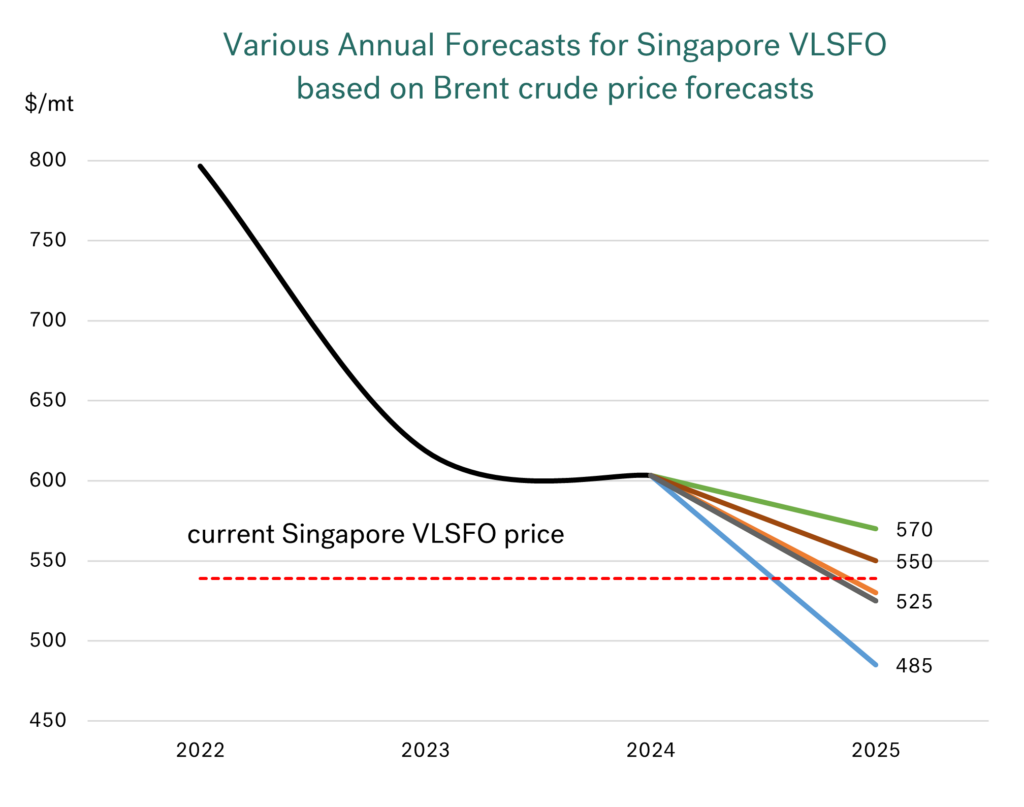
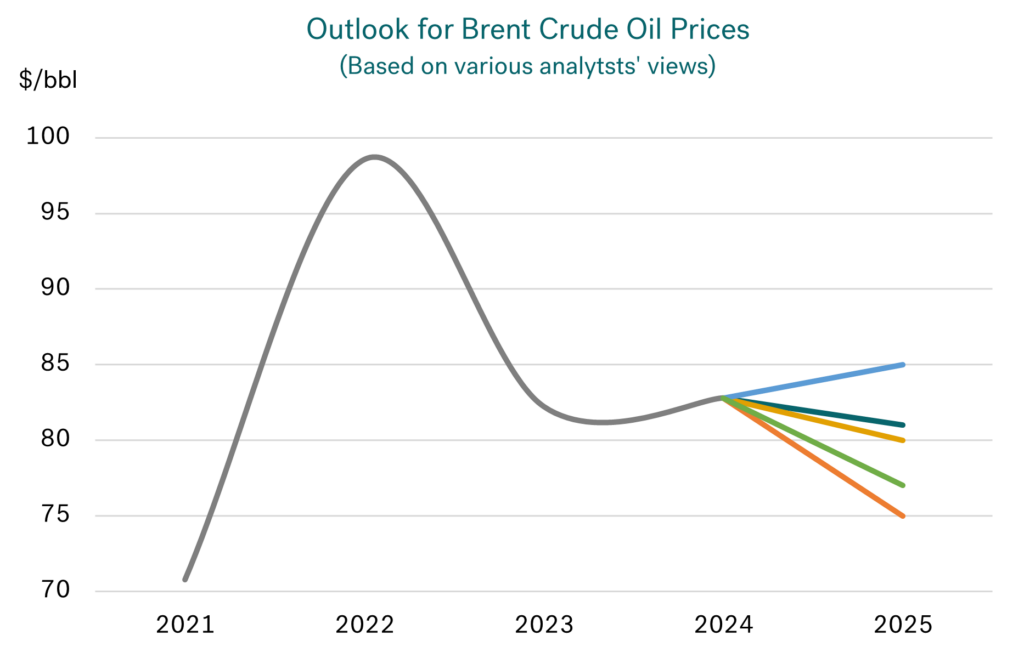
Perhaps the chart below illustrates this, showing the US EIA’s latest price forecast for Brent crude oil, and us superimposing the corresponding outlook for Singapore VLSFO. The projections go through to end 2026, with Brent prices dropping from mid $70s today, to low $70s by end year, and low $60s by end 2026. The implication for Singapore VLSFO is prices dropping from around $550/mt currently, towards $525/mt by December 2025 and $475/mt by end 2026.
 Source: Integr8 Fuels
It looks like bunker prices will fall, but watch out for the curveballs!
Looking this far ahead must be taken with caution, especially in the current political environment. We haven’t even mentioned tariffs, Israel/Gaza, or Iran. Even bearing this in mind, it is always good to have a baseline position to work from, and this analysis provides that using a fair representation of where we stand today. We just have to be agile and adapt to new circumstances (which will surely happen!), but at the moment an end to the Russian/Ukraine war seems more likely, AND, at the same time, the fundamentals look bearish. It suggests we will be paying less for bunkers going forward. Just watch out for the ‘curveballs’ that may be coming our way!
Steve Christy
Research Contributor
E: steve.christy@integr8fuels.com
Oil Prices Surge as Sanctions Shake the Market
January 29, 2025
View this article as a PDF » Biden and Trump mean we are paying more for bunkers Through most of last year, and especially in the fourth quarter, we highlighted the weak fundamentals in the oil market and the downward pressures on oil (and bunker)… Read More
Biden and Trump mean we are paying more for bunkers
Through most of last year, and especially in the fourth quarter, we highlighted the weak fundamentals in the oil market and the downward pressures on oil (and bunker) prices. Markets were at ‘obvious’ low prices through to the end of last year, and then politics kicked in, and prices surged!
Brent crude back to $80/bbl
Politics have triggered a significant hike in crude oil prices to their highest level in 5 months, with front month Brent up from the low $70s to a high close to $82/bbl. Prices have eased back after their initial hike, but they are still 7% higher than in December. Clearly politics trump any bearish fundamentals in the market; no one at the moment is talking about oil supply exceeding demand this year!
 Source: Integr8 Fuels
Biden started the ball rolling
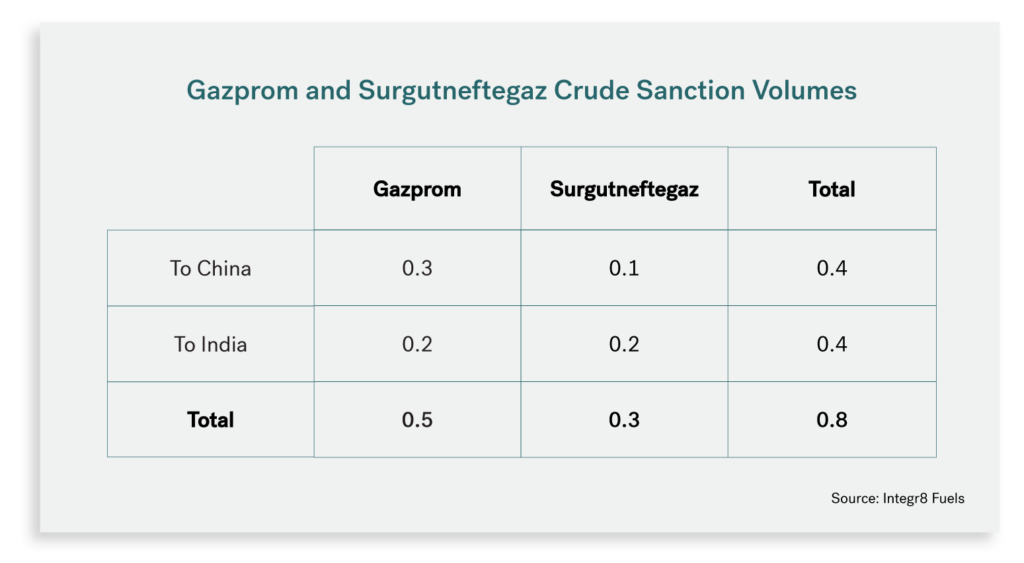
The first surprise was that right at the end of his term, on 10th January, President Biden imposed new sanctions on Russia, targeting around 160 tankers (the ‘dark/shadow fleet’), marine insurance companies and two Russian production companies, Gazprom and Surgutneftegaz. These two companies had been exporting around 0.8 million b/d of crude, mainly to China and India. Now buyers from these companies only have a grace period until February 27th to offload their cargoes before facing sanctions themselves.
The implications and uncertainty surrounding these new US sanctions has meant the Russian crude export market has now ground to a halt. The response has been for Chinese and Indian buyers to act quickly and enter the market looking for alternative supplies, including from the Middle East, West Africa, and Brazil. The net result is that China and India are now competing with each other, alongside previous buyers of these crude grades. Such an increase in competition and uncertainty about the future could only lead to one thing, a surge in oil prices.
VLSFO prices up by around 8%
Consequently, we have been hit with much higher bunker prices. Singapore VLSFO has been back up at around $590-600/mt, with Rotterdam prices around $540-550/mt, 9% and 7% higher than their December averages.
 Source: Integr8 Fuels
Oil sanctions on Russia are making us pay the price
Direct sanctions on the two Russian oil companies amount to around 0.8 million b/d of crude exports, split 50:50 between India and China.
 Source: Integr8 Fuels
This alone may seem relatively small, given Russia had been exporting a total of some 4.6 million b/d of crude and 2.7 million b/d of products. However, there are further issues that restrict export volumes, with non-compliant tankers also sanctioned, and these moved an estimated 1.6 million b/d of Russian exports last year. Also, with sanctions on marine insurance companies and issues fulfilling US dollar financial transactions, it is no surprise there has been a halt in Russian exports and a rush to secure alternative crude volumes.
Russian sanctions will open the door for OPEC+
When one door closes, another often opens. In this case the closure of Russian ‘doors’ now makes it far easier for the opening of OPEC+ ‘doors’. If we exclude Russia, OPEC+ currently has 1.7 million b/d of voluntary production cutbacks that they have been looking to unwind since last year. The re-introduction of these volumes has been pushed back to April this year because previous ‘market conditions’ were not right (i.e. oil prices were too low).
President Trump has already asked Saudi Arabia and OPEC+ to reduce oil prices, and the only mechanism they have for this is to raise production. Although lower oil prices would appear to contradict incentives for companies to “Drill Baby Drill” in the US, an increase in OPEC+ production would ultimately take the sting out of prices following sanctions on Russia. In fact, the full unwinding of OPEC+ cutbacks could offer Trump an ability to put even tighter sanctions on Russian oil exports, if he chooses.
 Source: Integr8 Fuels
An eye on a bigger prize?
There are many dichotomies in what President Trump has said so far, such as talk of putting 25% tariffs on Canada and Mexico (and China?) and wanting lower oil prices, and wanting the US to “Drill Baby Drill”. But, if it takes such a tight sanction squeeze on Russia (or even the threat of one) to start negotiating an end to the 3-year war with Ukraine, then President Trump could be a peacemaker. Then Iran next?
This unpredictable, or ‘non-traditional’ approach to politics looks like we will continue to get extremes in oil prices. Timings never match; a tightening of sanctions on one country will never coincide with an agreement to raise production in another country. However, Saudi Arabia has an estimated 3 million b/d of spare capacity, the UAE another 1 million b/d, with Kuwait and Iraq another 1 million b/d between them. If Trump works with these countries, there is potentially up to 5 million b/d of ‘replacement oil’ to work with if he imposes even tighter oil sanctions on Russia, or decides to escalate the position with Iran.
Higher bunker prices today, but where do we go from here?
There are nuances in bunker prices in different regions, and in their relationship with crude, but we are essentially ‘price-takers’ in the oil market. Biden and Trump have made their moves, and we are currently paying around 7-9% more for bunkers than in December.
At the moment we are in the ‘initial shock’ period, which has meant a reversal in all the bearish oil price dynamics we were looking at for most of 2024. However, prices have eased back a bit, and there will be ways that alleviate the initial response to these sanctions. Buyers of Russian crude will have to use unsanctioned tankers and also prove the purchase price of Russian crude is less than the $60/bbl imposed cap; but it can be done (at the moment).
In the bigger picture, President Trump says he wants to end the war between Russia and Ukraine, following the Israel-Hamas ceasefire agreed on January 15th. We are not political commentators, nor forecasters of where the Nobel peace prize may go, but Biden has disrupted Russian oil exports and President Trump will continue disrupting global politics and markets throughout his term.
In the short-term, politics have pushed bunker prices higher, and obviously even tighter ‘Trump sanctions’ on Russia could see another leap in prices. But if there is a negotiated peace in the Russia/Ukraine war, or one looks highly likely, then we could see oil prices tumbling and the Nobel peace prize making its way to the US.
Steve Christy
Research Contributor
E: steve.christy@integr8fuels.com
Bunker Quality Trends Report Jan 2025
January 14, 2025
Integr8 Fuels’ fifth edition of the bi-annual report analyses data from 130 million metric tons of supply, to reveal key trends relating to fuel quality and availability. Read More

This January 2025 edition of Integr8’s Bunker Quality Trends report is an essential resource for shipowners, charterers, and operators seeking to make informed decisions in an increasingly complex regulatory and market environment.
Leveraging data from over 130 million metric tons (MT) of global bunker fuel deliveries, the report highlights the most critical issues and actionable insights for the industry, including:
Strategic Buying
- Why Changes in VLSFO Blends Could Trigger a Wave of Problem Fuels
- Barge Bottlenecks: The Sulphur Compliance Challenge in Southern Europe
- Rising Automotive Fuel Blends Are Driving Flash Point Risks in the Med
- Smarter Procurement: Strategies to Tackle Fuel Quality and Availability Challenges
Practical Compliance
- Biofuel Compliance: How Much Ship Operators Need and the Smartest Way to Buy
- Navigating ISO 8217:2024 and Med ECA Rules: Adapting to a New Era
- Biofuels and LNG: Key Players in the Future of Fuel Compliance
Published January 2025
OPEC+ Kicks the Can with Bunker Costs Set to Fall by 10% in 2025
December 17, 2024
View this article as a PDF » We have seen bunker prices slide for the past two months For a number of months, we have pointed to bunker prices falling under the weight of very weak oil fundamentals. This has certainly come to fruition and bunker… Read More
We have seen bunker prices slide for the past two months
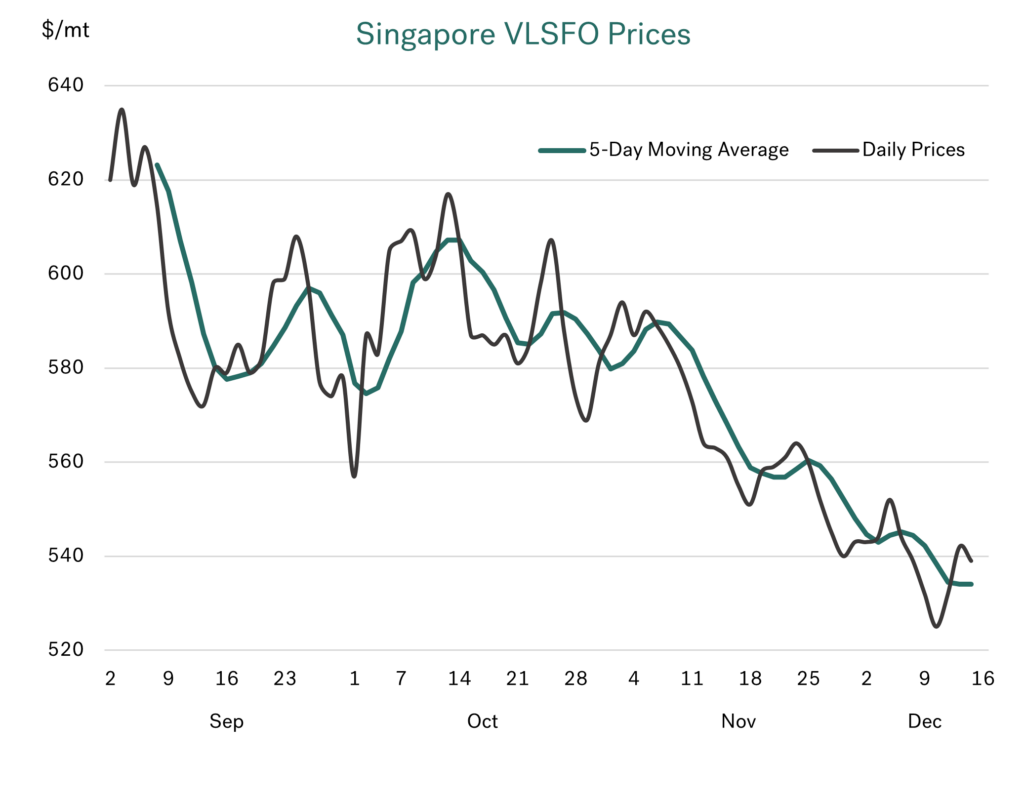
For a number of months, we have pointed to bunker prices falling under the weight of very weak oil fundamentals. This has certainly come to fruition and bunker prices have continued to slide over the past two months. In Singapore, VLSFO prices are some $75/mt lower (minus 12%) than in mid-October, and in Rotterdam the drop has been around $50/mt (minus 10%).
 Source: Integr8 Fuels
In the HSFO markets, the drop has been greater in NW Europe, down $75/mt in Rotterdam over the last two months (minus 14%), with Singapore down $50/mt (minus 10%).
The decline is even clearer looking back to end 2023
The picture below is enough to illustrate how far bunker prices have fallen since the end of last year, and just how low we are today.
 Source: Integr8 Fuels
Has OPEC+ ‘come up with the goods’?
In our report last month, we highlighted the huge dilemma facing OPEC+, who at the time were looking to unwind their 2.2 million b/d of voluntary cutbacks starting in January next year. The problem was this was against a backdrop of weak growth in world oil demand and more than enough new non-OPEC+ production to meet additional demand. Consequently, it has been clear for some time that if OPEC+ wanted to maintain oil prices anywhere close to recent levels, then there was little, or no room for them to start increasing production anytime soon. The original strategy of reversing the cuts in January was almost certain to see Brent crude fall into the $60s (and Singapore VLSFO in the $450-500/mt range).
As is usually the case when faced with adversity, OPEC+ does ‘come up with the goods’. In this instance (at their early December meeting), they decided to shelve any idea of raising production in January, and pushed back the current target start date to April. They have also slowed the re-introduction period, now unwinding the cuts over 18 months, rather than the previously planned 12-month time frame.
At the same OPEC+ meeting, it was also agreed that the planned 0.3 million b/d increase in the UAE’s quota allocation would be pushed back by 3-months, to April and also be staged over 18-months (not 9-months as previously indicated).
The net result is that under current plans, OPEC+ production would increase by around 140,000 b/d each month starting in April, rather than increases of 210,000 b/d starting in January.
The market tells you everything
Looking at oil prices, they continued to slide through November. However, in the run-up to the early December OPEC+ meeting there were indications that the group would again delay (for the third time) any unwinding of the production cuts. The outcome has been for prices over the past 3-weeks to be maintained in the $72-74/bbl for Brent, and the $525-550/mt range for Singapore VLSFO.
The key here is, although prices appear to have held up after the OPEC+ meeting, there has been no significant rebound. The market does not believe at this stage that the new outcome will tighten oil fundamentals and push prices higher. OPEC+ may be ‘kicking the can down the road’ regarding the best timing to unwind production cuts, but they have come together to halt the slide in prices.
There is a strong view that when OPEC+ come to review the April start date, they will again have to delay unwinding production cutbacks.
Analysts vary on their price views, but they don’t see a major rebound
A number of analysts have published crude price projections since the outcome of the latest OPEC+ meeting. As always, there are variations, but looking at views for Brent crude over Q1 and Q2 next year, there are a number within the range $70-75/bbl, which is within the trading range we have seen over the past month and in line with the current $73/bbl price.
 Source: Integr8 Fuels
Goldman Sachs are higher than this range, showing Brent moving up to $77/bbl in Q2, whilst Bank of America (BOA) are much lower, looking at $66/bbl in Q2 .
Based on $70-75/bbl crude price, Singapore VLSFO would be in a range of $525-550/mt (close to current prices). At the extremes, BOA’s view would imply Singapore VLSFO just below $500/mt, and Goldman Sachs at a high of $575/mt. Even at the outer reaches of these analyst views, the bunker market would not be in a ‘shock’ in the first half of next year.
Good news for bunker buyers looking at annual budgeting
If you are in the office and looking at how much you are going to spend on bunkers in 2025, the analysts would suggest, a lot less than this year (and last year). Again, a core of 2025 forecasts lie in the $70-74/bbl range, with BOA at a low of $65/bbl, and Goldman Sachs at a high of $76/bbl; all lower than the $80/bbl average price seen in 2023 and in 2024.
 Source: Integr8 Fuels
UBS does have a higher price forecast of $80/bbl for Brent next year, but this was published before the OPEC+ decision to defer production increases, so perhaps should not be included.
Annual bunker costs 12% less in 2025?
Using these analysts’ views on Brent prices, it implies the 2025 annual average price for Singapore VLSFO falls within a core range of $525-550/mt, with the outer limits up to $570/mt as a high (Goldman Sachs) and $485/mt as a low (BOA).
 Source: Integr8 Fuels
In terms of budgeting VLSFO bunker costs for 2025, it means the ‘core view’ is at least 10% lower than in this year. Even based on Goldman’s ‘higher’ price forecast, annual average bunker costs for 2025 will still be 5% lower than this year. Finally, using the BOA’s forecast suggests there will be a massive 20% reduction next year. Whichever way you look at it, the analysts are currently telling us that we will be spending less on bunkers in 2025!
Steve Christy
Research Contributor
E: steve.christy@integr8fuels.com
A Wild Ride for Oil Prices—Biden, Trump, and What Comes Next
November 20, 2024
View this article as a PDF » Singapore VLSFO 20% lower than 12 months ago Singapore VLSFO prices have fallen even further over the past month, to their lowest levels since last June. The driving force behind this continual slide in prices is the bearish fundamentals… Read More
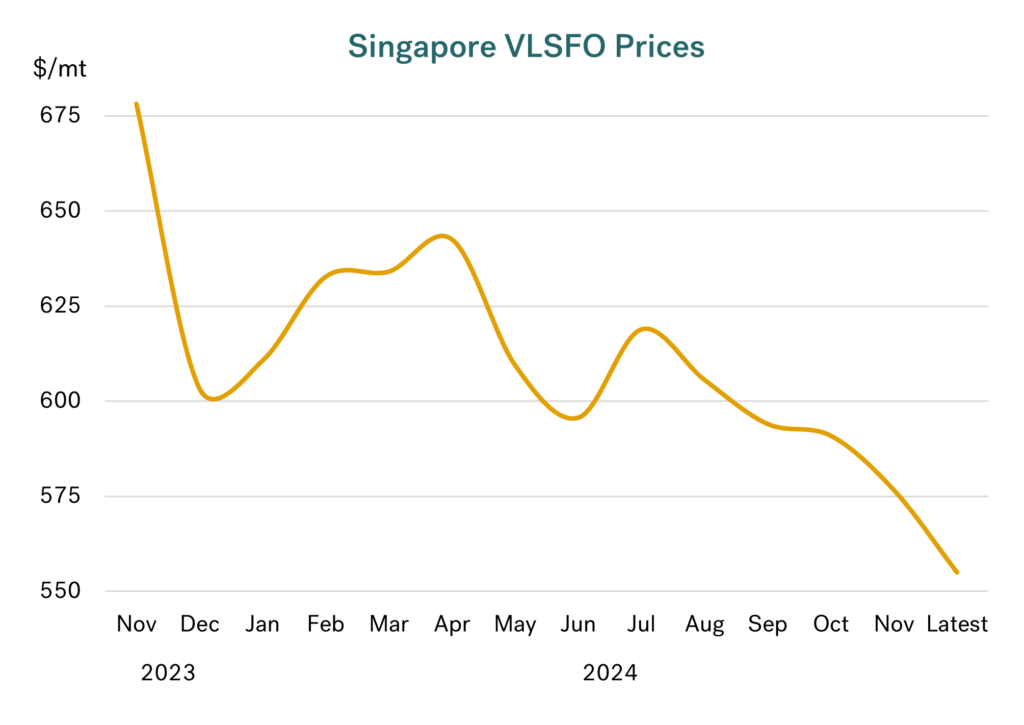
Singapore VLSFO 20% lower than 12 months ago
Singapore VLSFO prices have fallen even further over the past month, to their lowest levels since last June.
The driving force behind this continual slide in prices is the bearish fundamentals in the oil market. There have been short-term ‘interruptions’ in this decline, largely from war-related developments in Ukraine/Russia and Gaza. Though the market has continually come back to focus on the bearish oil fundamentals outlined for this year and next year, especially by the IEA.
 Source: Integr8 Fuels
Developments in the Russia/Ukraine war have not (so far) been enough to reverse the fall in prices. Hence Singapore VLSFO is $50/mt lower than 3months ago, and has fallen by around $125/mt (close to 20%) over the past 12 months.
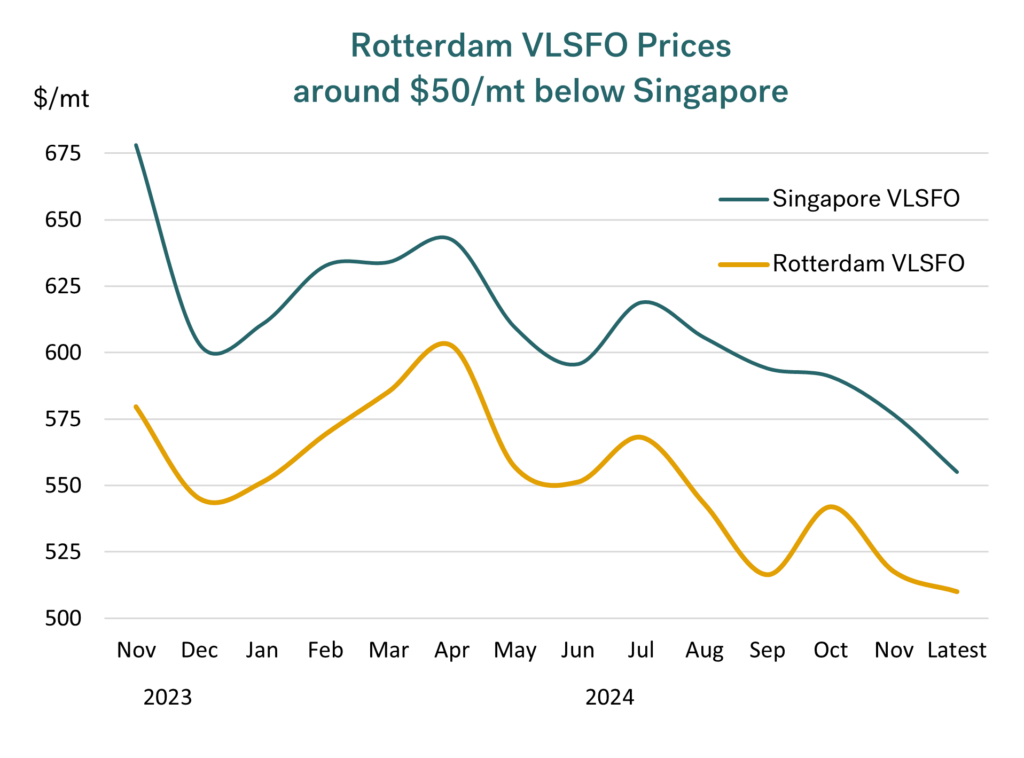
Rotterdam prices also lower
The same price movements have been seen across the bunker world, and in other product markets as well. The graph below illustrates VLSFO prices in Rotterdam, which generally follow the same trend as in Singapore (apart from in September, when there was tightness in the Singapore market). Consequently, Rotterdam VLSFO prices are now just above $500/mt, and back to around $50/mt below those in Singapore.
 Source: Integr8 Fuels
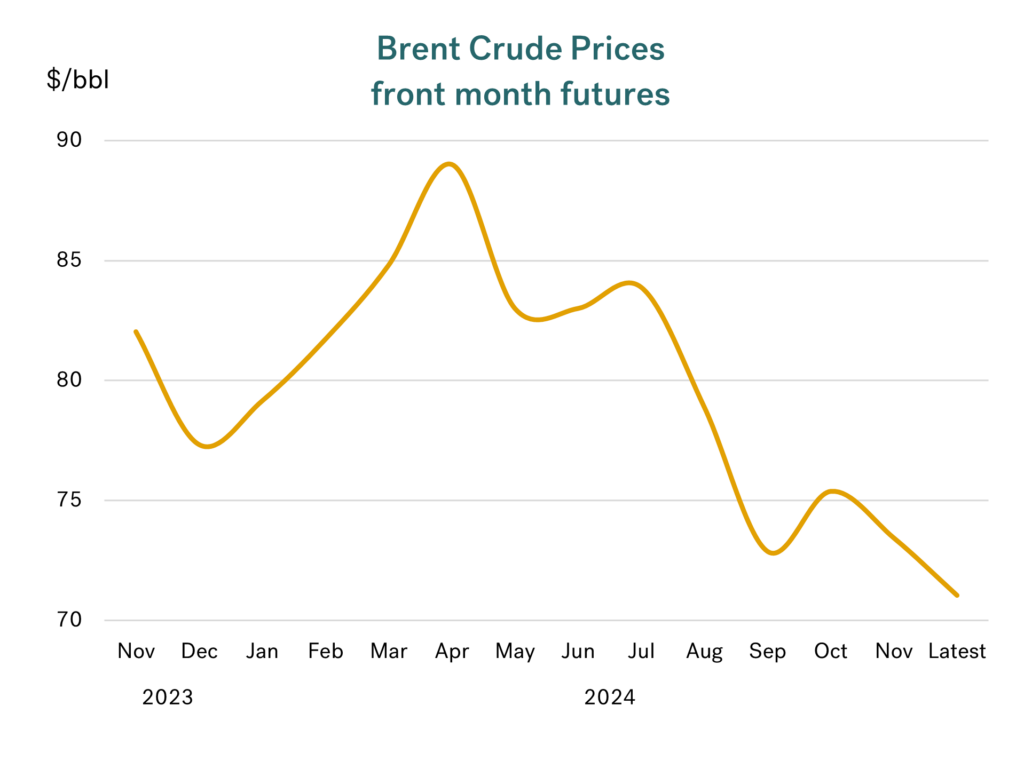
It all comes back to crude
Everything ultimately comes back to the crude oil price, and the benchmark references we all use are Brent and WTI futures prices; the whole industry feeds off these prices. So, the starting point for us is Brent, and the graph below is more-or-less the same illustration we have highlighted for VLSFO above; there are of course important nuances in bunker prices, but here we are just focusing on the bigger picture.
 Source: Integr8 Fuels
There are always three things to assess!
Two big things to look at now are the Russia/Ukraine war, and anything that OPEC+ does. But we must also include any significant changes that newly elected President Trump implements, including bringing the Russia/Ukraine war to an end and possible higher trade tariffs against China.
However, before Trump is inaugurated, it seems President Biden is potentially making one last big move for Ukraine, with the provision of long-range missiles able to strike well into the Russian interior. This may also be a trigger for European allies to offer ‘more-powerful’ weapons to Ukraine. These comments have already pushed oil prices a little higher.
What will it take to push bunker prices even lower?
So, if long-range missiles are available to Ukraine, it is likely to mean oil prices go higher; but a Trump ‘solution’ to the war will mean prices go lower. At this stage no one knows where this will go, but it won’t be difficult to follow, it will be all over the front pages!
We can only sit and wait to see what happens in Russia/Ukraine, but we can look more closely at the situation for OPEC+, and what that might mean for oil prices and us in the bunker market.
OPEC+ is in a difficult position in that it has planned to gradually unwind at least 2 million b/d of additional voluntary cutbacks, but has said this is dependent on market conditions. With oil prices falling, the market conditions for OPEC+ ‘have not been met’, so they have continually deferred any decision to increase production, despite some individual members pushing to raise output. The latest decision is to potentially start ramping up production in January, adding around 180,000 b/d each month.
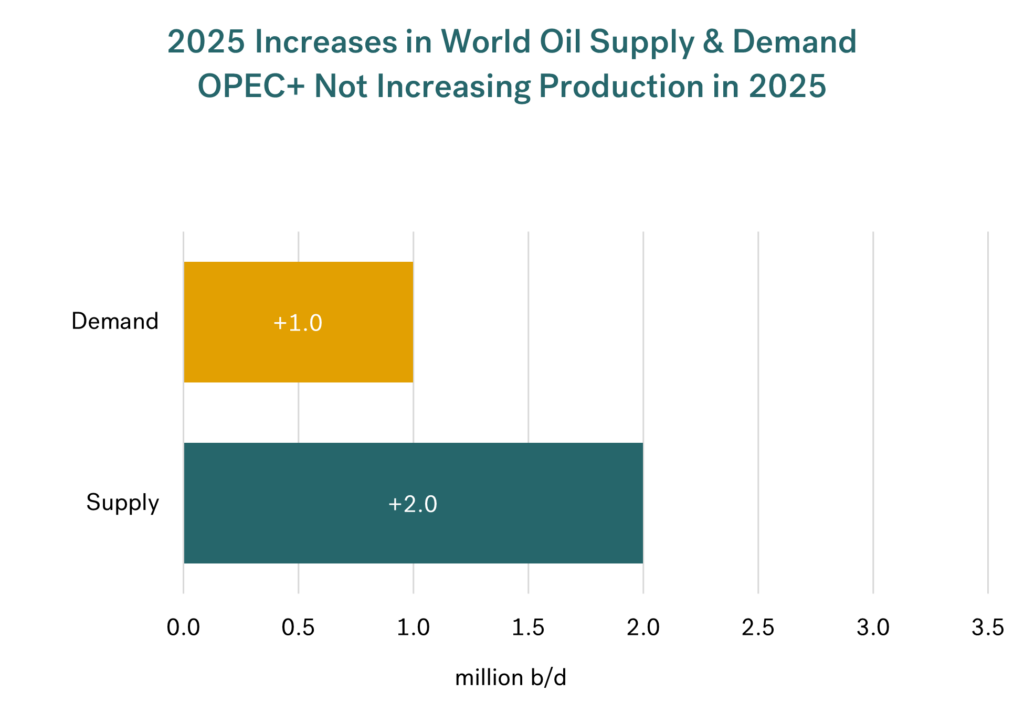
There is already strong growth in non-OPEC+ production projected for next year. Therefore, if OPEC+ does go ahead and unwind their production cuts, world oil supply could increase by more than 3 million b/d in 2025. This is against a projected increase in oil demand of only 1.0 million (by the IEA). The graph below illustrates the massive difference between the supply and demand increases next year, with the implication of a much weaker oil market and even lower oil and bunker prices.
 Source: Integr8 Fuels
The IEA is at the lower end of demand forecasts for next year, but even looking at the US EIA and OPEC themselves, they only indicate a demand growth of 1.2 million b/d and 1.5 million b/d respectively. So even here, it still shows a large imbalance and infers weaker bunker prices.
Even if OPEC+ does continue to defer any decision to unwind the cutbacks for the whole of next year, it still suggests that world oil supply will increase by 2 million b/d. Again, taking any of the main forecasters’ views on demand for 2025, it still implies ‘too much oil’, and a potential further fall in bunker prices.
 Source: Integr8 Fuels
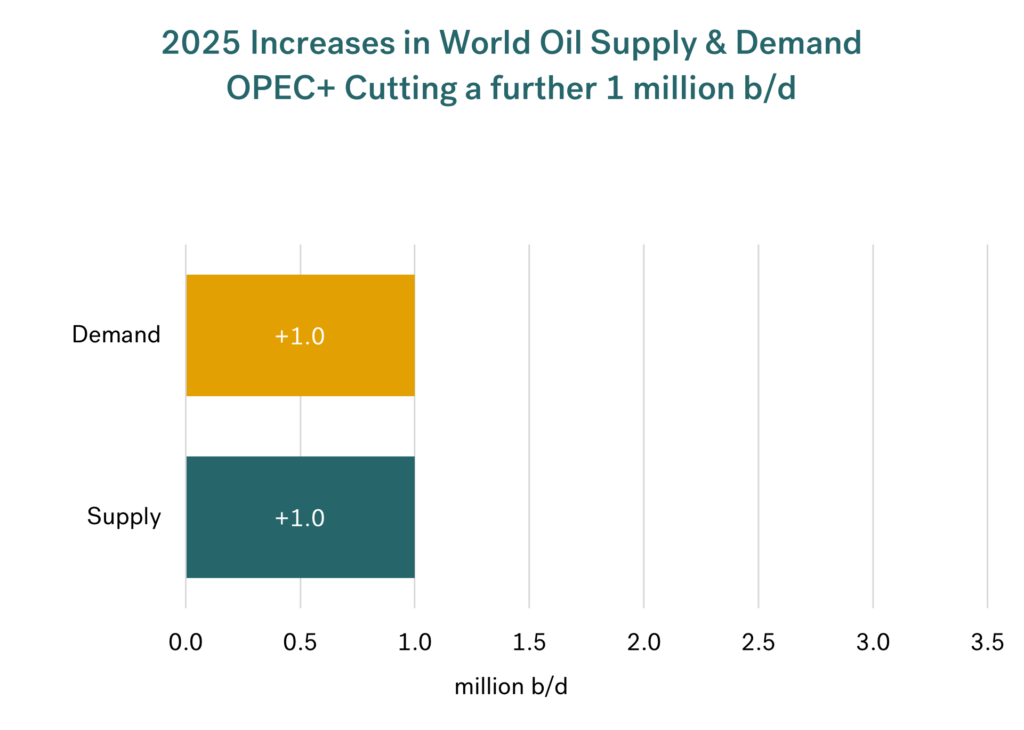
Looking at the fundamentals, the only ‘balanced’ outlook for next year is if OPEC+ make a further production cutback of around 1 million b/d!
 Source: Integr8 Fuels
Given that OPEC+ is talking about increasing production, at this stage it seems highly unlikely they will make a quick decision to impose further cuts.
The fundamentals & Trump could mean even lower bunker prices in 2025
So, from a purely fundamental view, everything points to sustained ‘low’ prices next year, and if OPEC+ is not prepared to make further cuts then there is every indication that oil and bunker prices could be even lower in 2025.
BUT we are not in a purely fundamental market, and in geopolitical terms it is Russia/Ukraine that is at the forefront. If Biden’s latest move on long-range missiles is carried out, then prices are likely to rise, even if its in anticipation of an escalation in the war. However, from the early part of next year we may see far more unpredictable outcomes under President Trump. If the war does come to an end, and OPEC+ increase, or even maintain output, then VLSFO prices in the $500s may look high!
Let’s watch Biden, Trump, and OPEC+ to see what happens.
Steve Christy
Research Contributor
E: steve.christy@integr8fuels.com
The IEA’s latest long term energy report shows a potentially bigger bunker market going forward
October 23, 2024
View this article as a PDF » The IEA report is another influential study for us to consider Three months ago, we highlighted BP’s analysis of the longer-term oil industry and the implications for the bunker market, taken from their ‘Energy Outlook’ report to 2050. Last… Read More
The IEA report is another influential study for us to consider
Three months ago, we highlighted BP’s analysis of the longer-term oil industry and the implications for the bunker market, taken from their ‘Energy Outlook’ report to 2050. Last week the IEA published their long term ‘World Energy Outlook’ to 2050, taking another look at how things could pan out under three different scenarios.
Here we take a dive into what this could mean for the oil industry, and then specifically what they are saying about shipping and the potential impacts on our markets for bunkers.
We know major changes will happen
There is a clear global direction away from oil (and other fossil fuels). The IEA report highlights this, plus the ongoing electrification of the overall energy system, and that clean electricity is the future.
Coming down to the more micro-level of shipping (and aviation), the IEA recognises that we are in a difficult industry to eliminate hydrocarbons. The phrase they use is that we are in a “hard to abate” sector.
Two scenarios showing a possible range, and a case to get to net zero by 2050
The three IEA scenarios are labelled as follows:
Stated Policy case – The course we are on based on policies and technologies currently in place.
Announced Pledges case – If all government/industry pledges and targets are met in full and on time.
Net Zero by 2050 – A path that would achieve net zero by 2050, limiting global warming to 1.50C
Oil is in decline: other energy forms (and efficiencies) will take over
There are a whole host of challenges to meet environmental targets, but the starting point is the world still ‘wants’ more energy. Economic growth in the developing and emerging economies, and the global population forecast to grow from 8.1 billion now, to 9.7 billion by 2050 (up 20%) are a testament to this.
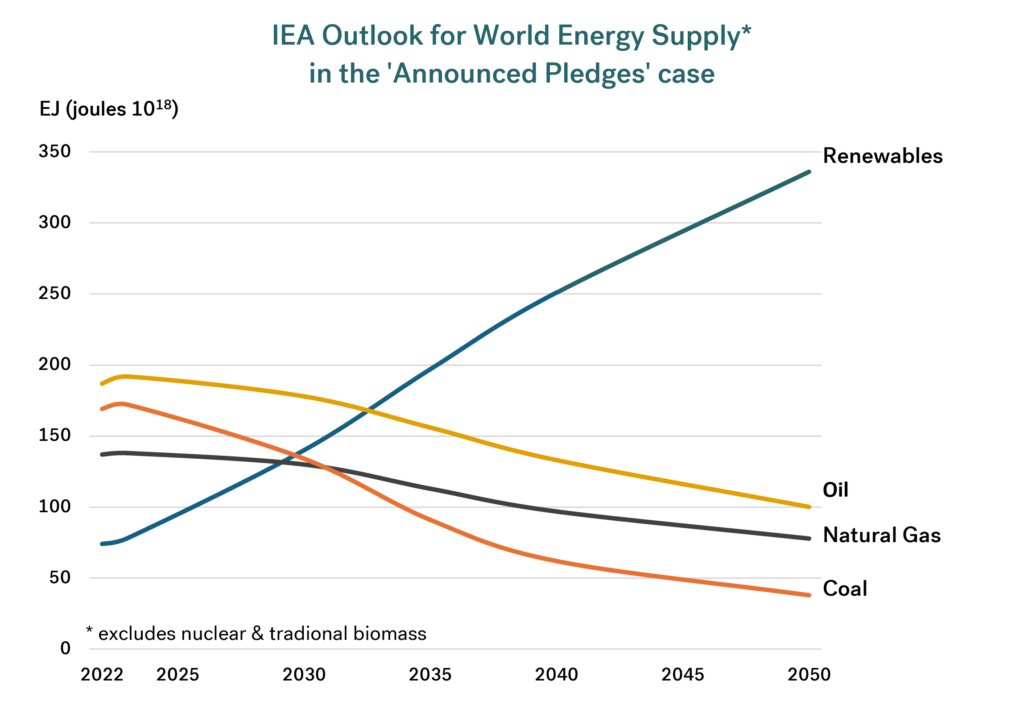
However, by the next decade this growth will be ‘fuelled’ without using more oil, natural gas, or coal, i.e. we only 6-7 years away from peak fossil fuel demand. Renewables (largely to produce electricity) and energy efficiency will be the new bywords in energy demand. The graph below illustrates the scale of these changes from fossil fuels to renewables and electricity under the IEA’s ‘Announced Pledges’ case.
 Source: Integr8 Fuels
What is happening to oil demand?
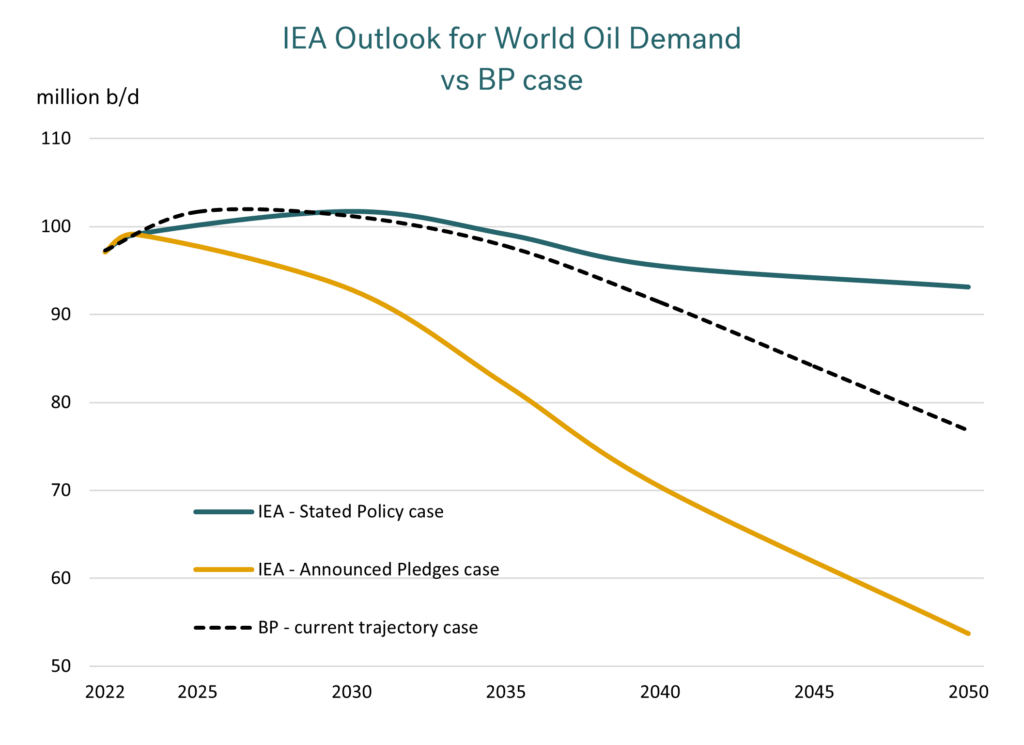
In the IEA’s ‘Stated Policy’ case, world oil demand remains just above 100 million b/d through to the early 2030s, and then only falls to around 93 million b/d by 2050. In terms of the discussion, this is likely to be at the very high end of oil demand forecasts. There is an expectation that more governments, industries, companies, and individuals will move towards greater environmental commitments, not least as the cost structure of new technologies is reduced.
The IEA’s second scenario, the ‘Announced Pledges’ case, reflects everyone actually doing what they have said they will do, and doing it on time. This illustrates a case where oil demand would fall to around 50 million b/d by 2050, half the size it is today and clearly a radical change in the market.
A ‘reality’ case may be somewhere between the two lines shown by the IEA, and this is where BP put their ‘Current Trajectory’ case three months ago (see graph below).
 Source: Integr8 Fuels
What would net zero by 2050 mean for oil?
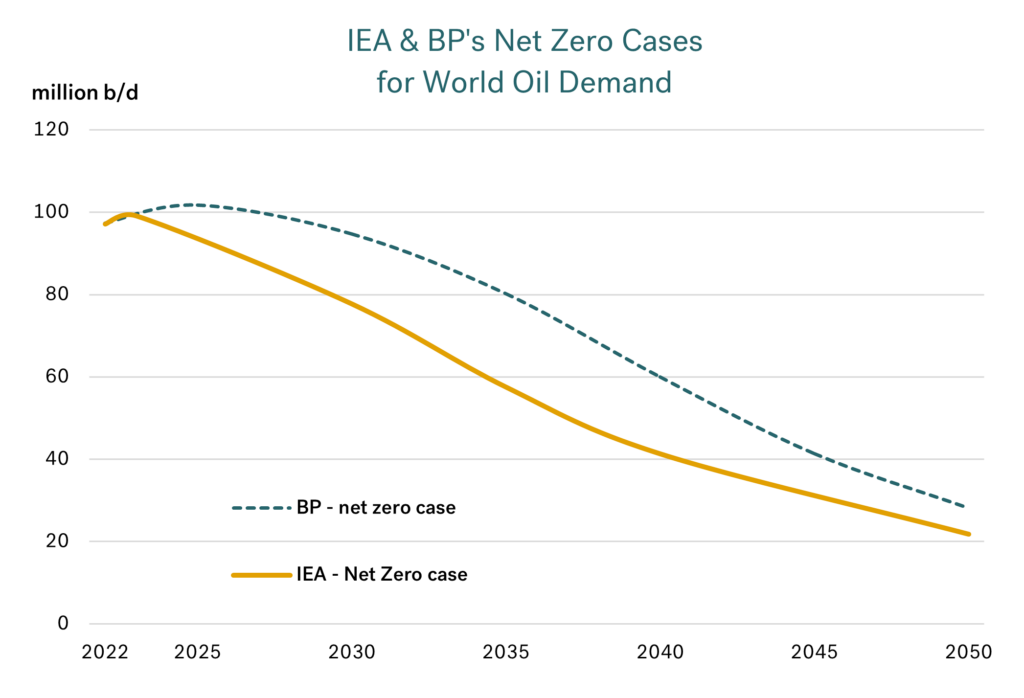
The ‘Net Zero’ case put forward by the IEA (and by BP) illustrate the kind of ‘oil world’ we would have to be in to achieve net zero by 2050. These are not forecasts, and at this stage seem highly unlikely to be achieved by 2050.
 Source: Integr8 Fuels
However, they still show the very credible implications for the oil industry at some stage in the future, based on the global moves away from fossil fuels. In both the IEA and BP scenarios we get to an oil industry of only 20-25 million b/d in a ‘Net Zero’ world. This is not a viable market size to maintain scaled-up oil infrastructure across the globe, and illustrates the direction the oil industry, and the oil bunker markets are going in the longer term. It just re-iterates the case that we must gear up for change.
We are in one of the ‘more difficult’ oil sectors
In all of this analysis, electrification is a key means of reducing CO2 emissions, and will play an enormous role in industry, buildings, and road transportation. However, for us in shipping (and in aviation) there is no obvious, easy, or low cost means of using electricity to power our needs. The IEA states that we are in “hard to abate” sectors, and that hydrocarbons will continue to play the leading role. However, they also state that we will go through significant policy changes (through the IMO and the EU) to decarbonise our market and this is assumed to be through biofuels, ammonia, methanol, hydrogen and hydrogen-based fuels, other low emission fuels, plus greater efficiencies being imposed.
Now for the good news!
There is a huge amount of analysis that goes into this IEA report, starting with economic forecasts and moving all the way through government/institutional policy, industry and consumer responses and ultimately ending up with a demand figure for distinct types of energy in each of the sectors.
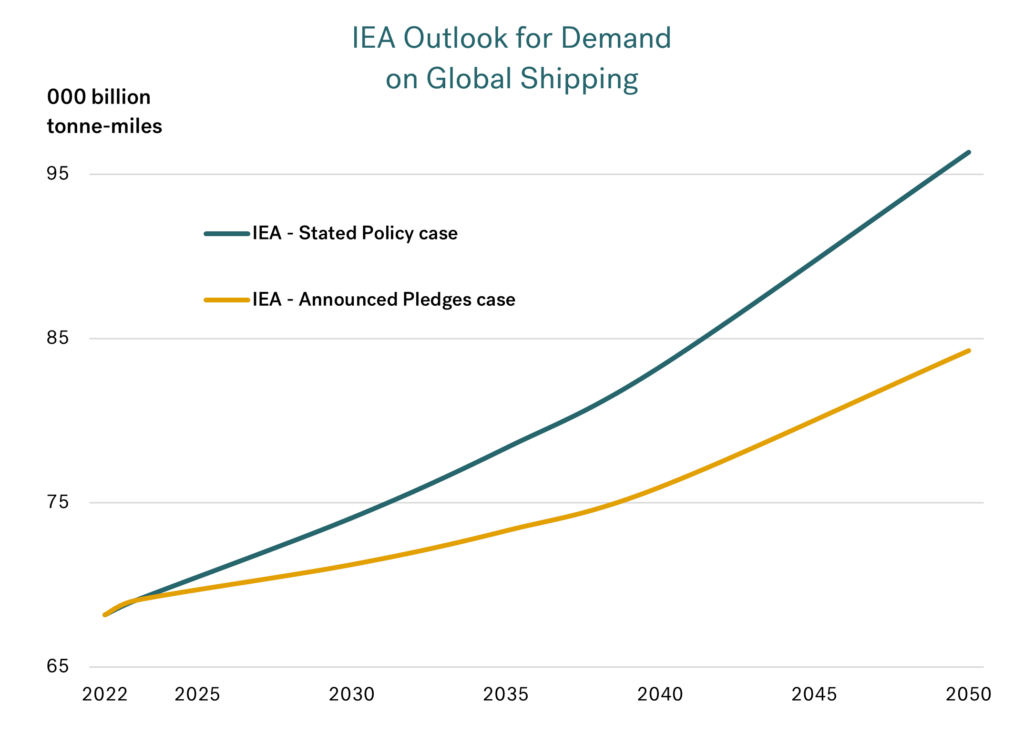
Within this work the IEA calculates the demand on shipping under their three different cases, and put a tonne-mile (or tonne-kilometre) figure on this. The graph below illustrates their tonne-mile demand for shipping in the ‘Stated Policy’ and ‘Announced Policy’ cases (the ‘Net Zero’ case being highly unlikely in the time-frame to 2050).
 Source: Integr8 Fuels
The IEA’s ‘Stated Policy’ case shows the tonne-mile demand for shipping rising by more than 35% by 2050. In their ‘Announced Policy’ scenario they show a gain of 20%. Working off a single, ‘credible’ case somewhere between these two scenarios would indicate a rising shipping requirement of around 25-30% over the next 25 years.
Although growth in the bunker market is likely to be less than this, with efficiency gains, we are still likely to be in a growth sector!
Conclusions are: Adapt, Change, and move into a bigger market!
We are in an industry where it is harder to use the existing technologies of electrification to achieve decarbonisation, but we will be pushed along decarbonising policies; we must adapt. And if the size of our market is getting bigger, then there could be more opportunities for us and other players/investors to get involved.
We have to continue to watch what is happening out there, in terms of fuels, technologies, developments and what people are doing. We can also have an influence. In this way we can be best prepared for the opportunities that will be there in a new, and potentially bigger bunker market.
Steve Christy
Research Contributor
E: steve.christy@integr8fuels.com

We are at a 3 year low in prices, but not for VLSFO in Singapore!
September 25, 2024
View this article as a PDF » Crude prices have fallen to 3-year lows In the monthly reports this year we have often highlighted the bearish fundamentals within the oil industry, especially those from the IEA. The IEA has for some time been forecasting very low… Read More
Crude prices have fallen to 3-year lows
In the monthly reports this year we have often highlighted the bearish fundamentals within the oil industry, especially those from the IEA. The IEA has for some time been forecasting very low growth in global oil demand for this year. Last month we also emphasised the shift in analysts’ views from a bullish to a bearish outlook on prices for 2024/25. These bearish fundamental views are certainly being fulfilled at the moment.
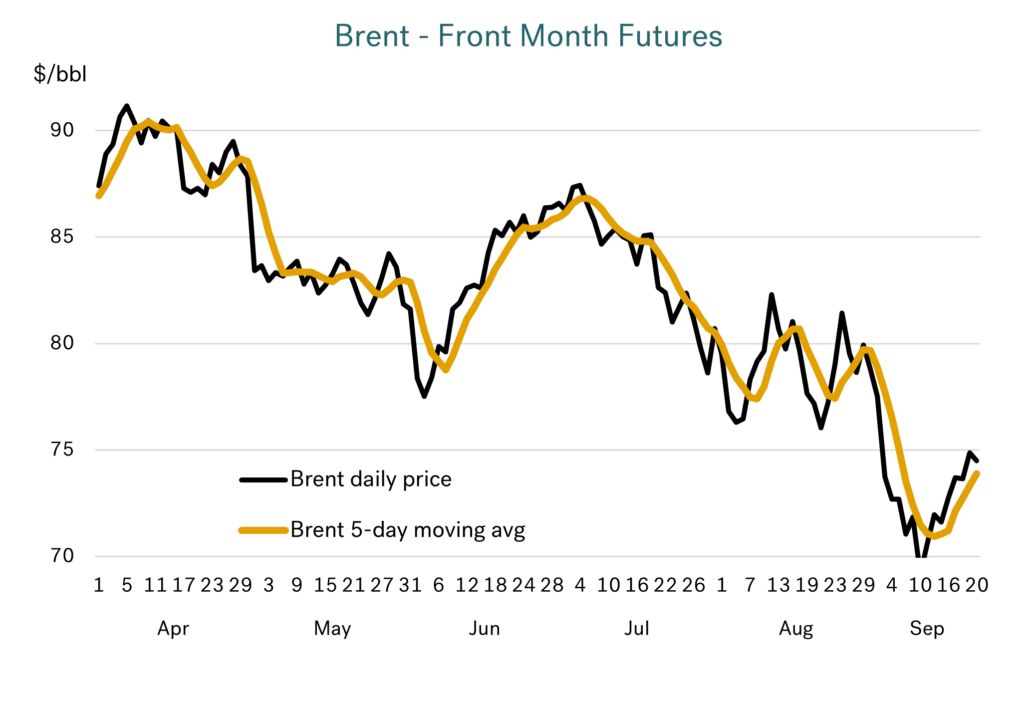
The graph below illustrates the downward moves in Brent crude prices over the past 6 months, falling from:
- around $90/bbl in April;
- to the $80s in May, June and July;
- to just below $80/bbl in August;
- and now into the low $70s (after falling to just below $70/bbl, its lowest since December 2021 – almost 3 years).
 Source: Integr8 Fuels
This equates to a 20% fall in crude prices since April and has taken place despite heightened tensions in the Middle East, relatively low oil stocks and OPEC+ recently deferring any increase in production by at least 2 months, until December.
The bearish fundamental signals are currently dominating the market and are clearly strong enough to overcome all the other political, war-related and OPEC+ factors!
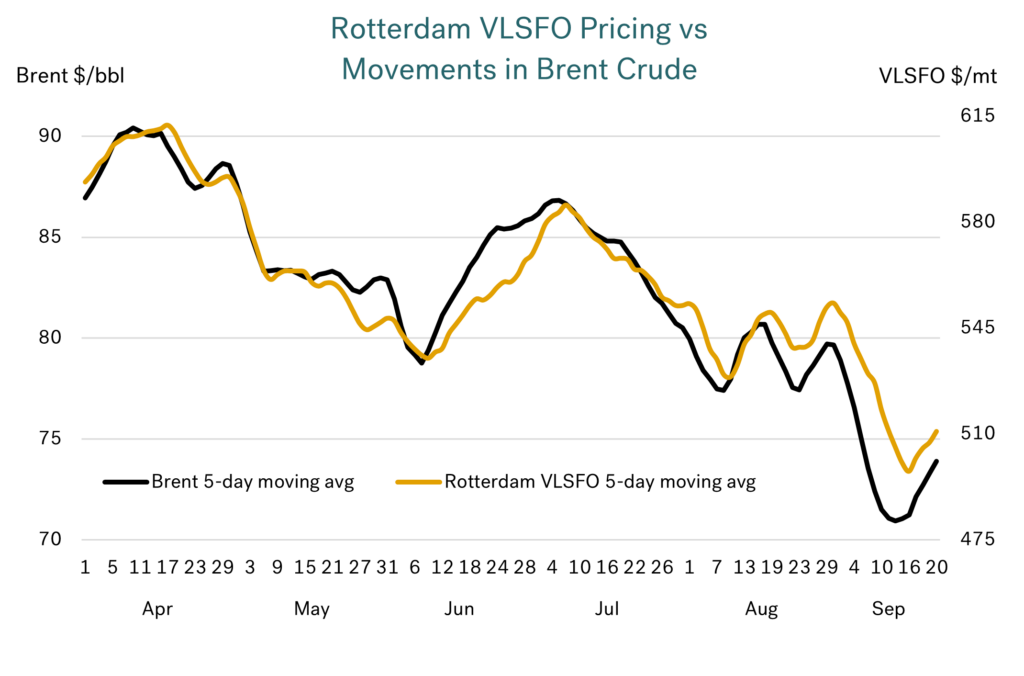
Rotterdam VLSFO prices have tracked crude
For us, the focus is what is happening to bunker prices, and the ‘easiest’ analysis is in the Rotterdam VLSFO market. Here, these bunker prices have closely tracked the developments in Brent crude, such that earlier this month Rotterdam VLSFO prices dipped below $500/mt and have been at their lowest for some 3 years. Current prices are slightly higher, at around $520/mt, but are still tracking the bearish sentiment of the crude market.
 Source: Integr8 Fuels
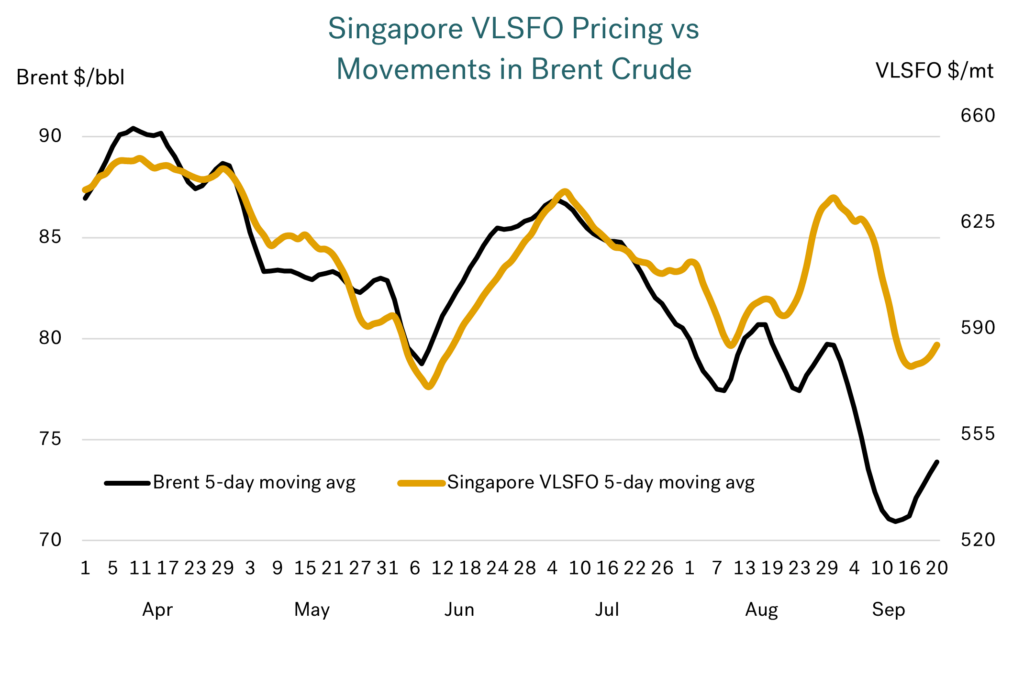
Singapore VLSFO prices have bucked the trend
There is a different story when it comes to the VLSFO market in Singapore. Here prices were tracking crude between April and early August, but Singapore VLSFO prices have not followed the recent drop in crude and Rotterdam VLSFO prices to their 3-year lows. In fact, Singapore VLSFO has remained either side of $600/mt since May. Ordinarily, if Singapore VLSFO prices had tracked crude (as in Rotterdam), then we may have expected a more recent drop of some $50/mt, towards $550/mt. It never happened and it’s never that simple!
 Source: Integr8 Fuels
As outlined in our weekly market updates, VLSFO supply has been very tight in Singapore, with strong backwardation in prices and lead times of 10-13 days. This has meant Singapore VLSFO prices have been well supported and moved to a strong premium versus crude (and other products).
Any rebalancing in the Singapore VLSFO market should see prices re-align with crude and other product prices. If this takes place whilst oil prices generally remain under downwards pressures, then we could expect a substantial drop in Singapore VLSFO prices.
Looking at the bigger picture: It is China
As always, it is worth understanding what is driving the market at any given time; in this case it is China.
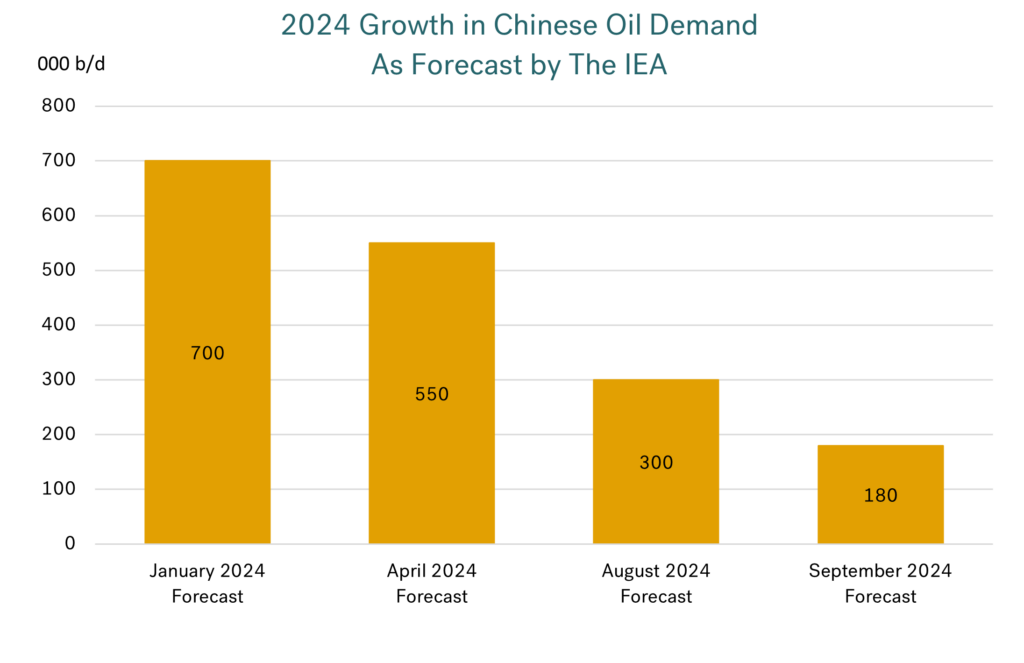
Economic growth in China over the second quarter this year is assessed at 4.7%, which is slightly lower than the official 5% target rate.
However, there have been massive downwards revisions to forecast growth in Chinese oil demand this year. Back in January the IEA forecast an increase of 700,000 b/d in Chinese oil demand for 2024. By April, expectations had dropped to a growth of 550,000 b/d this year, and by August growth in Chinese oil demand for 2024 was set at only 300,000 b/d. Though there has been another downwards revision this month, and the IEA now sees Chinese oil demand growing by just 180,000 b/d this year; massively different to expectations at the start of this year.
 Source: Integr8 Fuels
These ever-reducing expectations for oil demand growth in China is one of the key signals behind the current bearish sentiment and recent drop in global oil prices, to 3-year lows.
Getting more granular, the big changes in Chinese demand expectations have taken place in the naphtha and the gas/diesel oil sectors. Growth in Chinese naphtha demand is still positive, but has slowed, with delays in new petrochemical capacity coming onstream. However, Chinese gas/diesel is the most impacted product, with demand actually expected to fall this year. This is unheard of in the context of China’s meteoric rise as an economic powerhouse.
This decline in gas/diesel demand comes with weaker economic projections for the Chinese economy, major concerns about the property market and a greater use of alternative fuels in commercial road trucks.
The prospects for Chinese demand next year are equally low
Growth in Chinese oil demand next year looks equally constrained, with a forecast increase of around 250,000 b/d. Apart from higher volumes of LPG, ethane and naphtha going into the petrochemical sector, demand for all other main products looks like remaining near flat with 2024 levels. EVs already account for the majority of new car sales in China, along with an increasing number of ‘alternative’ trucks. This, plus the rapid expansion of an electrified high speed rail network (‘taking’ demand from domestic air travel), will limit any increase in the demand for gasoline, jet fuel and diesel in the next few years.
Looking further ahead, there are potential declines of close to 3% p.a. in the Chinese gasoline and diesel markets over the next 5 years, as the economy matures and the number of EVs continues
to increase.
Global fundamentals show no signs of higher oil prices
In the broader picture, cuts in global interest rates may signal some support and stimulate an element of growth in world oil demand; we did see a slight price hike when the US Fed cut interest rates for the first time in four years, by 0.5%. However, we are in a world where oil demand is flat-to-declining in the OECD countries, and growth is far less than it used to be in China.
Against these muted prospects for world oil demand, next year we are expecting strong increases in non-OPEC+ production and potential increases in OPEC+ production. These gains in supply are likely to be more than enough to put a cap on higher oil prices, even if oil demand is higher than expected.
Weak fundamentals versus threats of war
Today the risk of higher prices comes from heightened political tensions or war. It is this balance between weak fundamentals and the ‘war situations’ in the Middle East and Ukraine/Russia that the market is closely watching.
Steve Christy
Research Contributor
E: steve.christy@integr8fuels.com

VLSFO prices are close to recent lows and could be even lower next year.
August 21, 2024
View this article as a PDF » VLSFO prices have rebounded though they are still close to recent lows. Since February, Singapore VLSFO prices have traded within the range $570-650/mt, and now are closer to the low of this range. Rotterdam prices have followed a very… Read More
VLSFO prices have rebounded though they are still close to recent lows.
Since February, Singapore VLSFO prices have traded within the range $570-650/mt, and now are closer to the low of this range. Rotterdam prices have followed a very similar trend, but at around $50/mt below Singapore.
 Source: Integr8 Fuels
What have been the key recent developments?
We have previously highlighted the main driving forces behind these big changes in oil and bunker prices, with:
- The collapse in oil prices in May down to concerns about economic growth and weaker oil demand (especially in Europe), along with rising oil stock levels;
- The rise in June/July oil prices as ‘speculators’ aggressively bought back into the market after heavily unwinding positions in the previous month.
Since early July, prices have fallen back towards the lower end of the recent price range, as concerns about the US economy (based on unexpectedly weak employment data) triggered a sharp drop in global stock markets. However, these signals seem to have eased and stock markets and oil prices have rebounded over the past 1-2 weeks.
Crude prices are where we start
The starting point for all oil prices is ‘what is happening to crude’. For these reasons we always have to come back to the crude price, and in particular Brent and WTI futures on ICE and Nymex.
Over the past four and a half months, Brent front month futures have traded in the range $76-91/bbl, again with current prices just above recent lows and close to $80/bbl.
 Source: Integr8 Fuels
From the two graphs, the VLSFO price has closely tracked the same peaks and troughs as the Brent price.
What are the issues to look for going forward?
There are a lot of factors that can drive oil and bunker prices over the short term. Current geopolitical developments in the Middle East could push prices in either direction (ceasefire/continued war); at the time of writing there is more positive talk about a potential ceasefire between Hamas and Israel.
Similarly, the situation in Russia and Ukraine has the propensity to shift the market, although currently this seems to have taken a ‘back-seat’ in terms of oil prices.
Add to this the escalating rhetoric surrounding the November US presidential election, which is likely to create more noise in markets and prices.
However, it is often economic sentiment that can have a huge short-term bearing on prices, as we have just seen with US employment data triggering a bearish domino effect on to stock markets and commodity prices. Although prices have rebounded off these lows, there is still a nervousness about weak economic prospects in the US and China, which are the powerhouses behind global sentiment.
Given this, what are the prospects for oil demand next year?
There are variations in oil demand forecasts for next year, with the IEA forecast for growth at the low end of the range, at less than 1 million b/d. The US EIA forecast is higher, with 2025 demand growth at 1.6 million b/d, and OPEC’s forecast is even higher, at 1.8 million b/d.
Taking a ‘representative’ average of these bullish and bearish cases and looking at the year-on-year quarterly developments, this shows a stronger growth pattern through the second half of this year and into the first quarter of next year. However, even then, it only hits 1.4-1.6 million b/d. From the second quarter next year onwards, year-on-year demand growth is less and only forecast at just above 1 million b/d.
 Source: Integr8 Fuels
Against this backdrop, non-OPEC+ production is forecast to increase by more than 2 million b/d through to the end of next year. This means that even if OPEC+ maintain their current voluntary and agreed production cutbacks through to the end of next year, the oil fundamentals will still weaken. If they start to unwind the cutbacks from October this year as planned, the fundamentals will be even weaker!
What does OPEC+ do in the circumstances?
A big question for the oil market is on OPEC+, and the ‘will they/won’t they’ question about starting to unwind their voluntary and agreed production cutbacks. This will clearly have a direct impact on oil and bunker prices.
The current plan was agreed in June and is for the 2.2 million b/d voluntary cutbacks to start unwinding in October, with the process continuing over the following 12 months through to September next year. If they go ahead, it will add 1.6 million b/d more oil from the Middle East, almost all of which are all high sulphur grades.
OPEC+ has stated that any unwinding of the cutbacks will be dependent on market conditions, and so if they are looking to at least maintain prices as close to current levels as possible, an extension of the current agreement well into next year would seem the outcome.
However, this is a collective OPEC+ agreement and so internal politics also play a role. If oil prices are falling and national revenues are ‘lost’, one way out is to produce more!
The question of market share also arises; with Saudi Arabia recently trying to defend its market by heavily reducing its formula prices for European buyers and making much smaller increases than expected for Asian buyers.
If OPEC+ does go ahead and raise production in October, this would send a very bearish signal to the market and oil prices are highly likely to fall.
All awaits OPEC+ on their decision, which could come next month, ahead of their next formal meeting on October 8th.
What are the crude price views for next year?
Given all these developments, most analysts have reversed their views from April this year, when they were typically forecasting a rising market in 2024 and Brent prices in the $85-90/bbl range. Now, four months later, most analysts are indicating lower expectations for this year, with Brent averaging $83-84/bbl, and a falling market in 2025, with Brent prices in the range $75-81/bbl. The US EIA is an exception, indicating a Brent price of $85/bbl for next year (but this is still only slightly higher than today).
 Source: Integr8 Fuels
Finally, what does this mean for bunker prices in 2025?
If (and this is a big IF) the analysts are right in their Brent forecasts, and VLSFO broadly tracks the price of Brent, then we are looking at lower bunker prices next year, with Singapore VLSFO in the $550-600/mt range.
 Source: Integr8 Fuels
Let’s keep watching and see what happens.
Steve Christy
Research Contributor
E: steve.christy@integr8fuels.com
We may be in an oil-dominated bunker market for at least another 10 years; but we cannot stand still!
July 24, 2024
View this article as a PDF » BP’s latest analysis looking at the energy sector to 2050 BP has just published its annual ‘Energy Outlook’ looking at two scenarios going through to 2050. These are not forecasts, but illustrate two cases, the first reflecting what it… Read More
BP’s latest analysis looking at the energy sector to 2050
BP has just published its annual ‘Energy Outlook’ looking at two scenarios going through to 2050. These are not forecasts, but illustrate two cases, the first reflecting what it would take to reach ‘net zero’ by 2050, and the second showing a scenario if the world continues on its ‘current trajectory’ of policies and timings towards environmental measures.
A picture paints a thousand words!
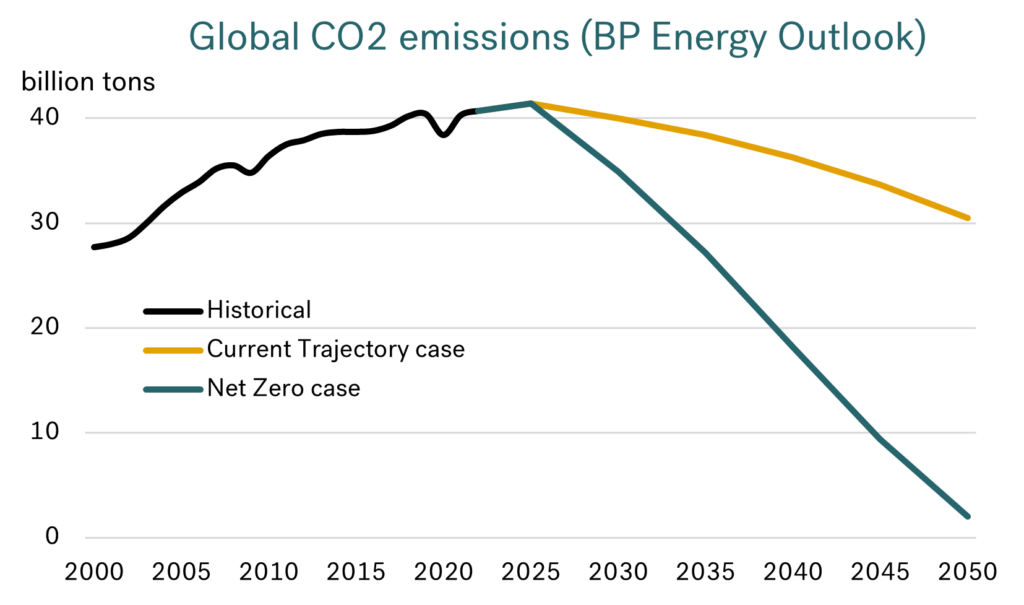
Historically, the graph below shows how CO2 emissions have risen since 2000 and that the environmental measures taken so far have not been enough to stop increases in global CO2.
 Source: BP
Looking to the future, the net zero case highlights the extreme challenges the world faces to achieve this target by 2050. It is literally the ‘bottom line’ for any scenario looking at the future for energy, and a 95% decline in CO2 emissions would clearly have an inconceivable impact on almost all industries, including our own.
Even BP’s ‘current trajectory’ case indicates a turning point and a 25% decline in CO2 emissions by 2050. This is still a major shift from where we are today and would require significant changes in bunker fuels to take place (as is shown later in this report).
A focus on BP’s oil and shipping analysis
In their outlook BP cover oil, gas, coal, power, and low carbon hydrogen. However, in this report we focus on BP’s scenarios for the oil sector and their cases for marine fuels.
The first main point is that in both scenarios there is a forecast major increase in seaborne trade; a 70% gain in the current trajectory and a 30% gain in the net zero case by 2050. Despite this, with greater efficiencies and shifts they see no net gain in energy demand for shipping under the current trajectory case, and a 20% decline in net zero.
The common theme in both cases is that BP see a move away from oil as a bunker fuel and a shift to what are currently viewed as ‘alternative fuels’. This is through the delivery of new ships capable of running on alternative fuels and the retro-fitting of older ships to use these alternative fuels. In this way, biofuels and low carbon hydrogen are potentially the biggest elements of the bunker market going forward, especially moving towards a ‘net zero’ world.
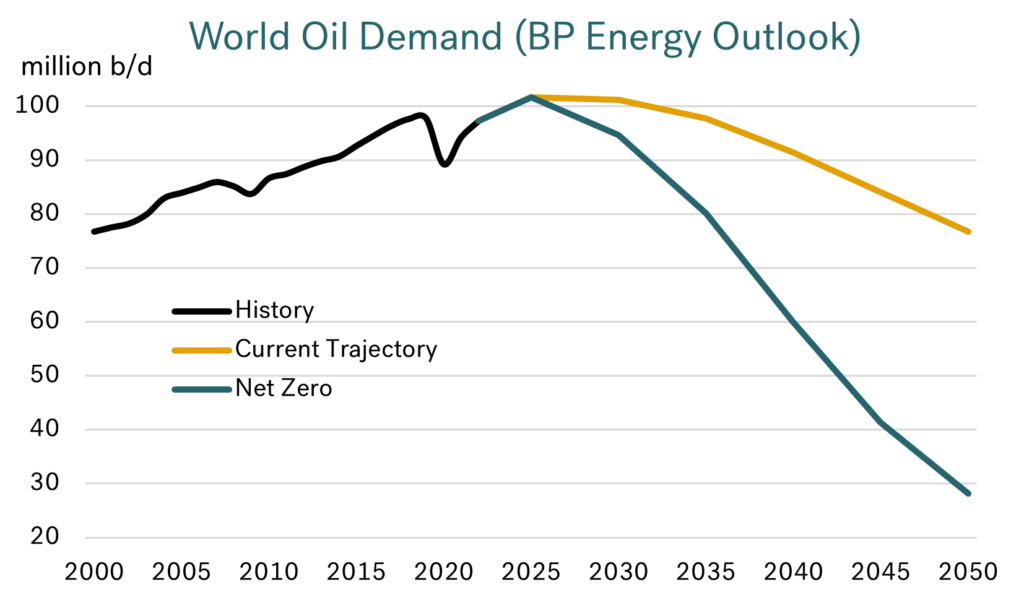
What is the outlook for oil demand in the two BP scenarios?
Electrification is going to be the major shift in the energy balance. The ever-falling cost structure of wind and solar power is accelerating this transition. For oil markets, there is already a seismic shift underway in the electrification of road transport markets, away from gasoline and diesel towards EVs (and electric trucks sometime in the future).
Although shipping is generally a ‘hard to electrify’ industry, we are not immune to what is happening elsewhere in the oil sector. The loss in gasoline and diesel demand could have a major knock-on effect on refining.
It is not surprising that the future profile for oil demand is very much aligned to the success, or not of reducing global CO2 emissions. Hitting the net zero target by 2050 (or whenever this may be) would mean a near non-existent oil industry.
 Source: BP
In contrast, BP’s ‘current trajectory’ case would mean the size of the oil industry stays more-or-less the same as it is today through the next 10 years. It is only in the 2035-50 period that oil demand declines, and then only taking it back to the same size of the market we saw in 2000.
The make up of the oil industry is going to change, whatever happens
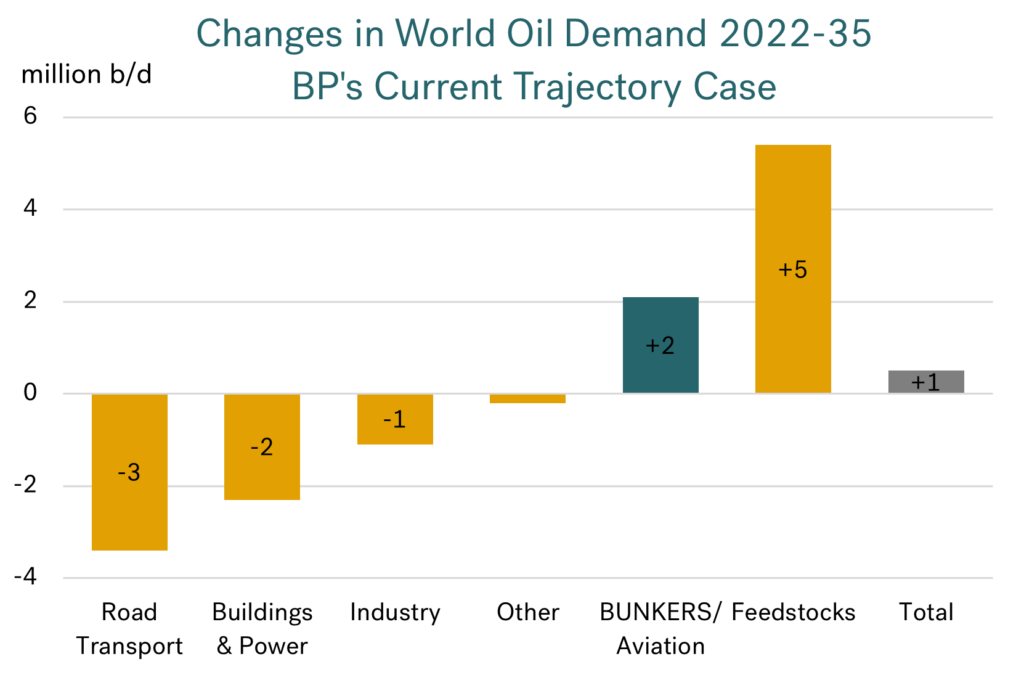
Even with very little change in the overall size of the oil market through to 2035 under the ‘current trajectory’ case, the refining industry must still adapt. The graph below highlights the shifts in demand for different sectors:
- moving away from gasoline, diesel, and gasoil; the products in decline because of electrification in road transport, buildings and industry;
- and towards the growth markets, including bunkers and aviation, but especially into lighter end products as feedstocks into the petchem industries.
 Source: BP
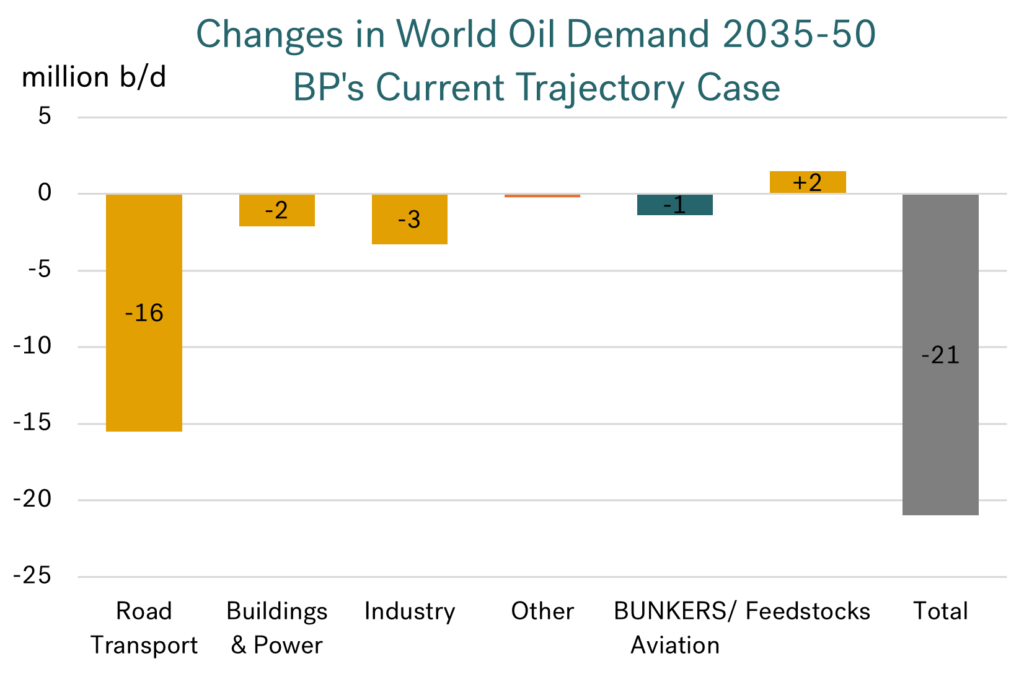
What about in the much longer term?
In this same BP case, the significant changes in the size of the oil industry and the balance in products takes place after 2035. The more rapid moves away from gasoline, diesel, and gasoil indicate a 20% decline in the size of the oil industry in this 2035-50 period (as opposed to the 1% gain over 2022-35).
Source: BP
Although the scenario shows only a small decline in oil use in bunkers and aviation, this is against significant increases in seaborne and air travel. The pointers are we are moving more towards alternative fuels.
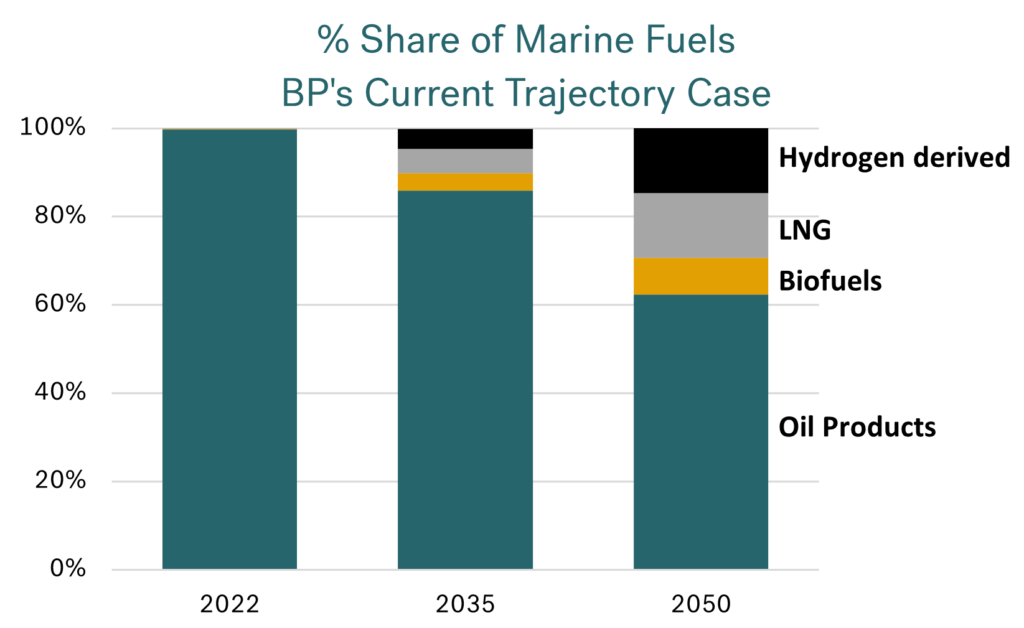
The drive to alternative bunker fuels must continue
The current discussions, investments, and technologies in alternative fuels for shipping are testament to the future needs for our industry.
BP comment on this and in the next 10 years highlight LNG, biofuels (bio-methanol and biodiesel) and hydrogen derived fuels (ammonia and methanol). In their current trajectory case, they see these alternative fuels accounting for around 15% of the bunker market in 2035, BUT reaching close to 40% of the market by 2050.
 Source: BP
For a 40% share of the bunker market by 2050 an enormous amount of work has to be done in low carbon shipping, especially considering the lead times in the industry.
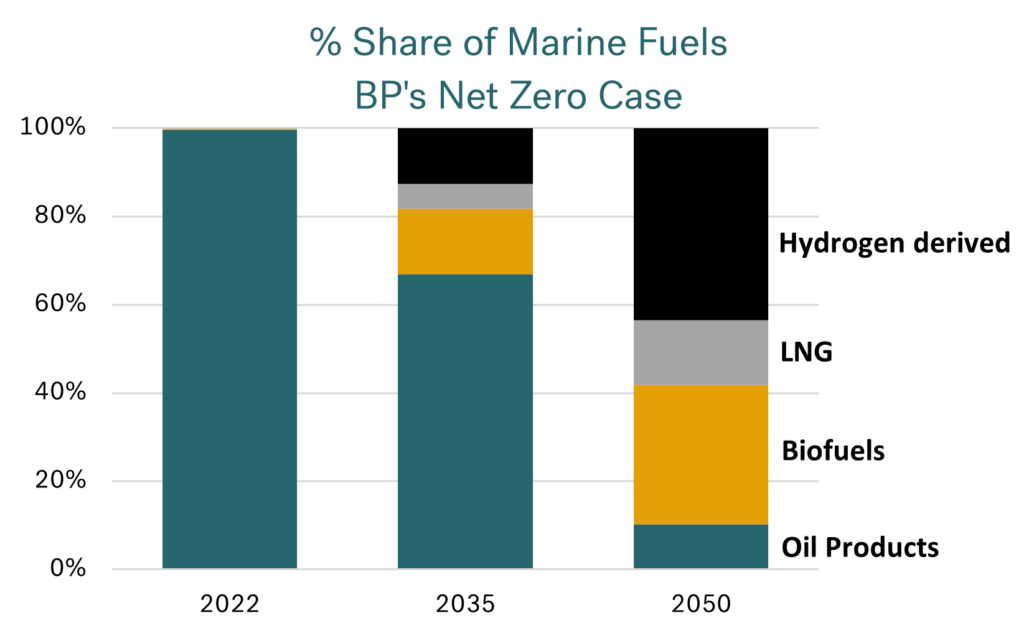
What about the net zero case, whenever it may happen?
An even more radical approach must be adopted if ‘net zero’ is to be met, even if the target or achievement is after 2050. In their net zero case, BP put oil products at only 10% of the bunker market. The growth in LNG is also constrained in this case, again as it is a fossil fuel.
In a decarbonised world there would have to be a strong drive into biofuels and hydrogen derived fuels to achieve the ‘net zero’ balance.
 Source: BP
As we are currently seeing in the wind and solar power sectors, we need high volumes and lower costs in hydrogen derived fuels to make low carbon shipping possible.
No big changes in the bunker market in the next 10 years, but that doesn’t mean we can do nothing!
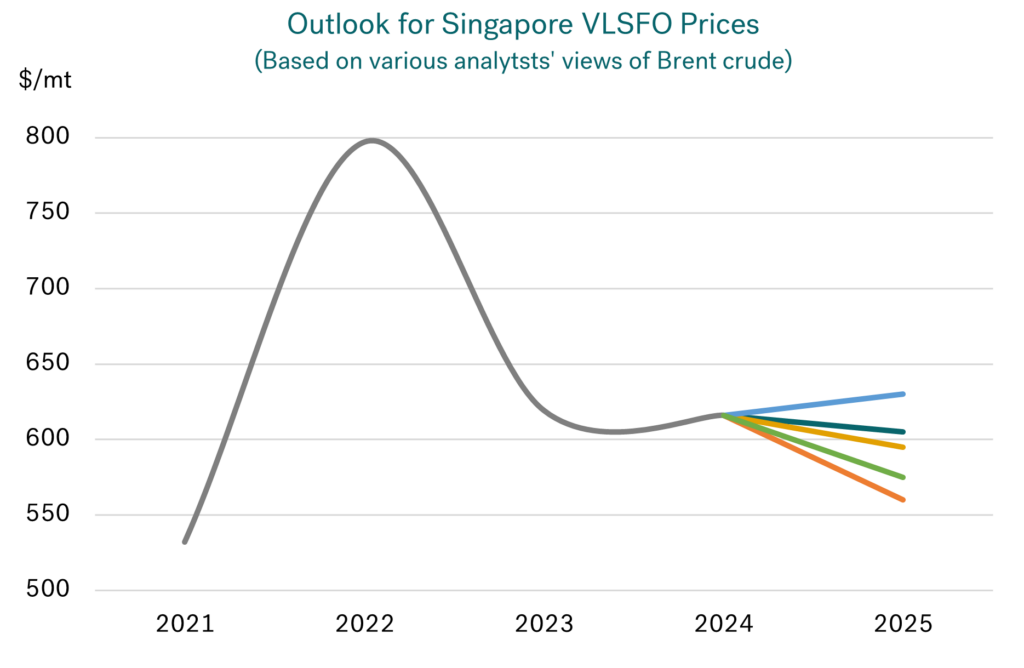
In general terms, a number of analysts are still indicating oil demand rising through the next 10 years or so, and pushing the point of peak oil demand to around the mid-2030s. In fact, Goldman Sachs Research has just put out an article along these lines, with peak demand another decade away and then plateauing around this level for another few years (i.e. not falling until the late 2030s).
So, it seems oil is going to be the key supplier to the bunker market for at least the next 10 years or so. This could instil a degree of complacency, but given political direction, public sentiment and impacts on the oil industry outside the bunker sector, it is only a question of time when ‘alternative fuels’ dominate our business, even if it is post 2050.
Given the lead times and the technological advances needed, it is clear we have to continue to drive our industry forward along a low carbon path.
Steve Christy
Research Contributor
E: steve.christy@integr8fuels.com

Speculators are buying;
it looks like prices are going up!
June 26, 2024
View this article as a PDF » We are at a turning point; oil prices are rising We have highlighted some major bearish factors over the past few months, such as weak prospects for oil demand growth and the huge challenges facing OPEC+ for them to… Read More
We are at a turning point; oil prices are rising
We have highlighted some major bearish factors over the past few months, such as weak prospects for oil demand growth and the huge challenges facing OPEC+ for them to even maintain oil prices. Prices had been tracking these developments, and in early June VLSFO fell to its lowest in almost
a year.
Though, looking at the graph below, things have taken a massive change in the past couple of weeks. The market has turned, and we should look to higher prices in the near-term; momentum today is definitely bullish.
 Source: Integr8 Fuels
Look at the changes in speculative positions in the market!
The ability for money to easily flow into and out of oil futures markets means shifts in price direction and price volatility can be extreme. This often comes from inflows and outflows of ‘speculative’ money. This is now generally termed as ‘managed money’, coming from hedge funds, pension funds and trading activities etc, and the players here can be very big! For the purposes of this report, we refer to this as ‘speculative’.
We are in one of these extremes right now, with a major reversal in ‘speculative’ funds taking place.
It doesn’t take much to link oil price direction and market volatility to shifts in the net position taken by traders/hedge funds etc. Of course, there are endless discussions about what drives what, and ultimately there must be ‘good’ reasons why players take a certain position. However, once the market ‘gets going’ there can be a period of self-fulfilling prophecy!
These dynamics are shown in the graph below, using data published by the US Commodity Futures Trading Commission (CFTC). It illustrates the net position taken by ‘speculators’ in US crude futures and options markets, and compares this with Brent front month futures price.
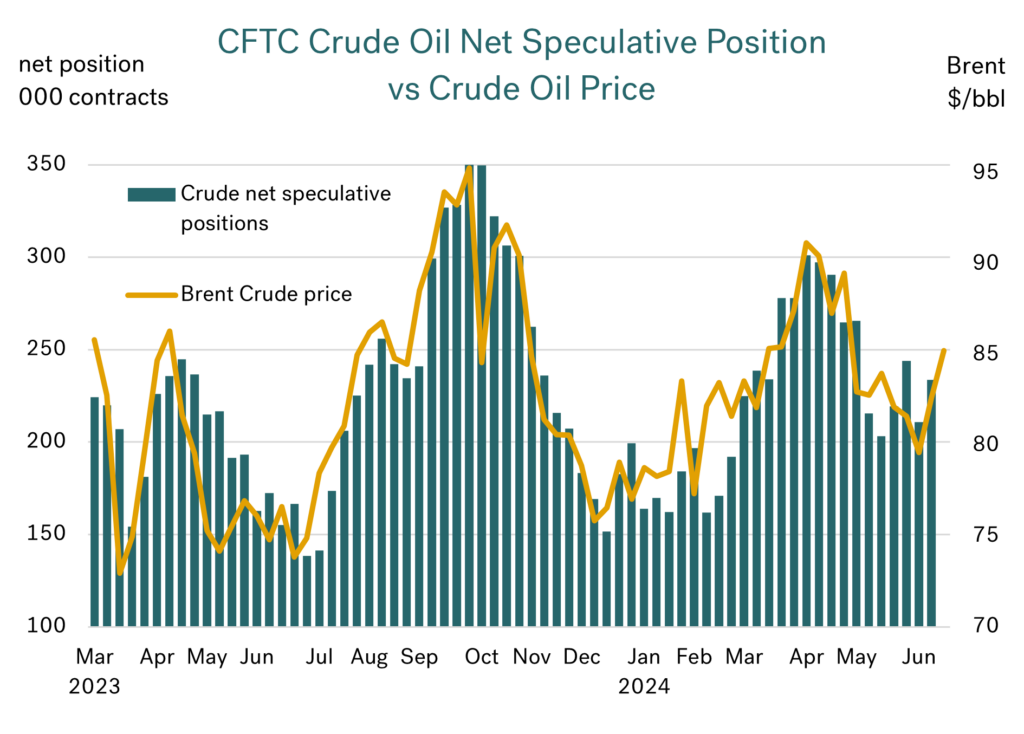 Source: Integr8 Fuels
When speculators increase their net long positions, oil prices rise; when they reduce their net long positions, prices fall. From late April through to early June (even after the OPEC+ meeting), speculators were unloading their net long positions, and crude prices fell by more than $10/bbl. Hence the comparable $80/mt fall in VLSFO prices!
But we have now seen a reversal. Speculators are now buying back into the market and oil prices are up from their lows. Consequently, bunker prices are also moving higher.
Getting more granular on the speculators’ position
In these reports we often delve a bit deeper into the detail behind oil demand and price. In this case it is worth looking in greater detail on how the net speculative position is determined. In doing this we have to go down to the absolute number of long positions and short positions taken by these players. This will give us a greater understanding of what is driving the net position and just how
far things have changed. What it will show is that we could be at the start of a large-scale buying spree coming from ‘managed money’, and if so, this would push prices higher over the coming weeks/months.
Digging into this detail, the graph below illustrates a breakdown of the ‘speculative’ positions taken in the ICE Brent crude market. It highlights the number of long positions, the number of short positions, and then the resulting net position held by speculators. From this it can be seen that outright long positions are the driving force behind this part of the speculative market. However, the recent rise and fall in short positions can cause a ‘double whammy’ in price movements.
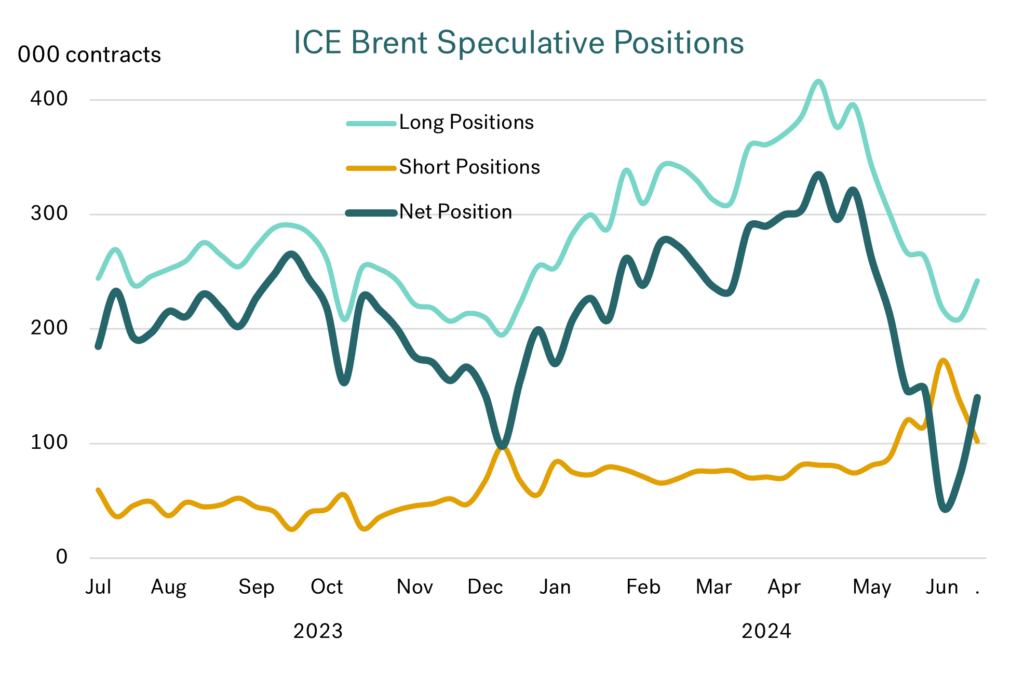 Source: Integr8 Fuels
Price rise to late April backed by extreme speculative length
Looking at developments this year, oil prices had been on an uptrend from the start of the year through to late April, with speculators here collectively doubling their long crude positions to a peak of over 400,000 contracts (equivalent to 400 million bbls) and its highest level since 2020. At the same time the speculative short position remained more-or-less flat, at around 75,000 contracts.
Price fall led by speculators going from one extreme to another
The price drop we have highlighted since end April was extreme and did involve a twist. Not only did the speculators unwind their extreme length, but they also collectively increased their short positions to the highest level since early 2020 and the start of the pandemic. The power of these trades could only mean a fall in oil prices.
So, by early June the net speculative position in ICE Brent crude was not only lower than at any time in the past 12 months, but it was also even lower than at the start of the pandemic, and in fact at its lowest since 2014 in this market. This shows the extremes to which the speculative position had fallen, and so just how potentially big the reversal can be!
Prices have just started to rise, but speculators could take them even higher!
So, there has been a speculative reversal over the past two weeks, moving away from the extreme low position in early June. Prices have risen with this; Brent is up $7/bbl and VLSFO up $30-40/mt. But speculators have only just started unwinding their short positions and buying back length; it looks like there is a lot more to go!
So, for the time being, any bearish talk on weak oil demand, more non-OPEC+ oil or low refinery margins is likely to be significantly outweighed by the bullish price sentiment from traders/hedge funds etc ‘re-balancing’ their exceptionally low speculative positions. In fact, there is already an impetus in some news stories backing this up. Pointers to a bullish European diesel market, stronger summer gasoil demand in the northern hemisphere and declining stock levels over the coming months are some topics being discussed.
So, perhaps forget any bearish fundamental stories for a while and hang on to the coat-tails of the trading community in a rising market?
Steve Christy
Research Contributor
E: steve.christy@integr8fuels.com