
It is worth looking beyond the bunker market for price direction
August 26, 2022
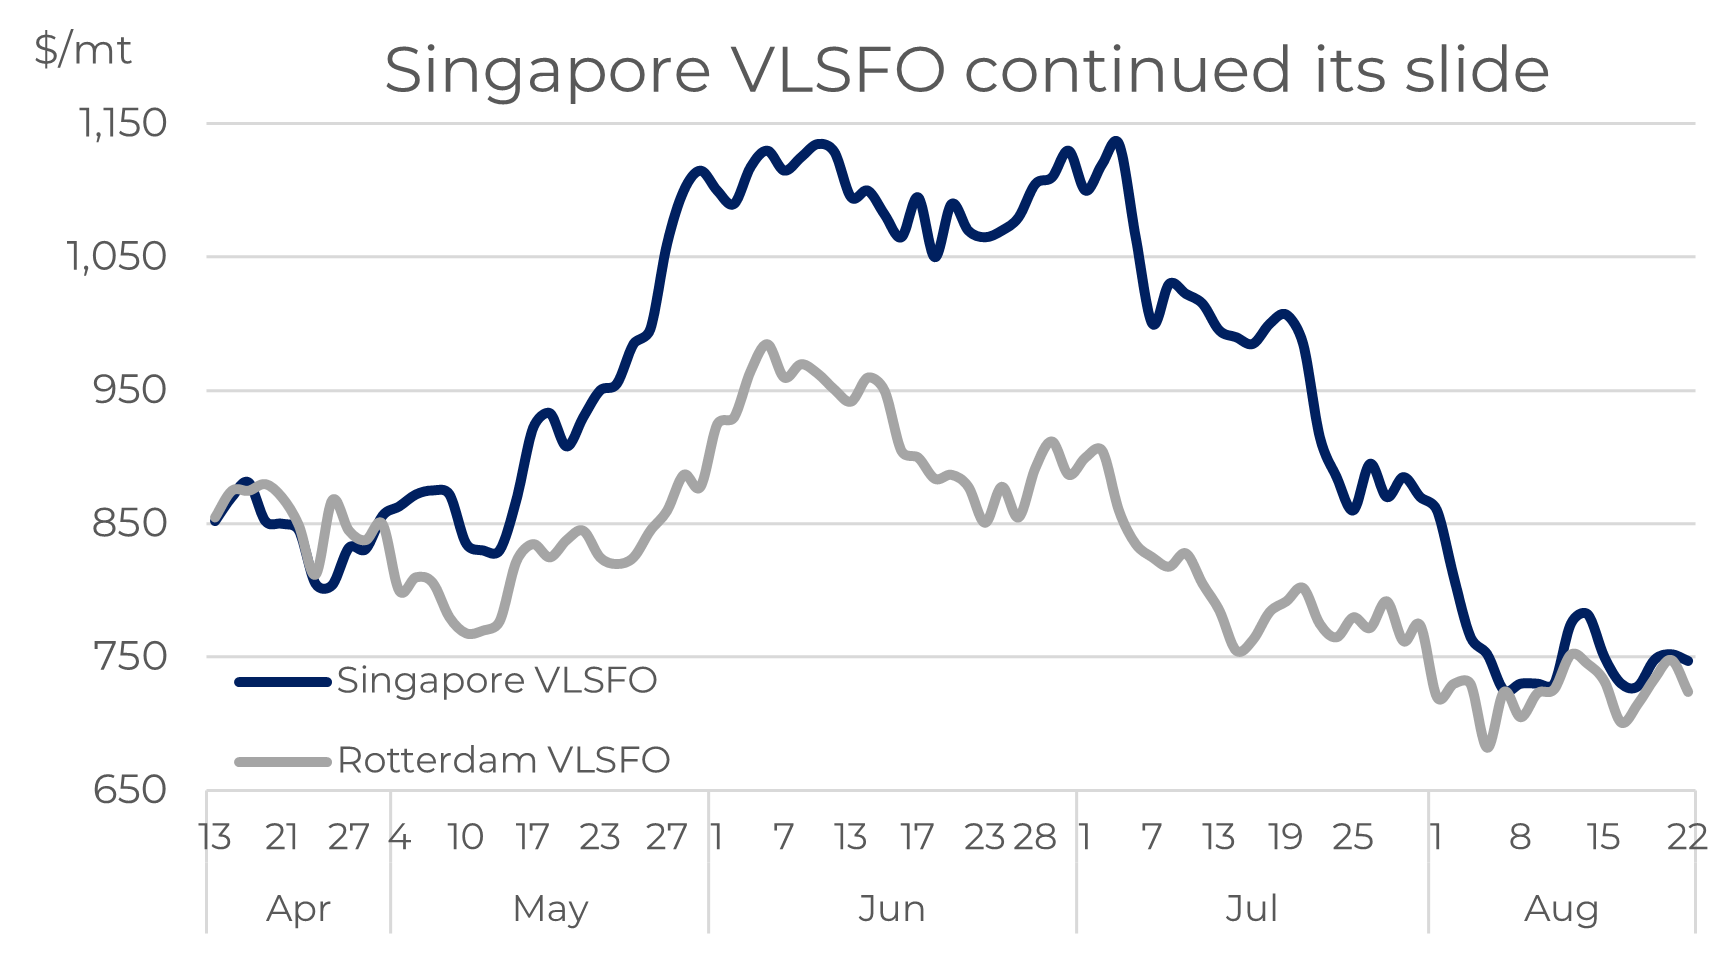
VLSFO prices have continued to slide, but the outlook is very murky
VLSFO prices in Singapore are down even further to around $750/mt and also back in line with prices elsewhere, such as in Rotterdam. But when you look for a steer on the price outlook, the picture becomes pretty murky... Read More
VLSFO prices have continued to slide, but the outlook is very murky
VLSFO prices in Singapore are down even further to around $750/mt and also back in line with prices elsewhere, such as in Rotterdam. But when you look for a steer on the price outlook, the picture becomes pretty murky.
Source: Integr8 Fuels
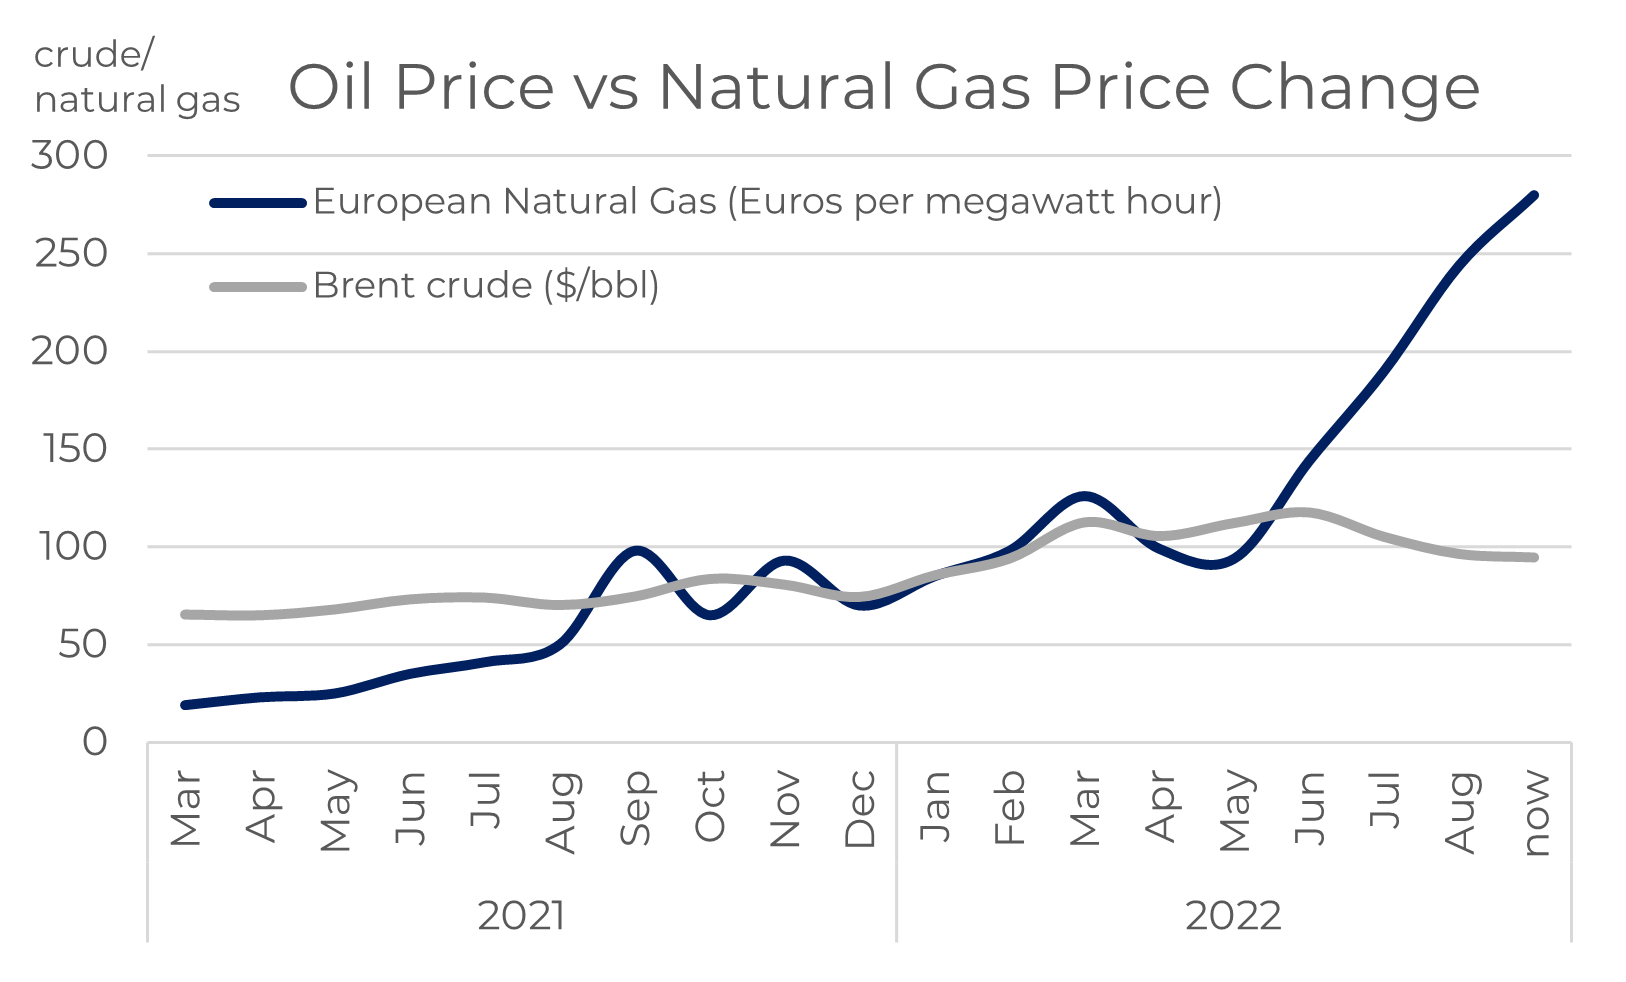
Everyone is looking at sky-high natural gas prices
This is one of those occasions when it is worth looking at the much bigger picture beyond bunkers and even beyond the oil industry, and at the moment there is a huge focus on natural gas from governments, industry and consumers.
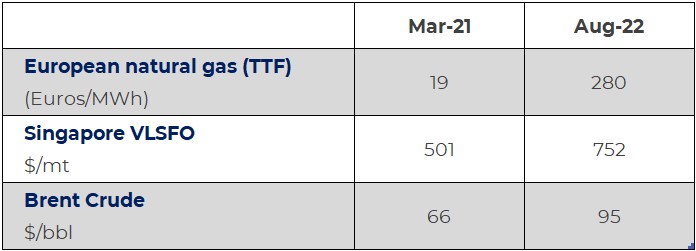
To put this in context, current Brent crude oil prices are around 45% higher than 18 months ago; Singapore VLSFO is slightly higher, at 50% more, but the benchmark European natural gas price (TTF) is 1,500% more! We have seen what we believe as huge volatility in bunker prices, but this is nothing compared to what is happening in natural gas markets.
 Source: Integr8 Fuels
 Source: Integr8 Fuels
This is one of the political fallouts from the Russian invasion of Ukraine, and has created a nervousness around many commodity markets and prices, but especially natural gas. Russia supplies around 40% of Europe’s gas needs and so Europe has a direct vulnerability. In late July Russia said it would limit natural gas supplies to Europe, which led to a price surge and then just a few days ago Russia announced an unscheduled 3-day shutdown of the main gas pipeline from Russia into Europe (Nord Stream 1) and European natural gas prices went up a further 20%.
But this isn’t just a European issue; with Europe taking increasing volumes of US LNG supplies, this leaves less for other international markets, and so the supply and price impact is global.
Across the board, energy costs are significantly higher and a major contributor to inflationary pressures, but natural gas is something else and it is no surprise that this is having a devastating impact on government policy, industrial costs and consumer concerns and responses.
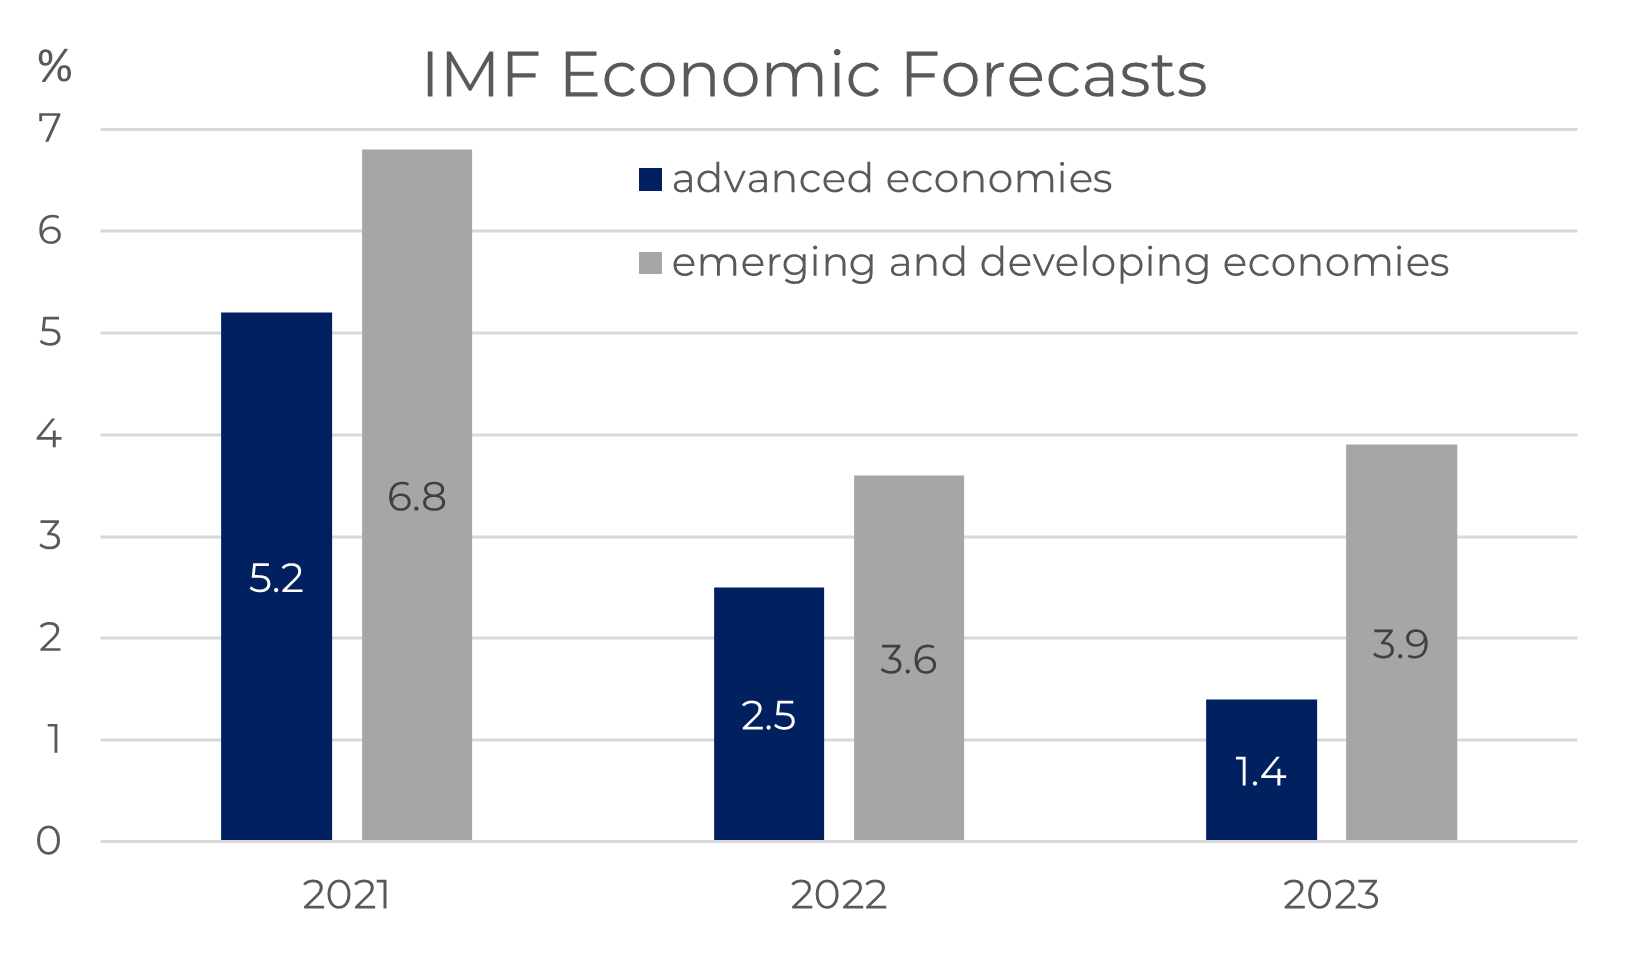
The economic fallout suggests lower oil & bunker prices
The economic threat from these high energy prices is well documented, with all the major economic forecasters tending to raise their projections for inflation and interest rates and revise down their projections for growth. At the same time, they are saying there are still major risks to the downside. The latest projections from the IMF show the declining position and the most extreme pressures on the advanced economies of Europe and the US.
Source: Integr8 Fuels
There is already a major effect, with crude and oil product prices down and Singapore VLSFO prices dropping by $250/mt over the past month.
On the one hand these pressures would typically lead to weaker global oil demand and potentially even lower bunker prices. However, this may not be the case.
No easy sign of a steep rise in oil production to take prices lower
OPEC has re-affirmed its position that it is not going to hike oil production, with the new secretary-general (from Kuwait) making public statements that current high prices are because of external influences and that OPEC is already “doing its part”.
The latest EIA forecast for US crude production shows output going up by 0.9 million b/d over the next 12 months, but this is a gradual and relatively modest rise in the global context. There are also questions about the ability to source labour and equipment in the shale oil sector to support this rise. So, there is no quick fix from higher US production.
The one possibility for a production hike is if there is a successful conclusion to the US/Iranian nuclear deal and a lifting of Iranian sanctions. Oil prices will fall on the news and we could see a subsequent increase in crude output of around 1 million b/d over 6 months or so. There is often talk of an agreement on the horizon, but this is one where we just have to wait and see.
Therefore, without an Iranian deal, it is unlikely that we will see a sudden surge in crude production, which would lead to a further drop in oil and bunker prices, at least on a short-term basis.
We may think oil demand will be weaker, but no!
The other aspect that could reduce oil and bunker prices is weaker growth in oil demand. The bottom line for most consumers in current circumstances is to attempt to limit consumption. In the oil industry all the economic pointers would suggest consumer responses to use less oil, and signs are already there about people driving less because of the hike in gasoline prices. BUT despite this, the IEA has just raised its forecast growth in global oil demand by 0.4 million b/d for this year. This is because with natural gas prices at such high levels, industries are looking to switch from natural gas to oil where possible.
Although nowadays there is not a huge ability for commercial, industrial or power companies to switch from natural gas to oil, at the margin this does have an impact, and in winter the developments are likely to be even more pronounced.
Some European industries are already moving towards heating oil as a replacement for natural gas and in the northern hemisphere winter we can expect higher demand for fuel oil into the power generation sector, especially in some Asian countries. Current forward curves would indicate these conditions continuing through to end 2023 (although forward curves can change quickly).
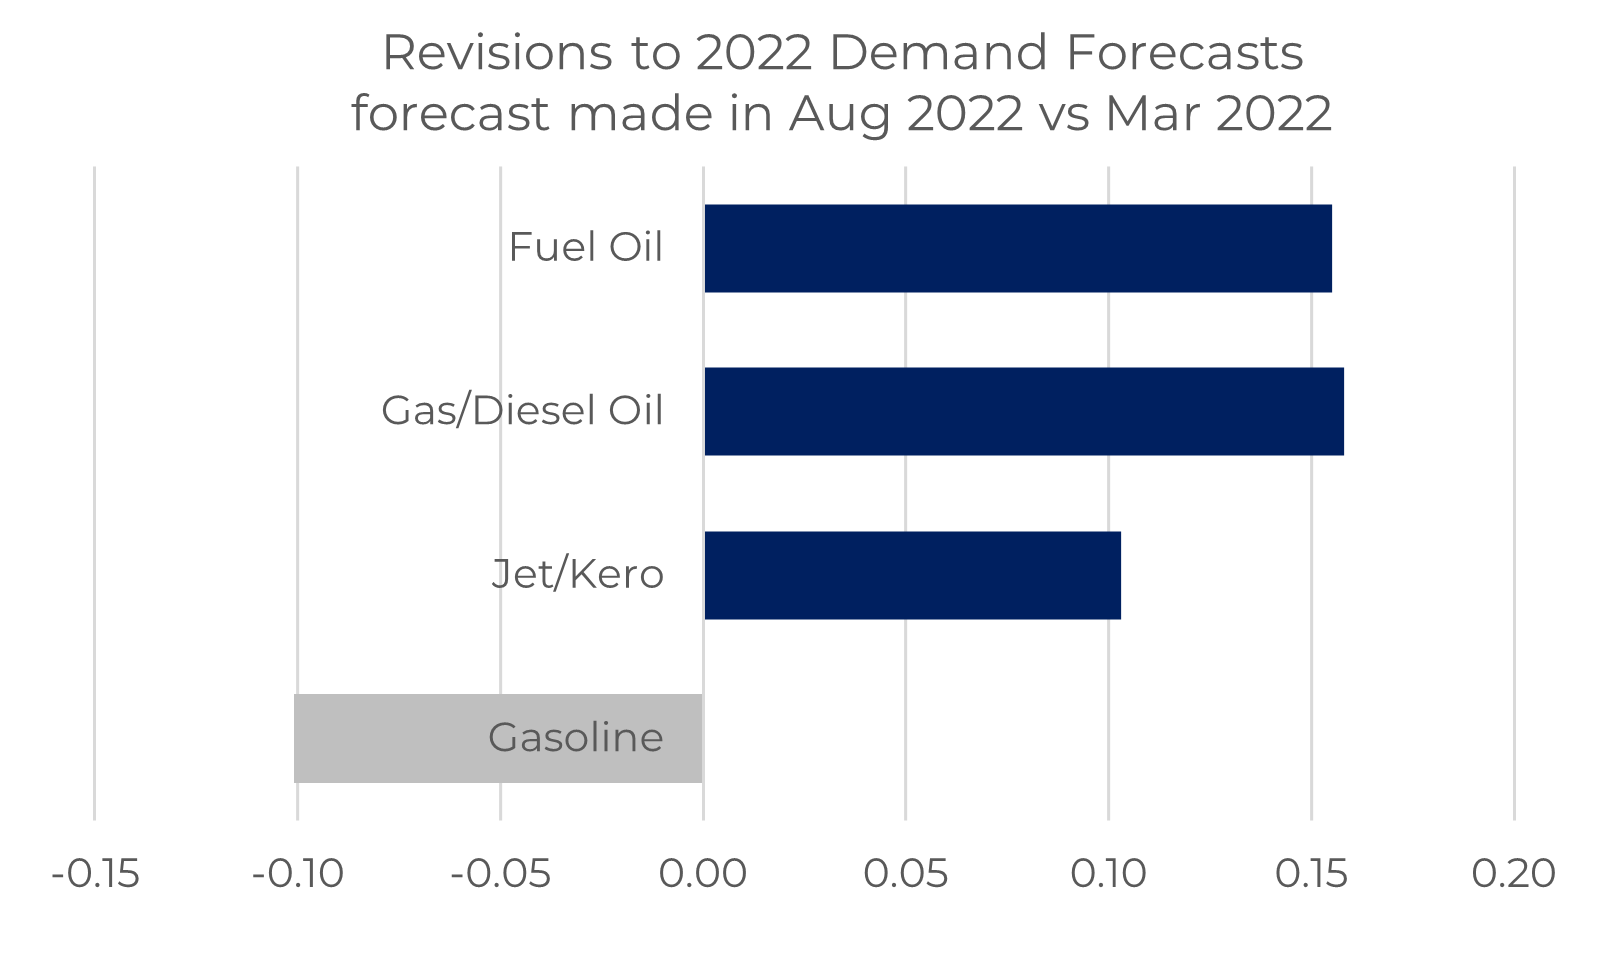
On the back of exceptionally high natural gas prices and the switching process, the IEA has raised its forecast demand for fuel oil this year by 150,000 b/d and gas/diesel oil by 160,000 b/d since their March outlook. At the same time, they have raised their outlook for jet demand on increased air travel and downgraded their views on gasoline demand in response to higher prices.
Source: Integr8 Fuels
High natural gas prices mean a support to bunker prices
Extra oil demand from this switching is split around 50:50 between heating oil and fuel oil and so likely to prop up bunker prices; additional heating oil demand will have an indirect impact on VLSFO availabilities and pricing, and additional fuel oil into power generation will have a direct impact on the HSFO market.
Therefore, in the near term there appears to be conflicting issues surrounding oil and bunker price direction, with ‘conventional’ demand forecasts under downwards threat, but demand from switching from natural gas to oil potentially outweighing this and lifting oil demand forecasts.
In conclusion, a lot of the headline news may suggest bunker prices falling, but when you scratch below the surface it may not be so obvious.
Given all of this, Russian natural gas exports to Europe could be something to watch as a price indicator for bunkers.
Steve Christy, Research Contributor
E: steve.christy@integr8fuels.com

What is the best indicator for bunker price direction?
August 2, 2022
VLSFO prices finally fall – down $270/mt in Singapore
After almost 2 months of Singapore VLSFO prices being above $1,000/mt, we have finally seen an easing in the market. There have been two sharp price drops this month and Singapore VLSFO is now back to around $860/mt; still historically high, but at least similar to levels in early May... Read More
VLSFO prices finally fall – down $270/mt in Singapore
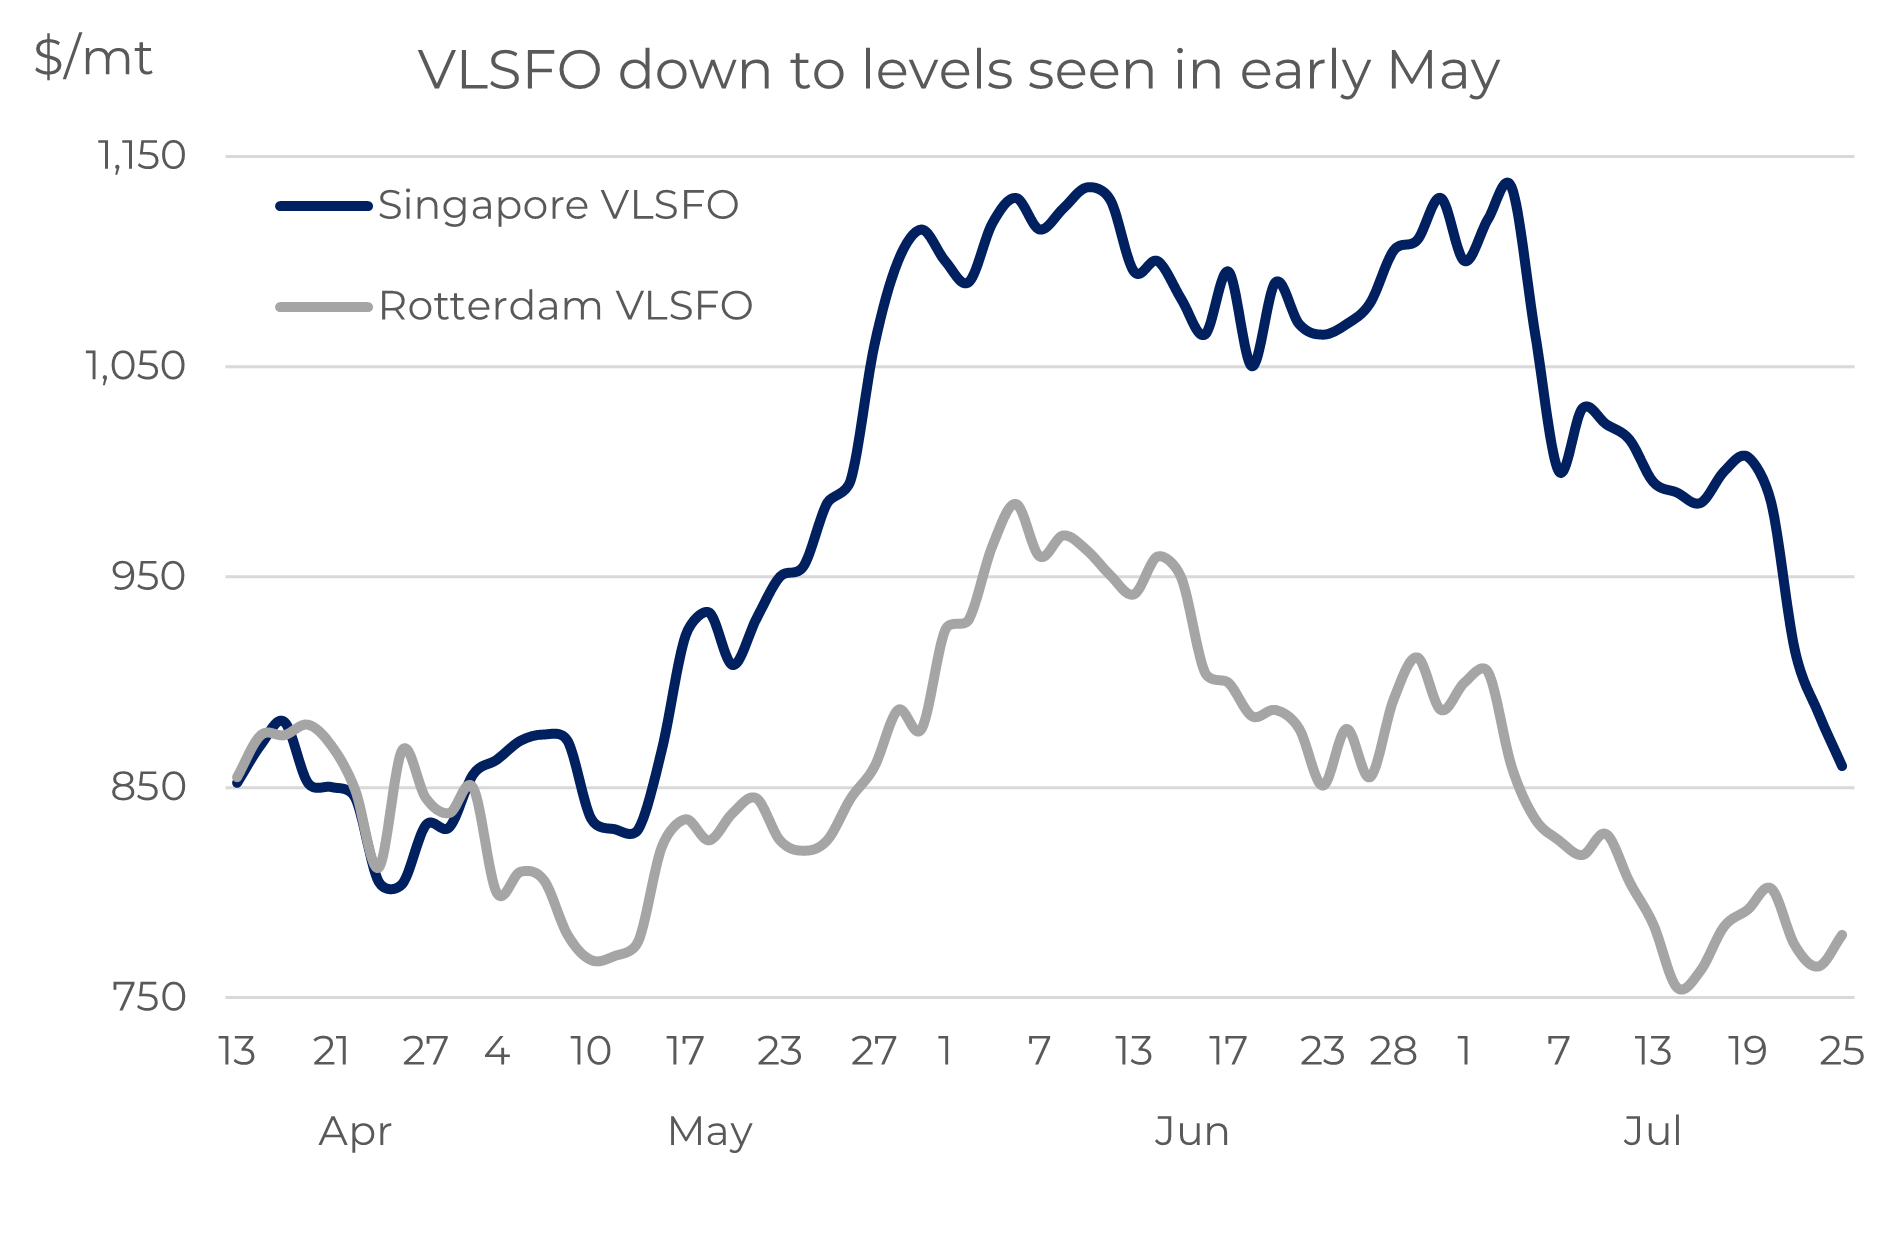
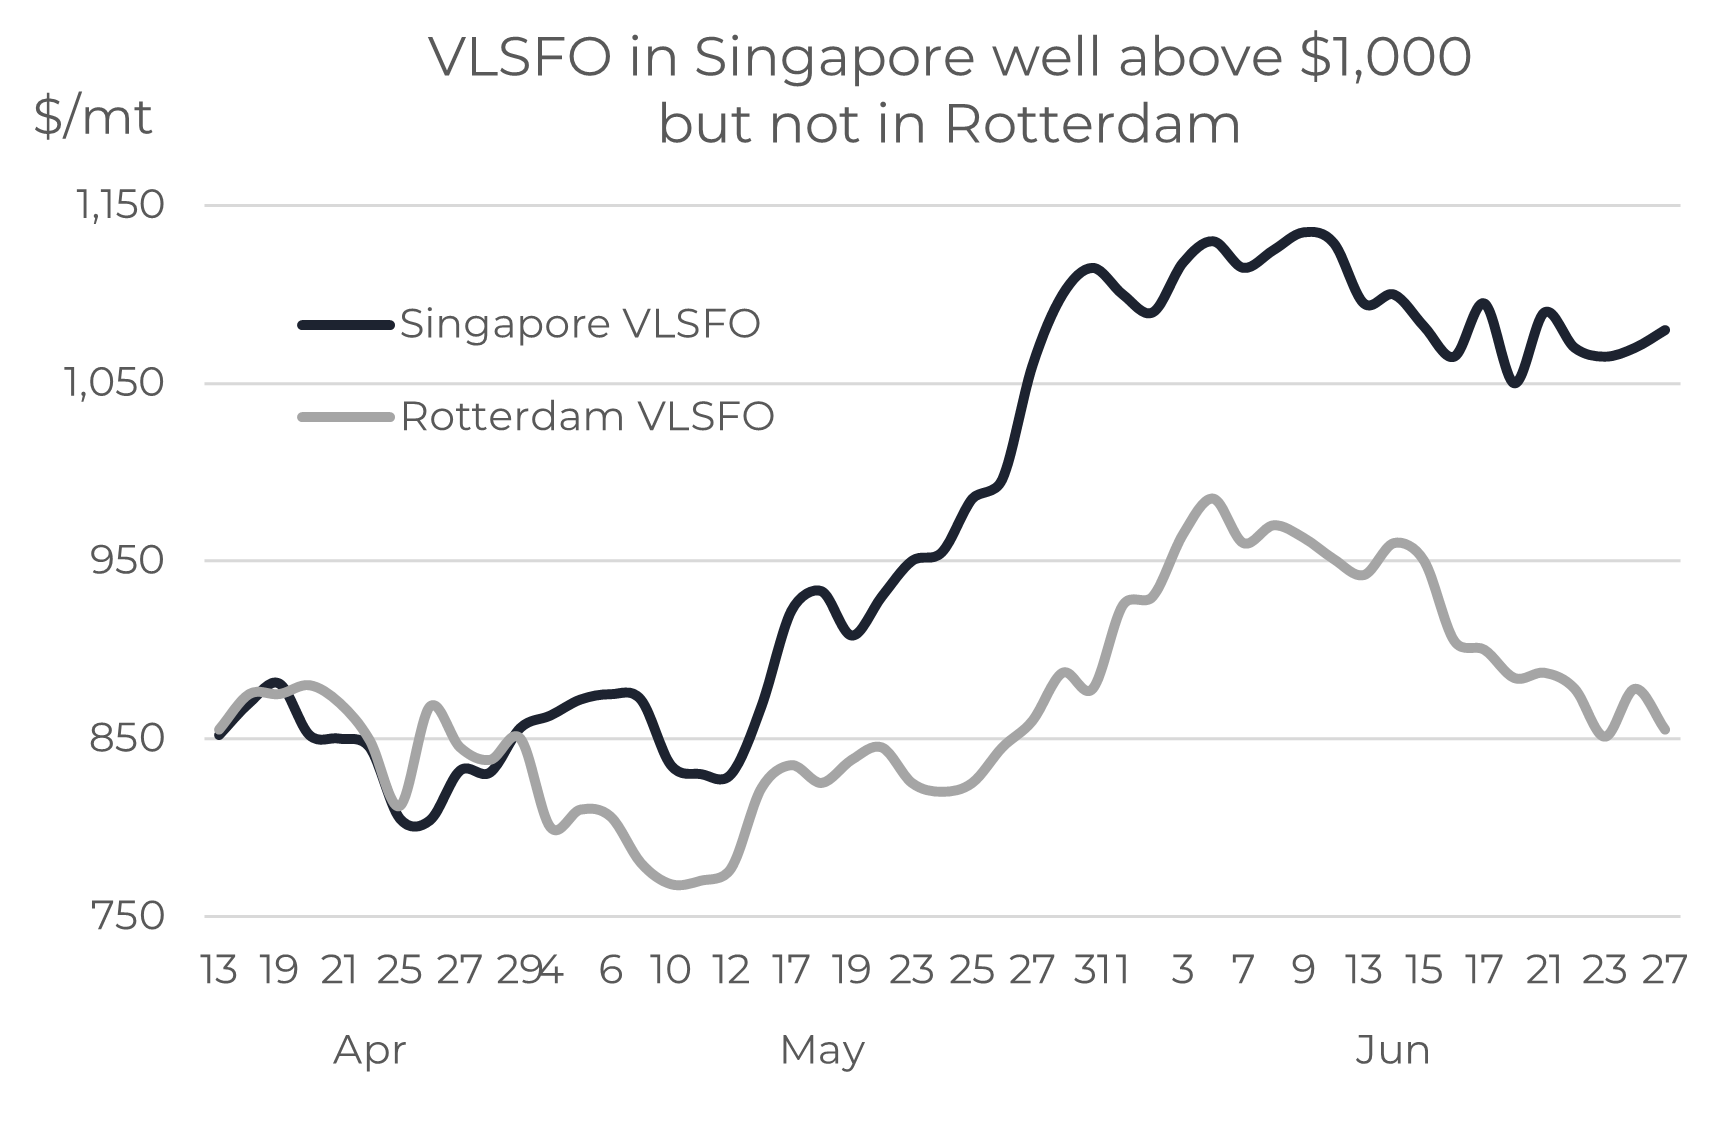
After almost 2 months of Singapore VLSFO prices being above $1,000/mt, we have finally seen an easing in the market. There have been two sharp price drops this month and Singapore VLSFO is now back to around $860/mt; still historically high, but at least similar to levels in early May.
Source: Integr8 Fuels
VLSFO prices have also fallen in Rotterdam, but with prices already significantly lower than Singapore, the drop was not by as much. So far this month Rotterdam prices are down by around $100/mt to $780. It does mean the difference in VLSFO between the two locations has narrowed massively from around $250/mt to $80/mt currently, but this compares with an average differential of only $25/mt last year; there is still a bigger than usual difference between Rotterdam and Singapore VLSFO prices.
Global refinery margins are down massively
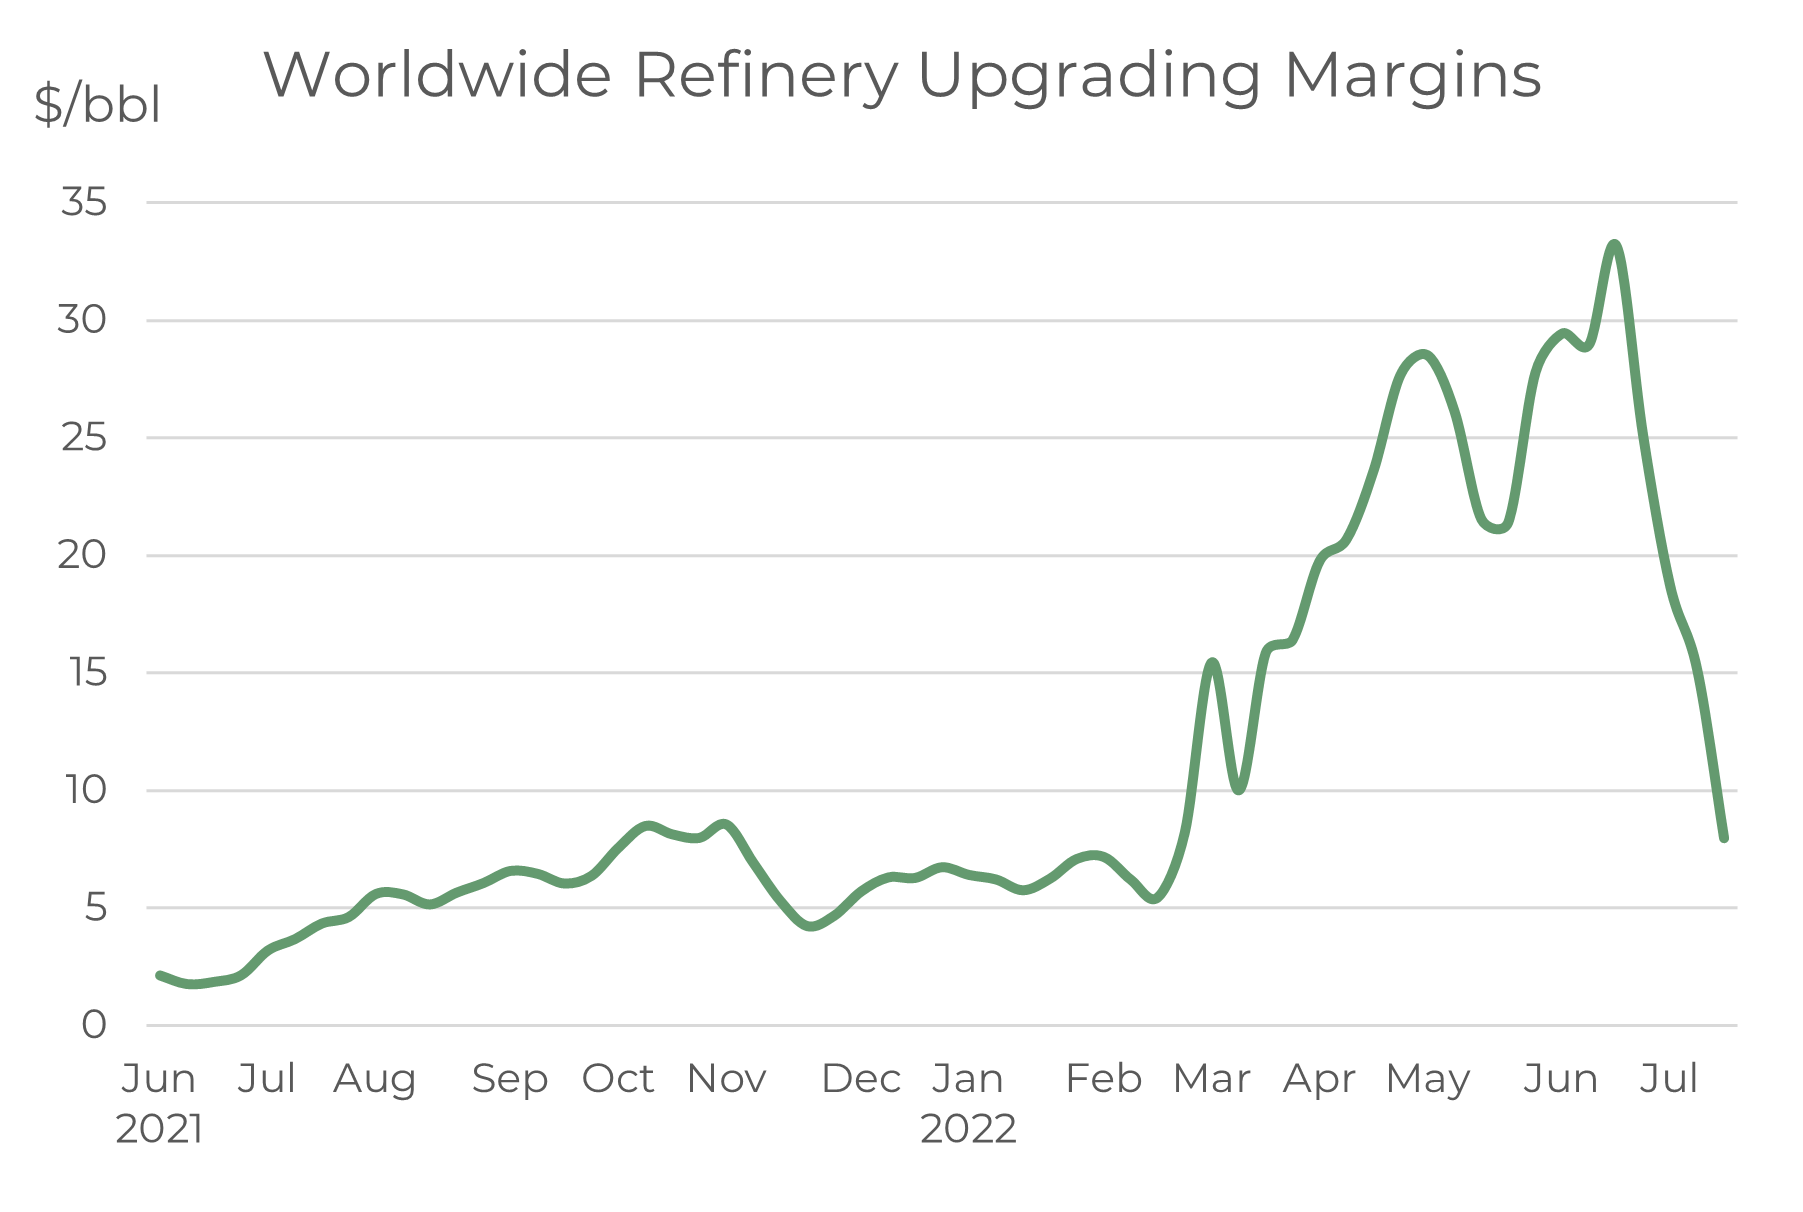
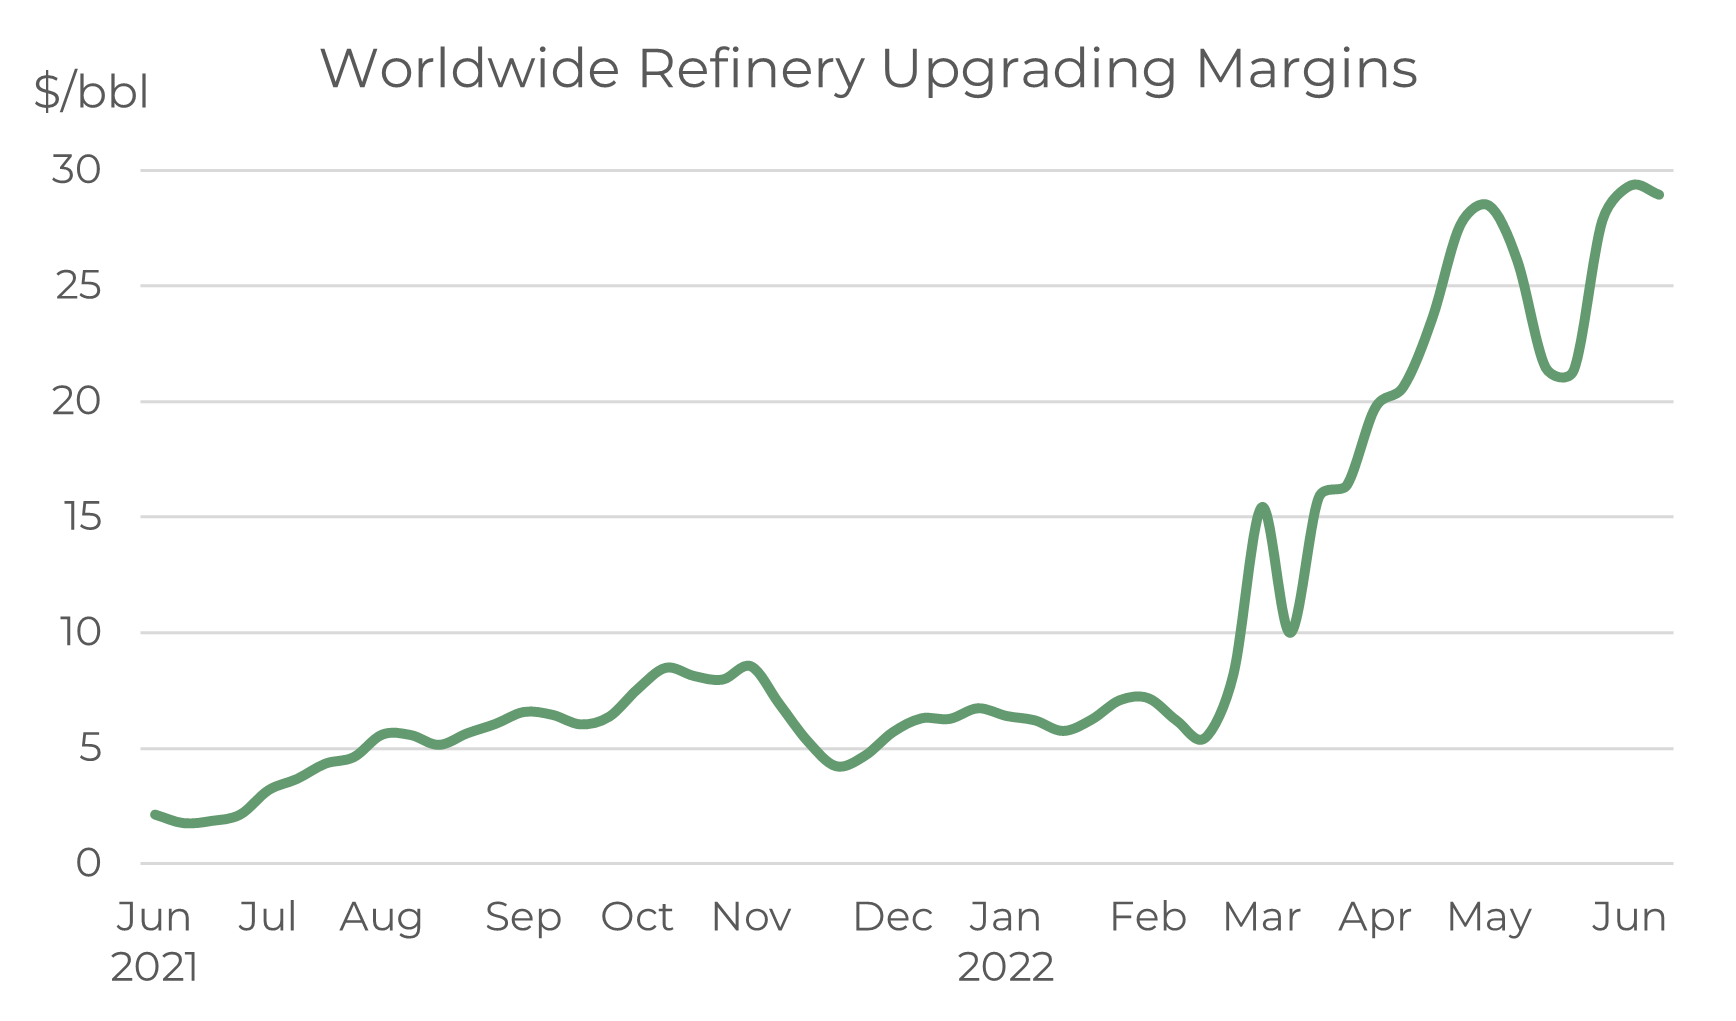
Over the past couple of months, we have focused on refinery margins as a marker of the strength in products markets and ultimately a key indicator for bunker price movements. In May and June refinery margins moved to record highs, driven by extreme tightness in gasoline, diesel and jet markets around the world. However, these margins have collapsed over the past 2-3 weeks, mainly because of far greater weakness in gasoline and diesel markets in most parts of the world (jet margins are lower but the falls have not generally been to the same extent).
 Source: Integr8 Fuels
Gasoline in the US has weakened significantly with a loss in demand from $5/gallon prices (high by US standards, but not necessarily in other parts of the world). This in turn has closed the arb on European gasoline moving transatlantic and so eased any tightness in the European market. In Asia, gasoline margins have fallen from record highs to their lowest in the past 12 months, as higher exports from China and Malaysia ease the supply concerns.
VLSFO prices have followed this exact same trend in margins, at a time when crude oil prices have generally been around $105-115/bbl.
The ‘refinery margins indicator’ reflects the heavy support for VLSFO prices in May/June, and clearly demonstrates the diminishing support for VLSFO over the past few weeks. However, with margins moving back towards more historical norms, it is now time to shift focus towards other indicators to get some feel of where bunker prices could go in the near term.
What is the next good indicator for bunker prices?
The concerns about economic threats, inflation, interest rates and even recession have ebbed and flowed. For us looking at short-term oil and bunker prices, these concerns have taken a back seat for the past 2 months; but with support for products and margins easing, talk about economic uncertainty and the negative outlook for oil demand is now likely to re-emerge.
The other ‘big picture’ feature that will affect bunker prices in the short-term is crude oil production and if OPEC+ increase output, as requested by the US.
These two factors cover both sides of the supply/demand fundamentals; possible downwards revisions to oil demand because of a weaker economic outlook and potential increases in crude oil supplies.
Will it be higher oil production that leads to lower bunker prices?
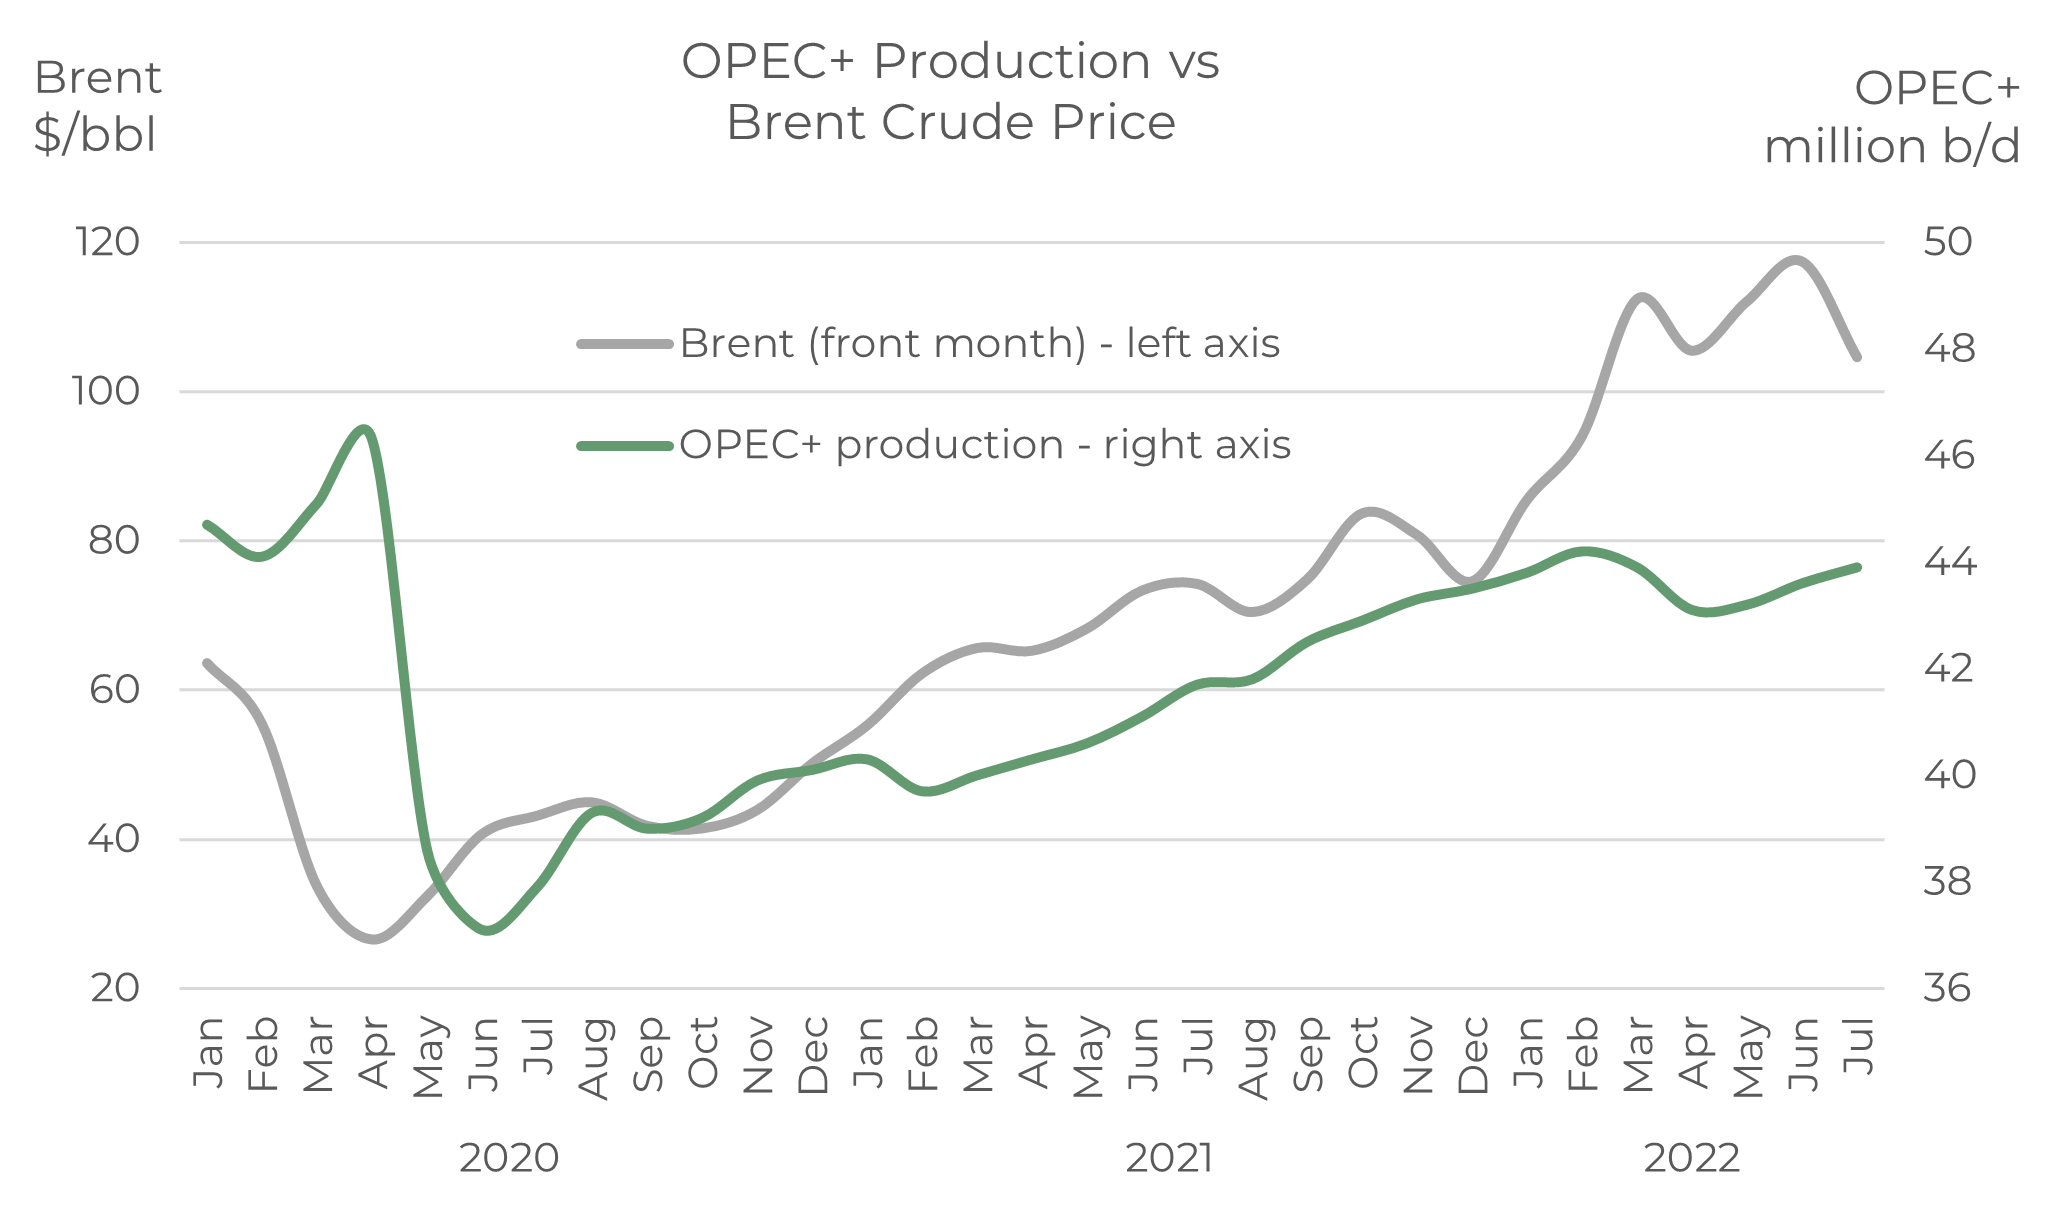
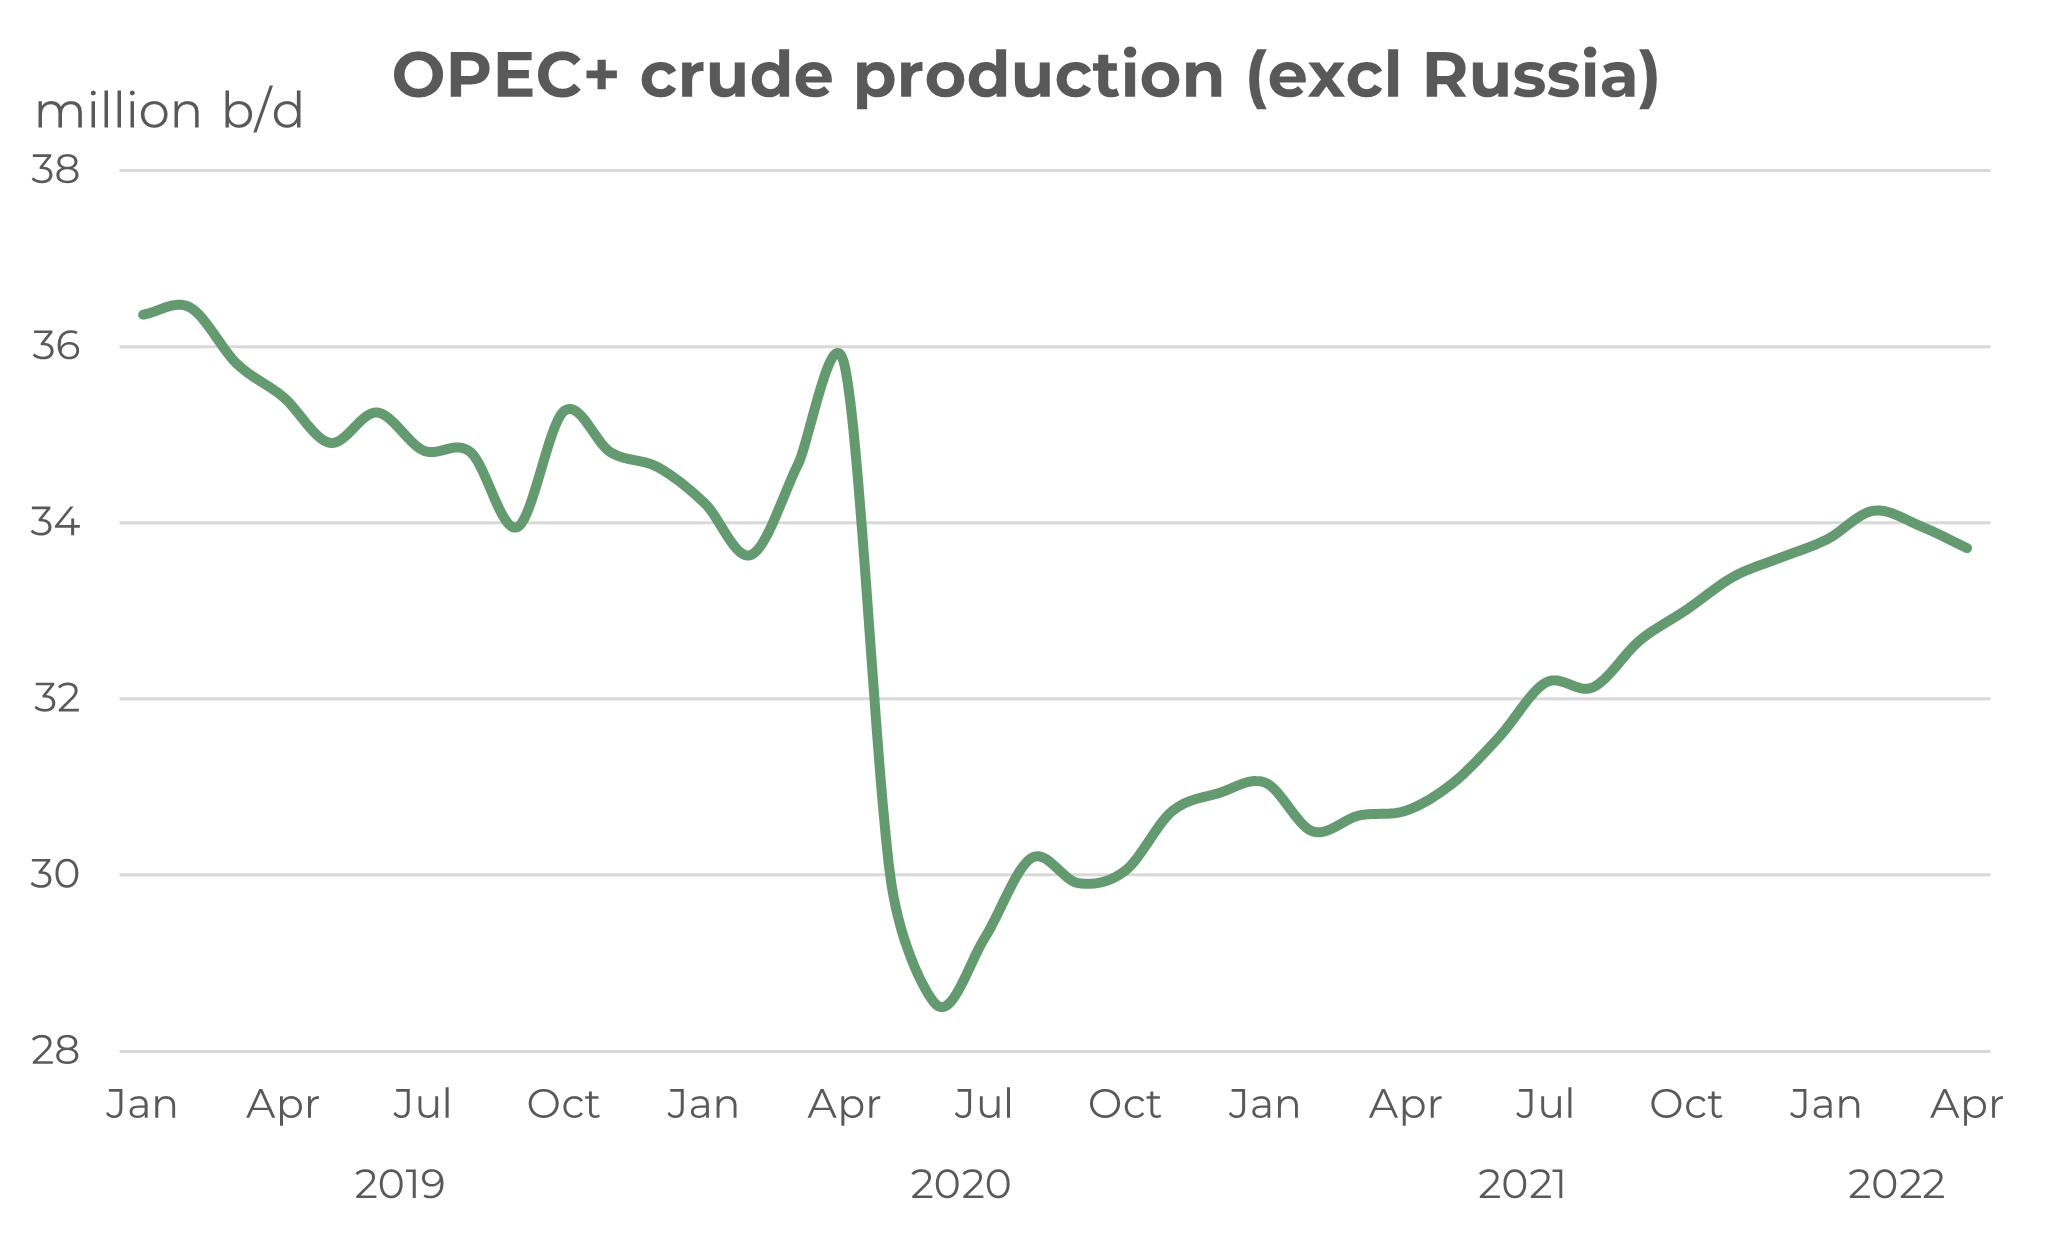
Historically OPEC manages the marginal barrel of oil supply and has generally responded to sharp movements in oil prices; increasing output when prices are ‘too high’ and cutting production when prices are ‘too low’. The extremes of the covid situation clearly show this strategy in the graph below, with Brent prices falling from the low $60s to the low $20s at the start of the pandemic and the expanded group of OPEC+ slashing output by 8 million b/d (almost 20%).
Once the pandemic started to ease, leading to oil demand and prices rising, so OPEC+ raised production back towards earlier levels. This all continued on the ‘usual’ strategy through to earlier this year and just before the invasion of Ukraine.
Source: Integr8 Fuels
However, since the Russian/Ukraine conflict started in February, Brent prices have risen from $85/bbl to around $105-115/bbl and OPEC+ production has not increased at all. There was actually a dip in output in March/April, but this was largely due to the loss of Russian production. However, even excluding Russia, production from the rest of the OPEC+ group has not increased at all since the invasion.
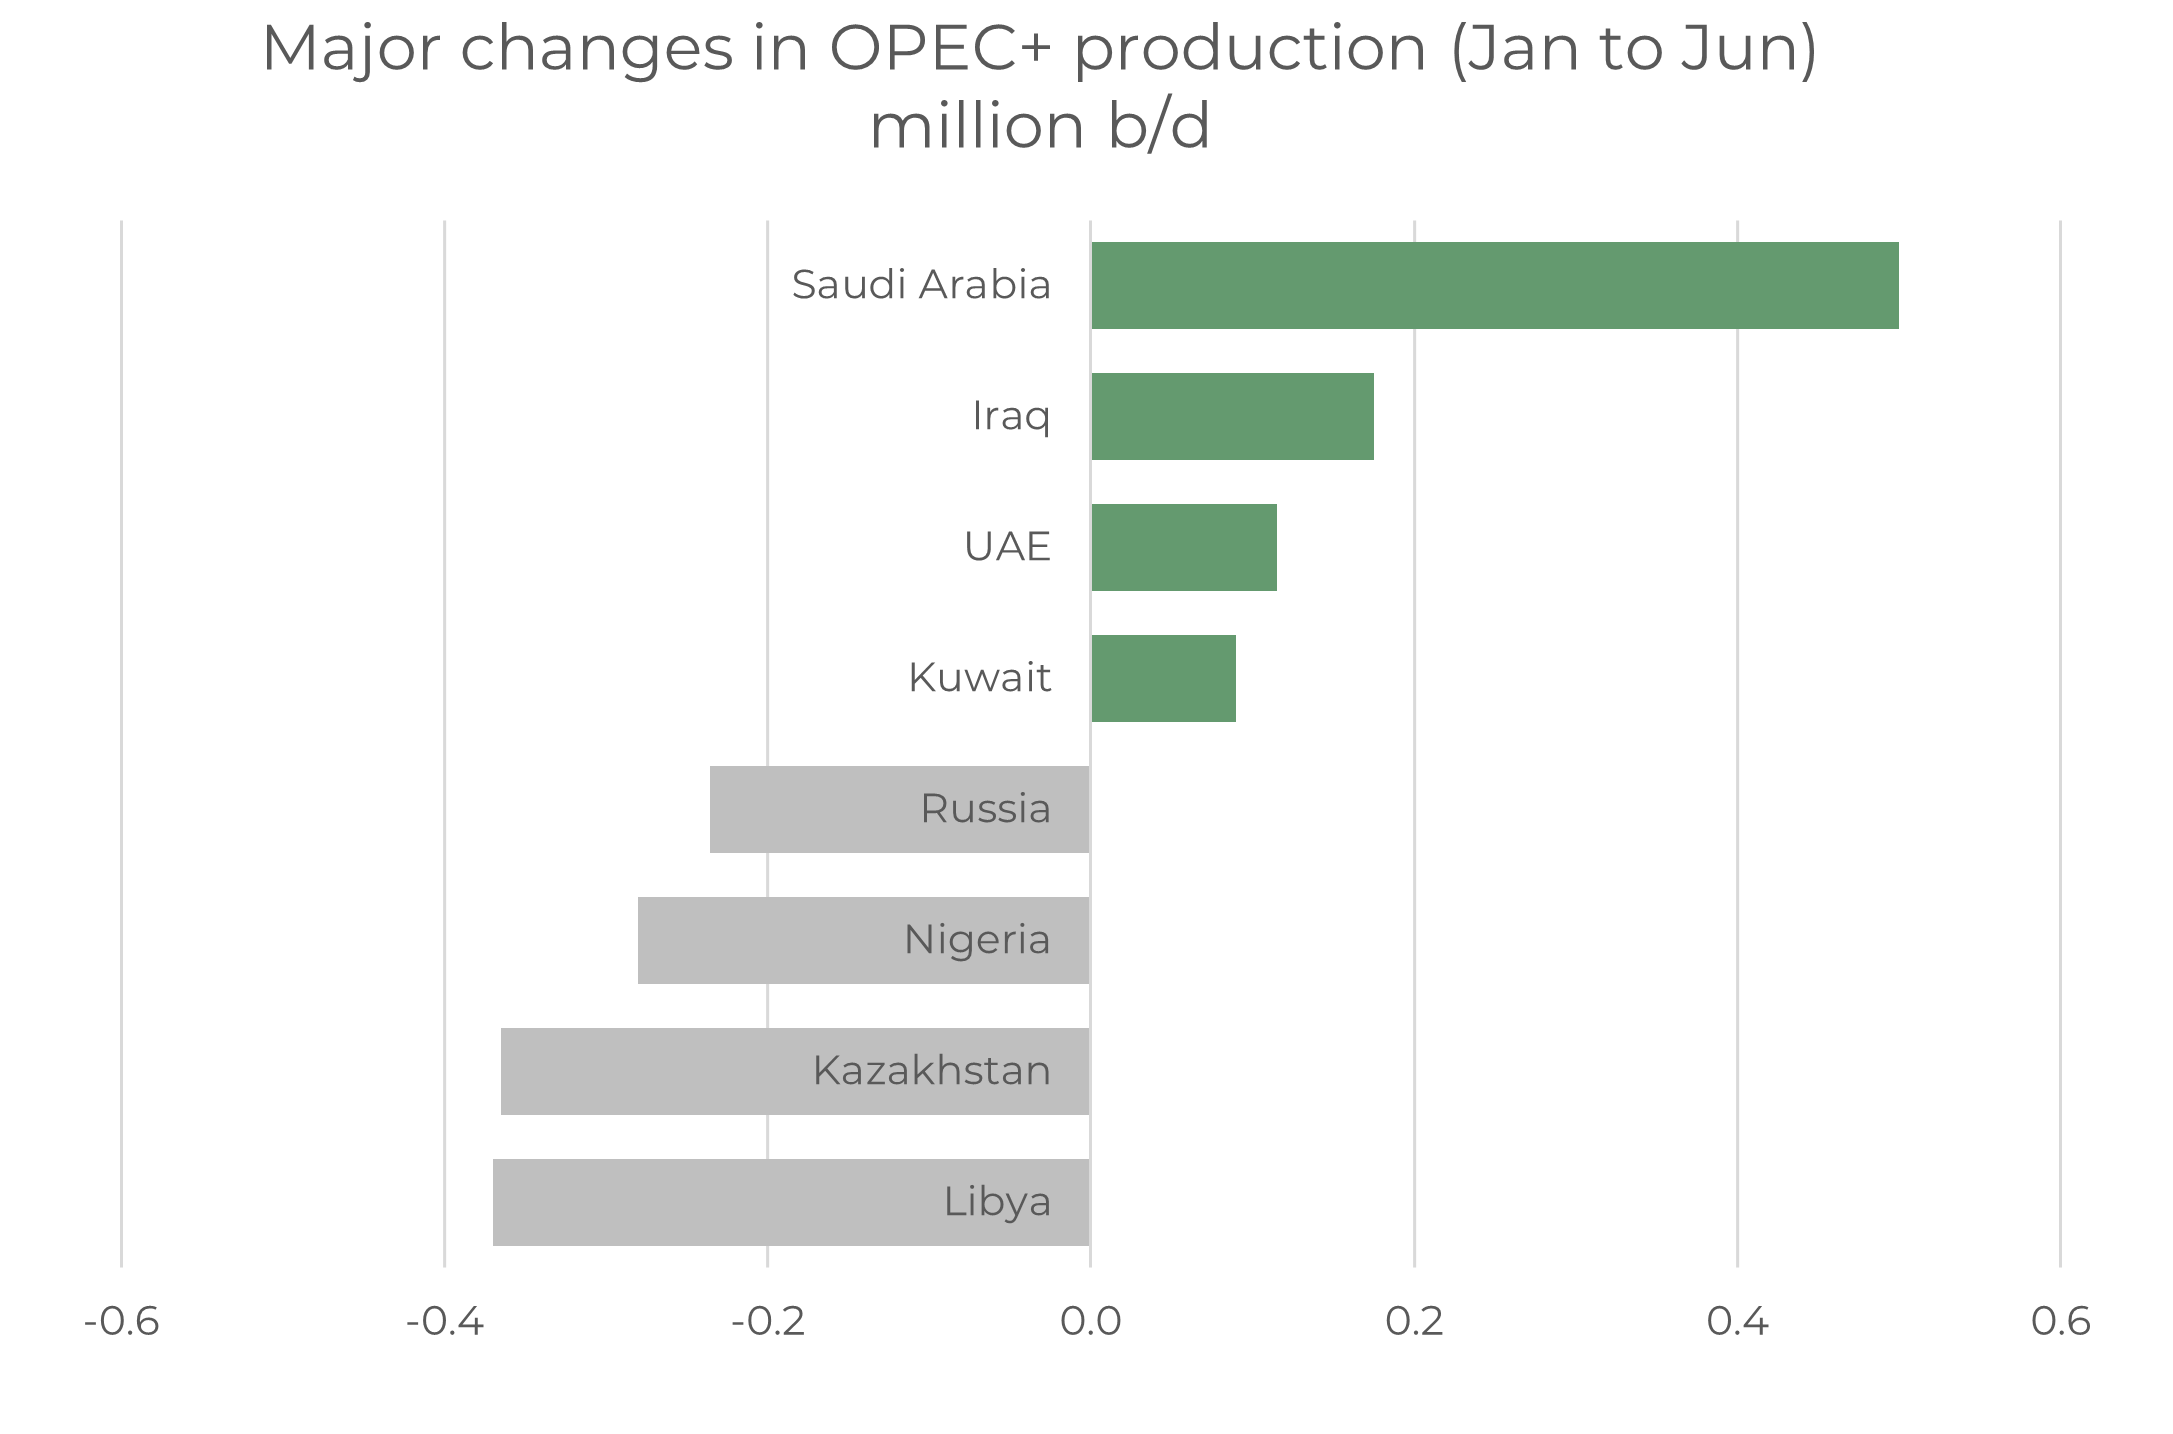
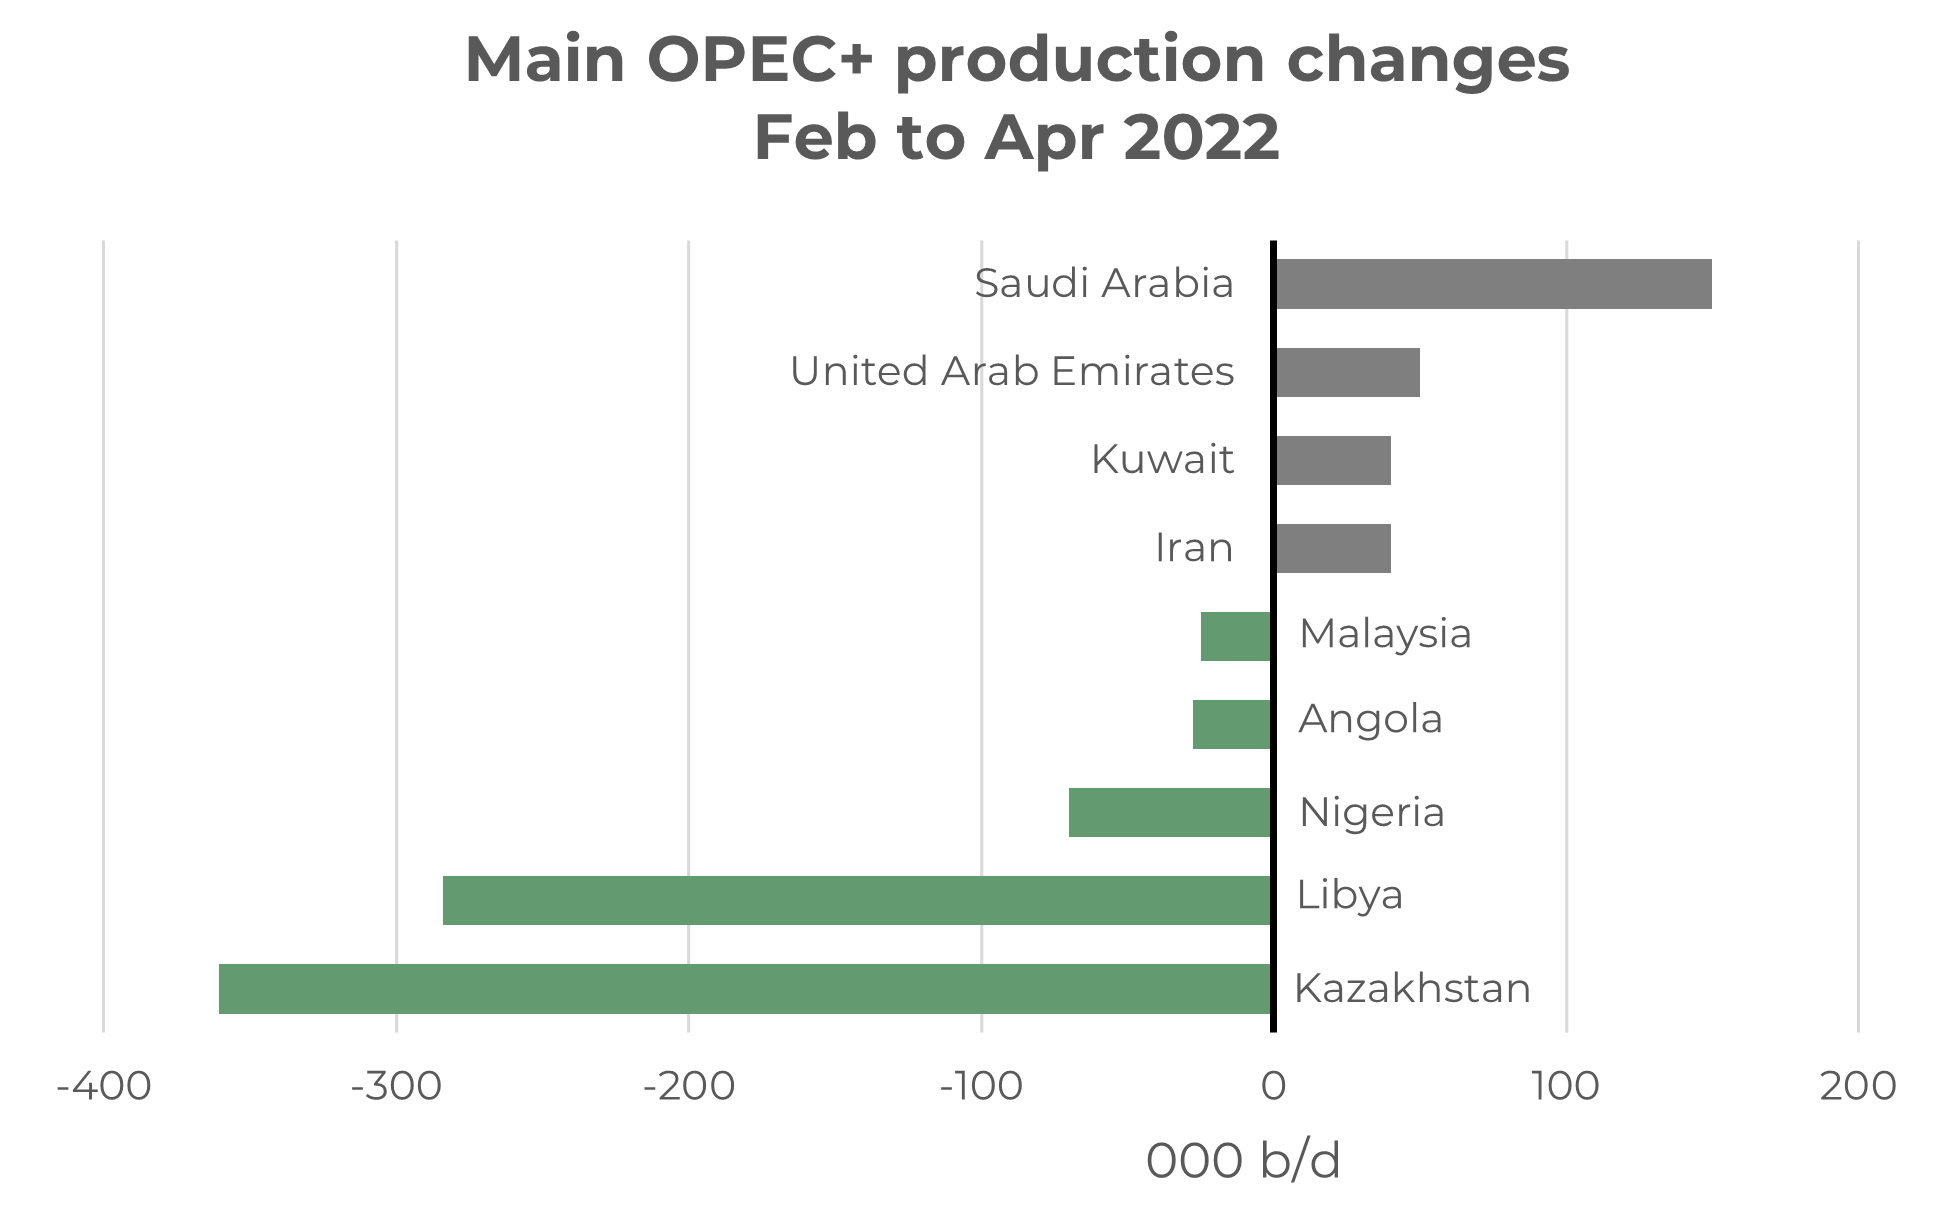
There is a lot going on at a country level within the OPEC+ group. Libyan output is currently around 0.3 million b/d lower than in January because of political tensions and protests, although it looks as though it is now increasing. Kazakhstan crude output is also down by around 0.3 million b/d, with problems surrounding exports passing through Russia and loading at Russian terminals; Kazakh crudes have been renamed in order to ease this. Output from Nigeria has also fallen by 0.3 million b/d.
There are also problems in many OPEC+ countries, where insufficient E&P spending has meant production capacity is below their allocated quotas.
This means most countries in the OPEC+ group do not have the capacity to raise output, even if quotas are increased. It is left to the few OPEC+ countries that do have spare capacity to set the strategy; namely Saudi Arabia, UAE, Kuwait and possibly Iraq. In all of these Saudi Arabia is by far the most influential.
Over recent months these ‘spare capacity’ countries have increased output by around 0.9 million b/d, but this only compensates for losses in output elsewhere within OPEC+.
Source: Integr8 Fuels
So, excluding Russia, current OPEC+ production is the same as it was back in January, and oil prices are some $20-25/bbl higher.
The US has made numerous calls for OPEC+ to raise production in response to prices going above $100/bbl. President Biden even made a trip to Saudi Arabia two weeks ago, but the calls appear to have come up with nothing in terms of a Saudi response to increase output; and it is Saudi Arabia that is likely to be the decision maker for OPEC+ strategy.
Not refinery margins; Not likely oil production. Is it the economy?
So, all the indications are that refinery margins have run their course to historic highs and now back towards historic norms, so these are no longer the most useful indicator for bunker price direction.
In terms of a production increase to reduce oil prices, Saudi Arabia is the linchpin here and the one to watch, but it currently shows no signs of hiking output; there will be increases in US shale production, but these will be gradual.
Outside of this, the next thing to watch is sentiment and direction in the economy. Bearish signals here may be the only thing that takes down oil and bunker prices in the near term. Lower prices are what a lot of people want, but this probably isn’t the best way to get them!
Steve Christy, Research Contributor
E: steve.christy@integr8fuels.com
Download this article as a PDF »

Why are VLSFO prices so high, especially in Singapore?
June 30, 2022
Tightness in products still trumps talks of recession
Last month we wrote about the fears of recession versus the tightness in product markets and that tightness in products was definitely ‘winning’. Another month on and it’s oil products that are again driving VLSFO prices even higher! Recession is often mentioned, with obvious higher energy and food costs, central banks hiking interest rates and economic forecasts being downgraded, but the lack of supply and low levels of stocks for key oil products has the overwhelming focus for most oil industry players at the moment.
Source: Integr8 Fuels Read More
Tightness in products still trumps talks of recession
Last month we wrote about the fears of recession versus the tightness in product markets and that tightness in products was definitely ‘winning’. Another month on and it’s oil products that are again driving VLSFO prices even higher! Recession is often mentioned, with obvious higher energy and food costs, central banks hiking interest rates and economic forecasts being downgraded, but the lack of supply and low levels of stocks for key oil products has the overwhelming focus for most oil industry players at the moment.
Source: Integr8 Fuels
Refinery margins back up to historic highs – it’s a clear signal
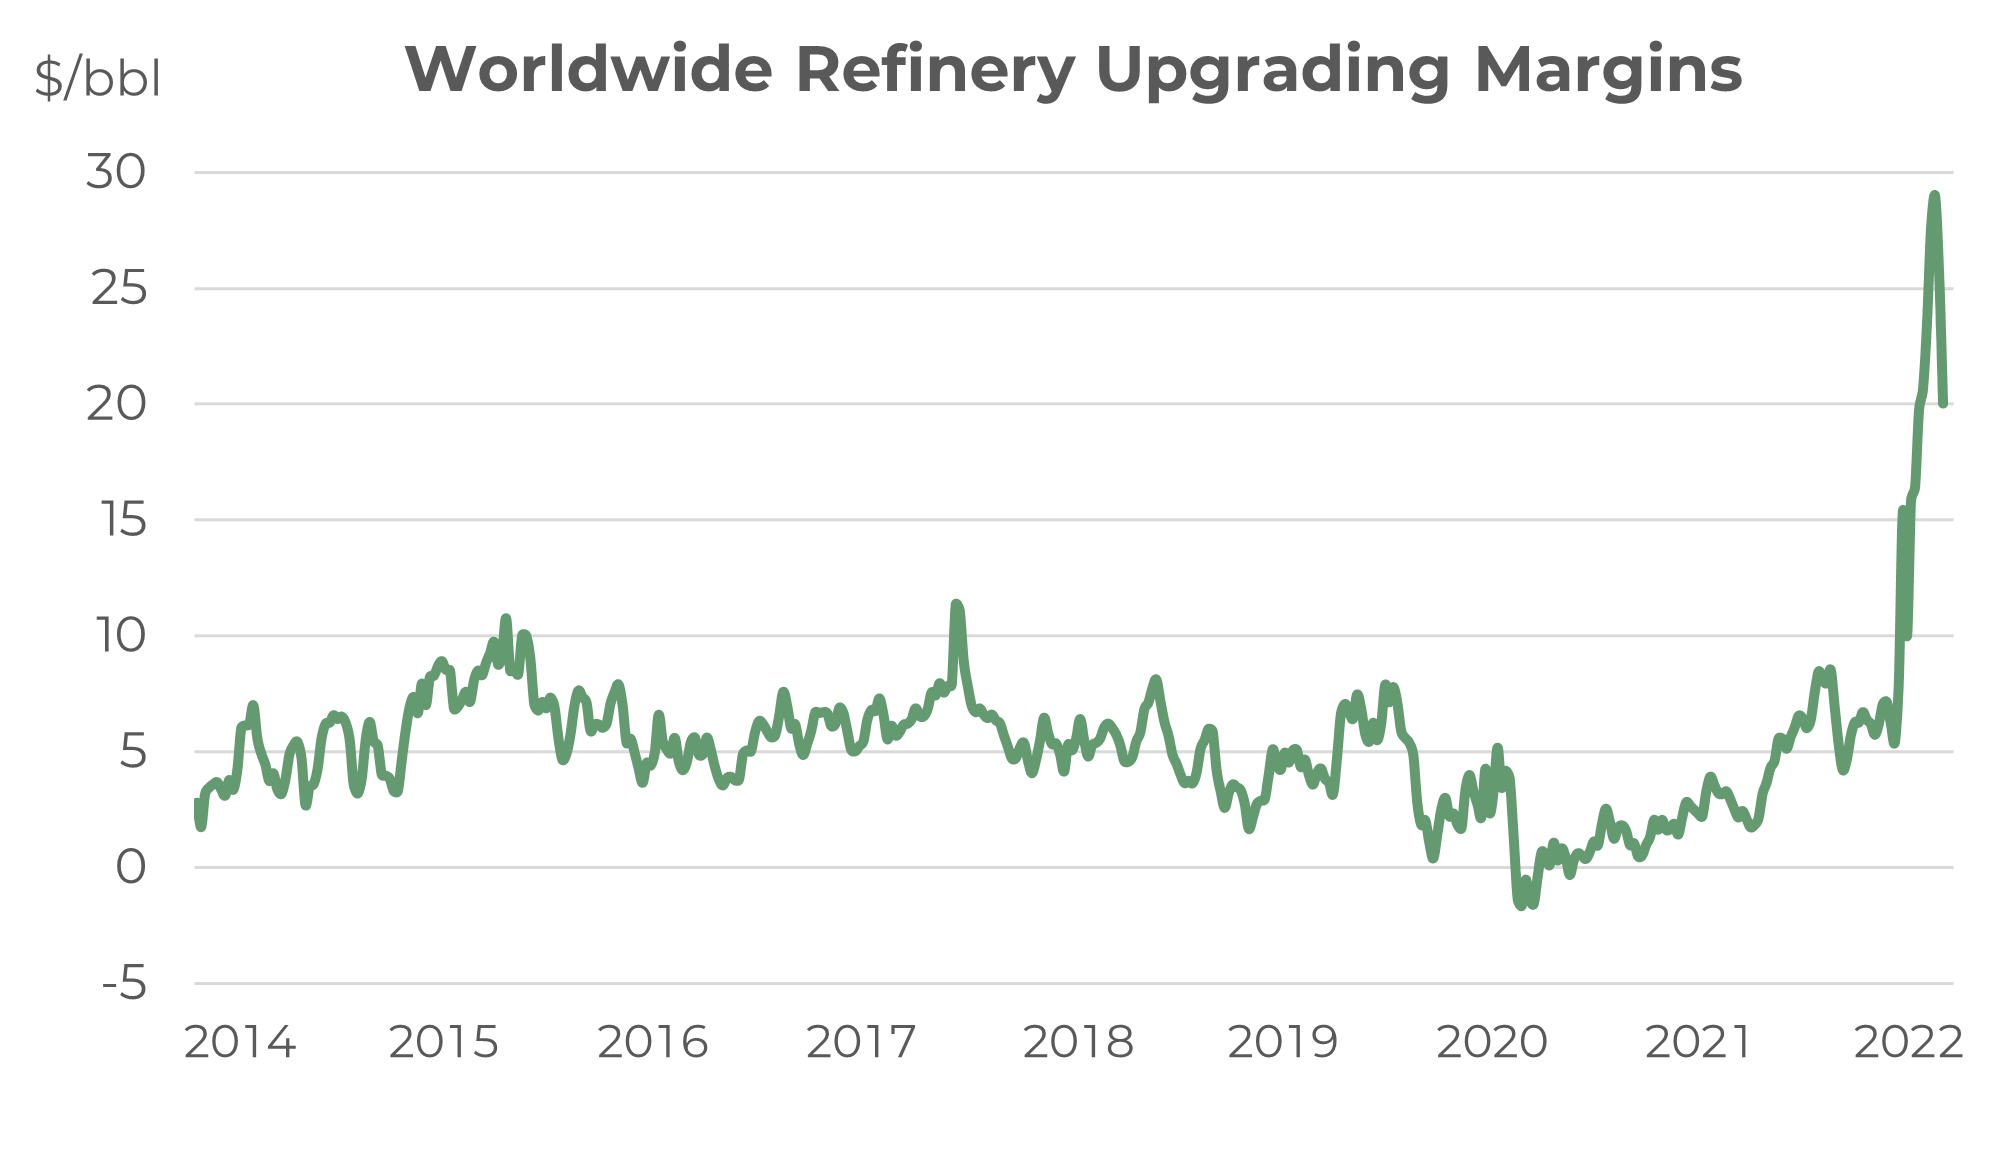
In our report a month ago we highlighted the extreme highs in refinery margins, with an indicative global measure up from a ‘norm’ of around $5/bbl to $30/bbl in April/May. These margins had started to ease at the end of last month, but since then they have rebounded, and are back close to $30/bbl. The indicator has been one to watch, and once again reflects the current severe tightness in oil products.
 Source: Integr8 Fuels
For us in bunkers, it is worth noting which products are driving prices and margins so high, especially as VLSFO is typically a blended product and/or a decision within the refinery process. Understanding this will give us a signal for what products to watch as an early indicator for VLSFO prices potentially rising further, or to start falling.
Focused on which products are driving VLSFO higher
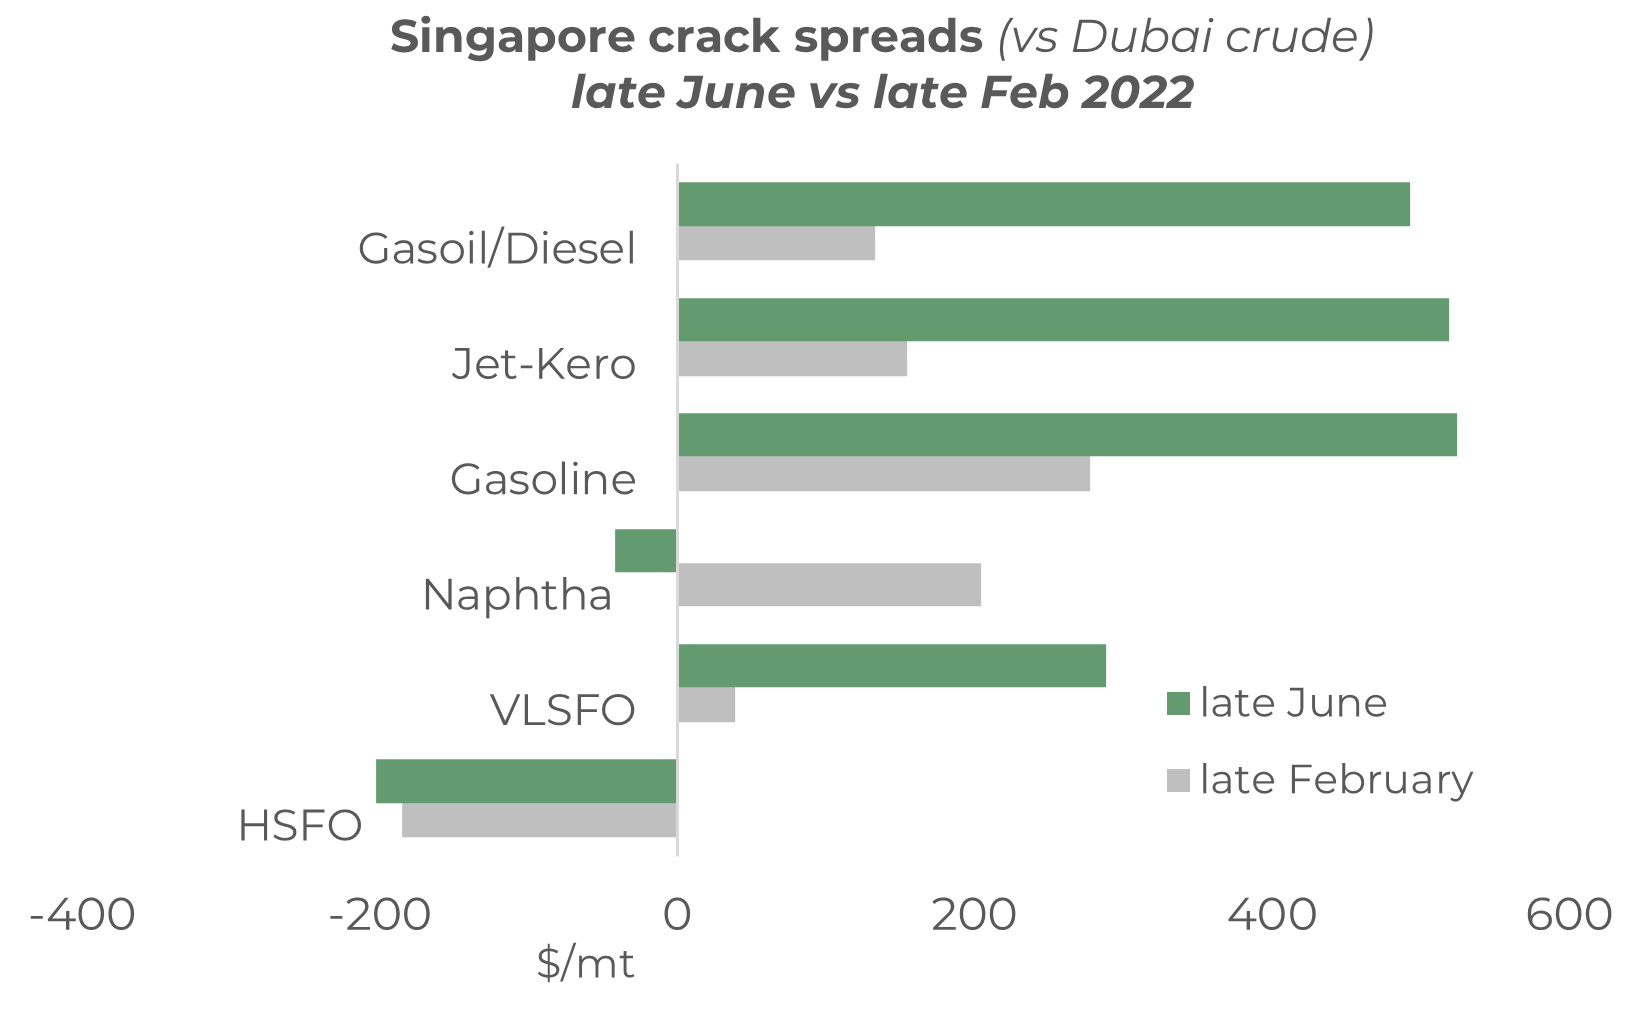
The graph below illustrates the crack spreads between FOB product prices in Singapore and the price of Dubai crude, and how this has changed from late February to late June this year. Firstly, the current spreads on gasoil/diesel, jet-kero and gasoline are huge at around $500/mt. The gain in the gasoil/diesel crack has been the greatest, going from $125/mt in late February to close to $500/mt more recently (almost a four-fold increase). Gains in the jet-kero crack have been similar, and where as the increase for gasoline has been less, the spread is still $500/mt and around double the level of 4 months ago.
Source: Integr8 Fuels
It is tightness in these ‘transport’ fuels that is driving the crack spreads and refinery margins to record highs. Interestingly, the Singapore naphtha crack has reversed and is now negative versus a $200/mt positive contribution 4 months ago, although this has been influenced by a strike in South Korea which forced the shutdown of naphtha crackers; the strike has ended and operations are reportedly returning to normal.
For us, looking at VLSFO pricing, it is the nature of the product and the inter-relationships with high priced transport fuels that is driving VLSFO prices so high, especially in Singapore. The position in the east is stronger than in the west, with exceptionally low diesel and gasoline exports out of India and China resulting in highly restricted supplies east of Suez. However, this is not to under-estimate the tightness in Rotterdam, where prices and margins are still very high!
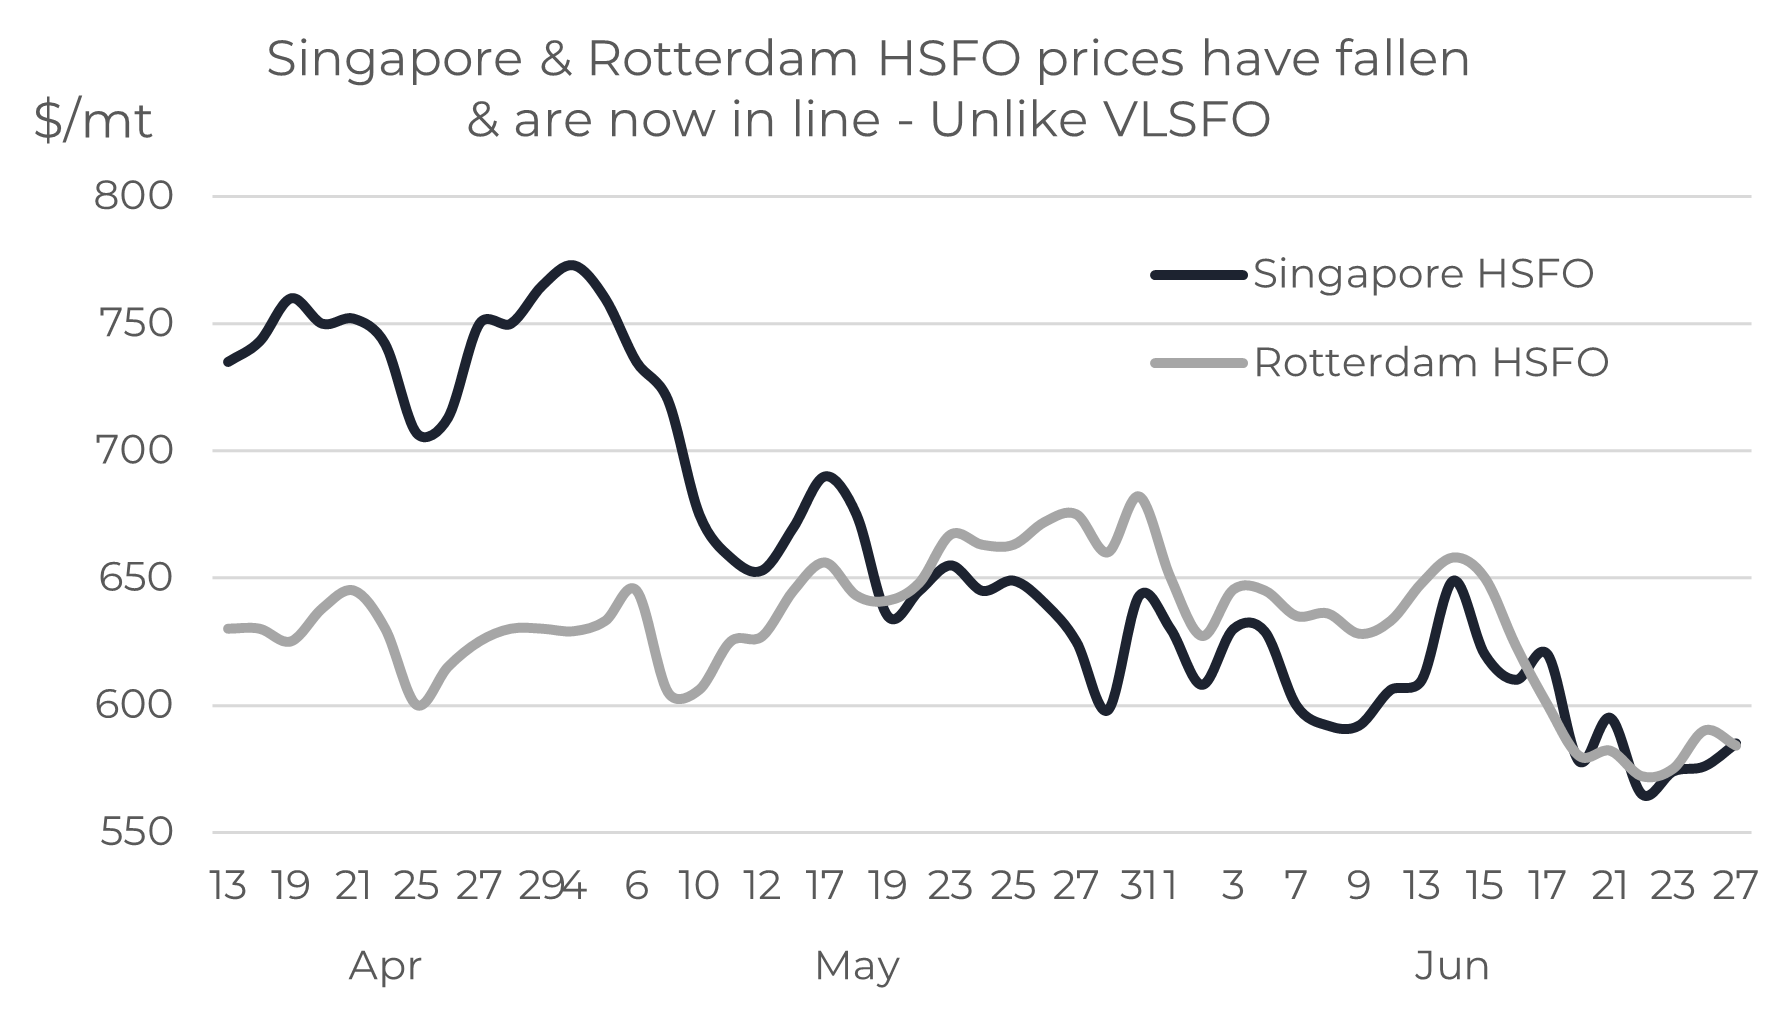
In complete contrast, HSFO prices are down
Developments in the market for HSFO are a complete contrast to the high-priced influences on VLSFO. HSFO crack spreads are typically negative as it is now essentially a by-product in the refining system. Since February there has been a slight further negative move in the crack spread, down to around minus $200/mt. In Asia, reports of Russian material moving this far and recent refinery problems in Malaysia have both meant surplus HSFO being sold into the market, and this has helped weaken prices.
Overall, in recent weeks HSFO prices have eased in Singapore and Rotterdam, with both markets now more-or-less in line, and at just below $600/mt.
 Source: Integr8 Fuels
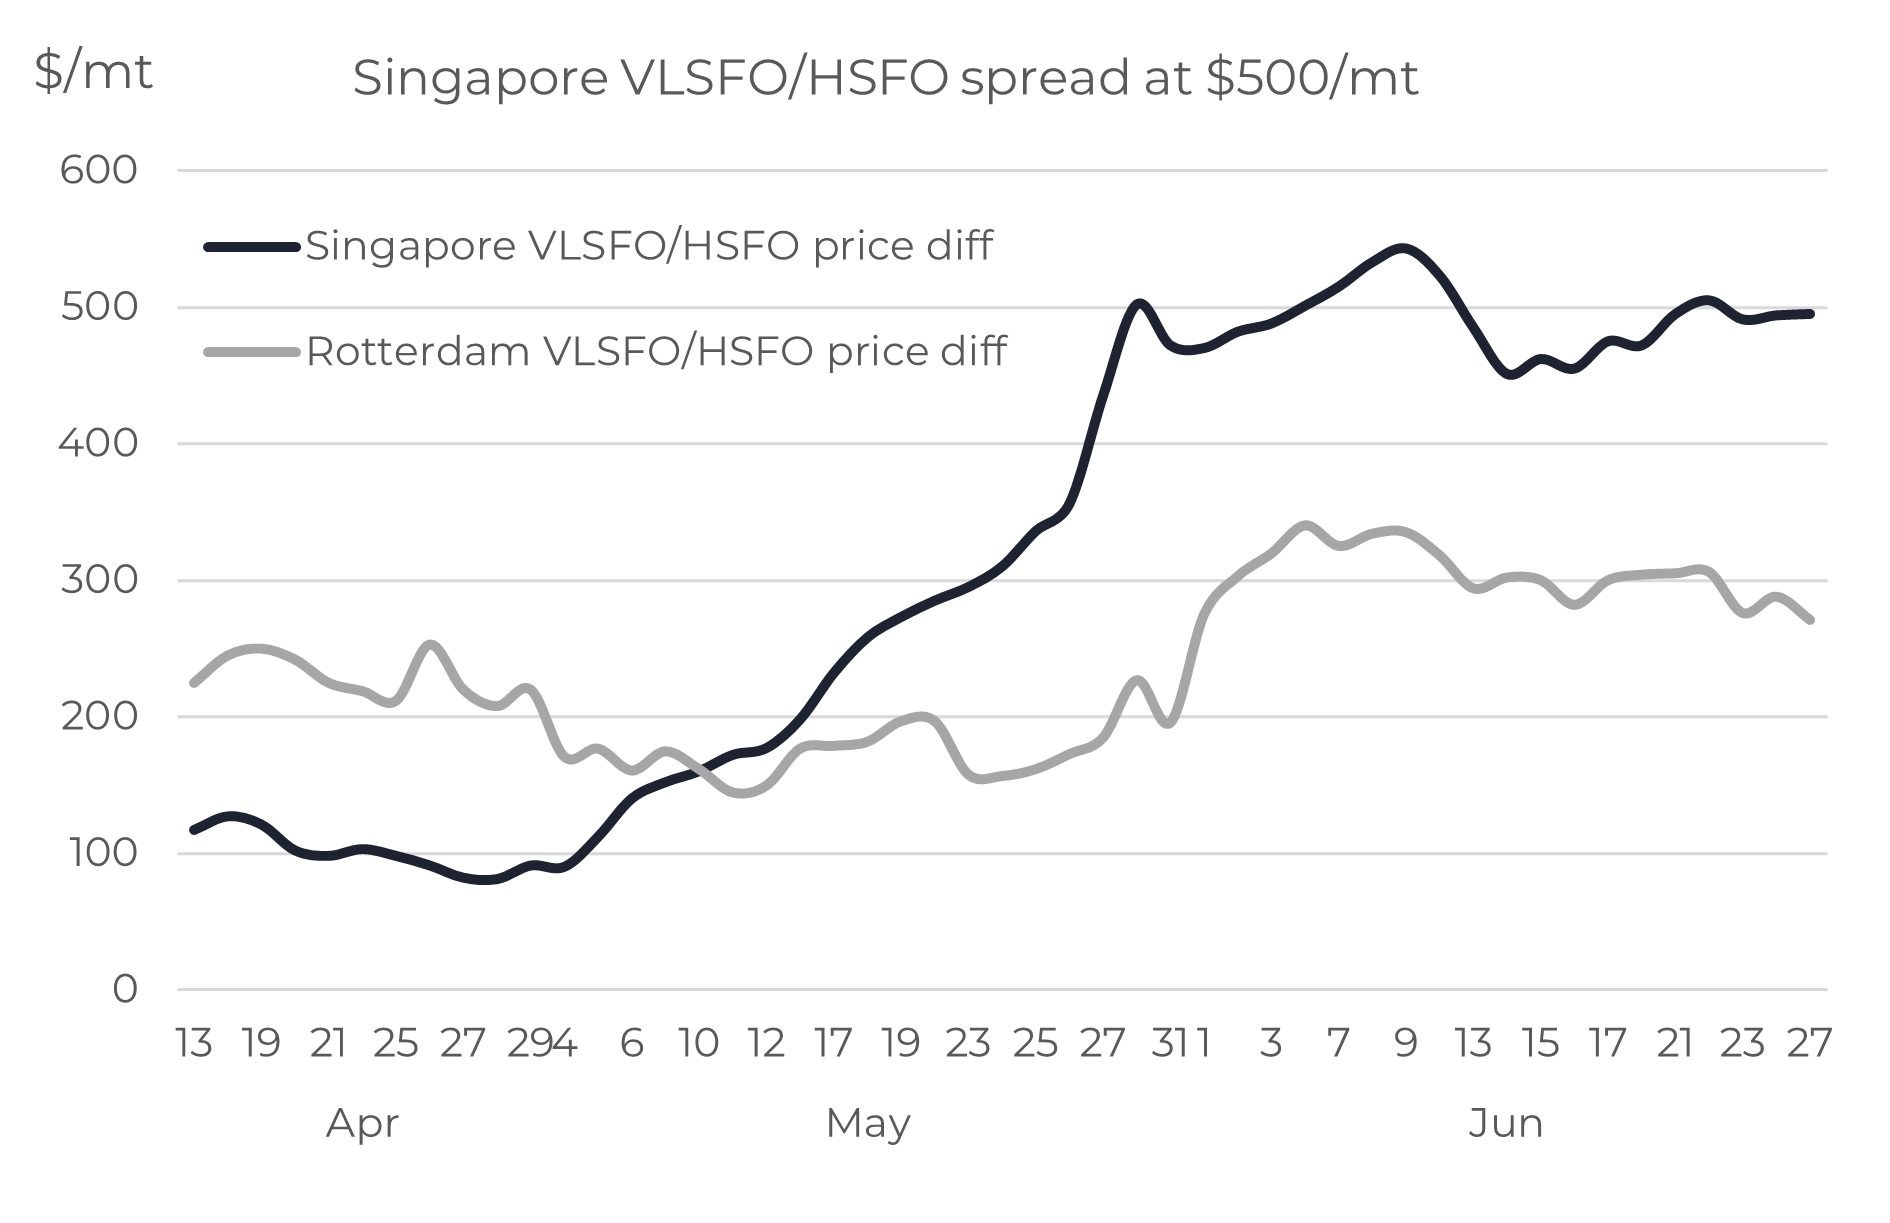
Strength in VLSFO & a further drop in HSFO means a wide differential
The more extreme price movements in Singapore have led to a much wider VLSFO/HSFO price differential. Just two months ago this spread was at $100/mt; now it is $500/mt. Although Rotterdam VLSFO prices have not hit the same highs as in Singapore, the VLSFO/HSFO spread is still at $300/mt.
 Source: Integr8 Fuels
These are differentials that owners of ships with scrubbers didn’t even dream about two months ago; now the spreads are at or above expectations made when initial scrubber investments were made. This will be extremely important for owners of VLCCs with scrubbers, where current market conditions are dire. A non-scrubber VLCC is currently earning around minus $5,000/day on the spot market, where as a scrubber-fitted one is earning close to $20,000/day; not very high, but at least covering more than fixed operating costs.
It is still the talk of continuing tight markets that dominates pricing
The talk of recession will again continue, but for now tightness in products is more than compensating for economic fears. The IEA reported a drop in global refining capacity last year, something that hasn’t happened since the early 1990s, and there are no quick fixes to constraints in the refining industry. Significantly, net gains in capacity this year and next year are only expected to reach a combined 2.6 million b/d. Also, although we have not mentioned crude oil markets (nor the war in Ukraine) in this report, the ExxonMobil CEO recently spoke out about 3-5 years of “fairly tight markets” because of lack of investment since the covid impact.
We have seen that things can change very quickly and at the extreme it’s the doomsday scenario of an economic and stock market collapse that perhaps some people fear.
However, in terms of what is happening now, economic threats are leading to downwards revisions to future oil demand, but demand is still forecast to increase, just not by as much as before. Therefore, it seems we are looking at sustained pressures on a currently constrained system. So, for now, the key pointers to watch for price direction are still refining margins (they tell us a lot about the market), with also a keen focus on any increase in product exports from China and India (they are negligible at the moment).
Steve Christy, Research Contributor
E: steve.christy@integr8fuels.com
Download this article as a PDF »
Bunker market shifts focus to supply concerns – Will this last?
May 26, 2022
Crude prices are higher, especially for light/sweet fuel grades
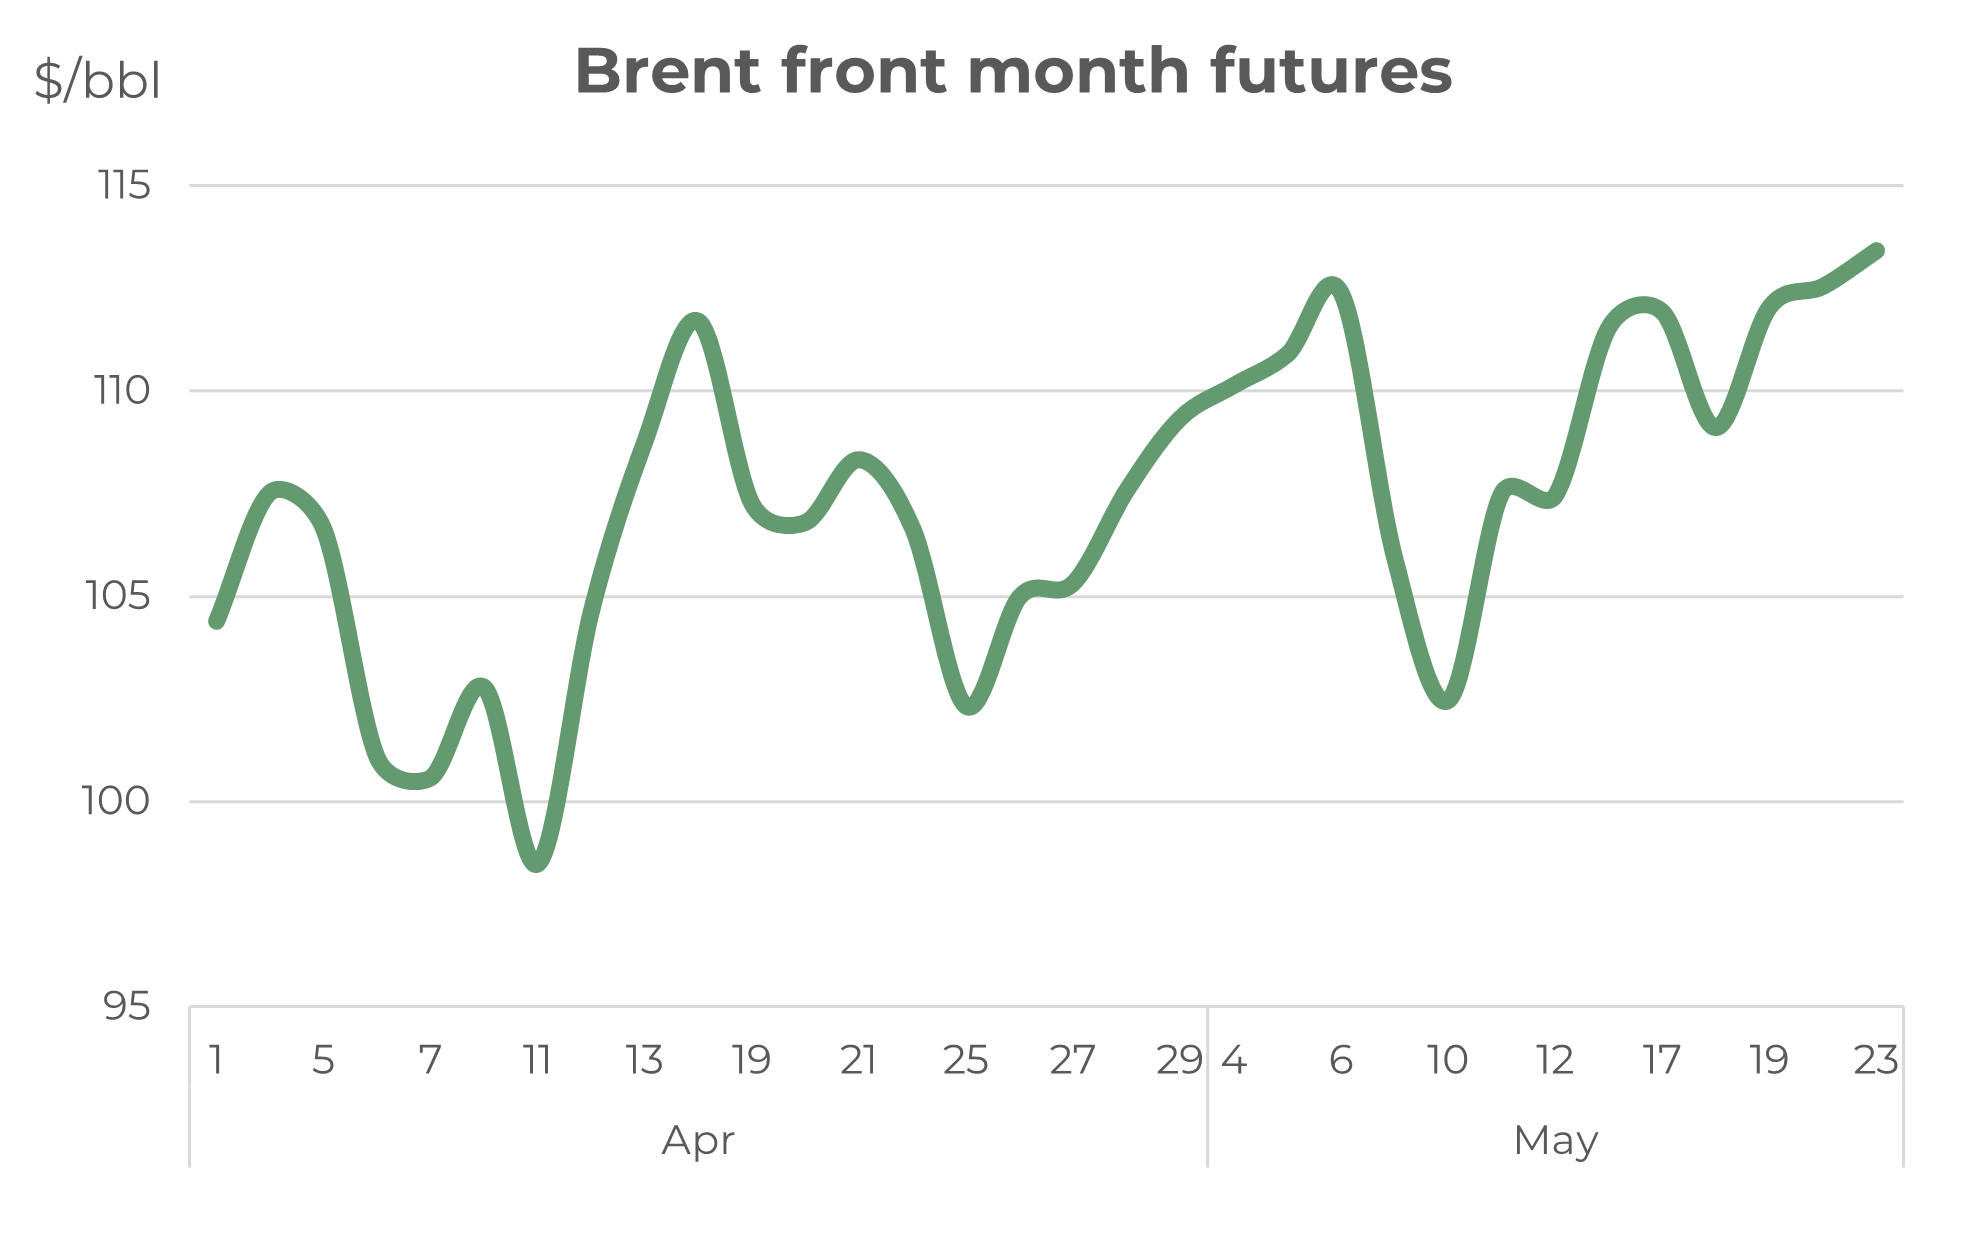
A month ago, Brent futures were around $105/bbl and there were real concerns about inflation, much slower economic growth and downwards revisions to oil demand. Despite these bearish signals, Brent futures are almost $10/bbl higher than a month ago, at close to $115/bbl!
Source: Integr8 Fuels Read More
Crude prices are higher, especially for light/sweet fuel grades
A month ago, Brent futures were around $105/bbl and there were real concerns about inflation, much slower economic growth and downwards revisions to oil demand. Despite these bearish signals, Brent futures are almost $10/bbl higher than a month ago, at close to $115/bbl!
Source: Integr8 Fuels
Low stock and product supply are the primary issue
Clearly something in the market is more significant than these bearish factors, and that is on the supply side. Oil product supply is tight and stock levels low, centred on lighter products such as middle distillates and gasoline. This in turn has supported incredibly high refinery margins. At the same time, despite calls from the US, OPEC has made no significant move to raise crude production, and in fact output from some OPEC+ countries has actually fallen.
These supply developments have been more than enough to reverse what was a market focus on bearish economic factors to a market focus on the current squeeze on product supply.
Extraordinary refinery margins are the tell-tale sign
The current extremely tight position in the products markets is clearly represented in the graph below. This shows a long-run indication of average refinery upgrading margins and just how high they are today.
 Source: Integr8 Fuels
Average refining upgrading margins increased to close to $30/bbl two weeks ago, with:
- strong demand in Europe (partly replacing Russian supplies) and a period of refinery maintenance;
- gasoline demand picking up in the US against a low stocks position;
- a strong pull on Middle East product exports going east and west;
- strong gasoline and gasoil buying in the east, also against a low stocks position.
The key here is strong gasoline and middle distillate demand against low stocks positions, and this has created a spike in refinery margins nothing like we have seen in recent years. Although current margins are still exceptionally high, with an average indication around $20/bbl, they have turned a corner and are declining. In Europe, product stocks have started to rise (albeit slowly) and significant volumes from the Middle East and India are heading in this direction (as a further indicator, product tanker earnings are also at high levels, unlike earnings in the crude tanker sector). In the US, gasoline remains strong, but middle distillates have eased, bringing down refinery margins. Looking ahead, US gasoline could also ease as more Europe exports arrive on the US east coast.
In Asia there is a mixture, with refinery outages supporting gasoline margins however, middle distillates are easing similar to other markets. The ‘curved ball’ is China and what happens next. Indications are that refinery runs and product exports have been low, but exports could rise as domestic oil demand continues to be hit by big city lockdowns. However, lockdowns are expected to ease, and Shanghai is likely to ease restrictions during June. Chinese oil demand will pick up as a result; but what will be the extent of refinery runs and product exports as lockdowns ease?
Overall, refinery margins have been extraordinarily high and reflect the tightness in the products markets and prices; they are still extremely high in historical terms, but they are falling.
The pressure has been on products, hence the surge in refinery margins, but crude supply has also been constrained. Clearly Russian production and exports have been hit by the international responses to the invasion of Ukraine, and Russian output down by around 1 million b/d over the past few months.
Crude supplies are also an issue – even outside Russia
Russia is part of the OPEC+ group and so the loss here has affected the overall production from the group. However, combined crude production from all the other OPEC+ countries has actually fallen by around 0.5 million b/d since the Russian invasion. This has created a ‘double whammy’ in terms of crude supply constraints over the past couple of months.
Source: Integr8 Fuels
The reduction in OPEC+ crude output is not a group strategy, but a consequence of production losses in some countries and muted increase is supplies from those countries with spare capacity; namely Saudi Arabia, UAE and Kuwait. The US has made calls for OPEC to raise production in the wake of high prices, but the three ‘spare production’ countries have only increased output by 0.25 million b/d over the past couple of months; against a drop of almost 1 million b/d from Russia.
The situation has then been hugely compounded by production losses in other OPEC+ countries, specifically Kazakhstan, Libya, Nigeria, Angola and Malaysia. The w loss from these countries has amounted to 0.75 million b/d since February. Hence the overall 0.5 million b/d fall in output from the OPEC+ group outside Russia since February.
 Source: Integr8 Fuels
The other very significant development here is that all the production gains are in countries typically producing heavy, sour crudes, whilst all the losses are in countries producing lighter, sweet crudes. This has only exacerbated the pressures and prices on the gasoline and distillate markets. However, at the same time it has also weakened the relative pricing for high sulphur fuel oil.
The bunker market in Singapore has seen extreme price moves
These dynamics have hit the Singapore market, with VLSFO prices up on the back of market developments and also driven higher because an anticipated drop in imports. Conversely, Singapore HSFO prices fell as imports are forecast to rise, not least with Russian volumes finding their way east rather than west.
 Source: Integr8 Fuels
The net result is that the Singapore VLSFO/HSFO price differential has widened enormously over recent weeks, from only $80/mt at the end of April to more than $300/mt currently (and now much wider than the $160/mt spread in Rotterdam).
Monitoring refining margins
Summarising, the gasoline and middle distillate markets have led oil prices higher over recent weeks and although refinery margins are still very high, they are falling. These developments have taken the wind out of the bearish economic factors as a main market focus. There are always a lot of factors that influence prices and price direction and the bearish issues haven’t gone away. However, at the moment tightness in products is still the main price support and watching refining margins may well be a good place to focus in the next few weeks to see if this is maintained
or not.
Steve Christy, Research Contributor
E: steve.christy@integr8fuels.com
Download this article as a PDF »
Bunker prices look like they are falling – Bearish signals in sight
April 28, 2022
VLSFO Prices Under Threat
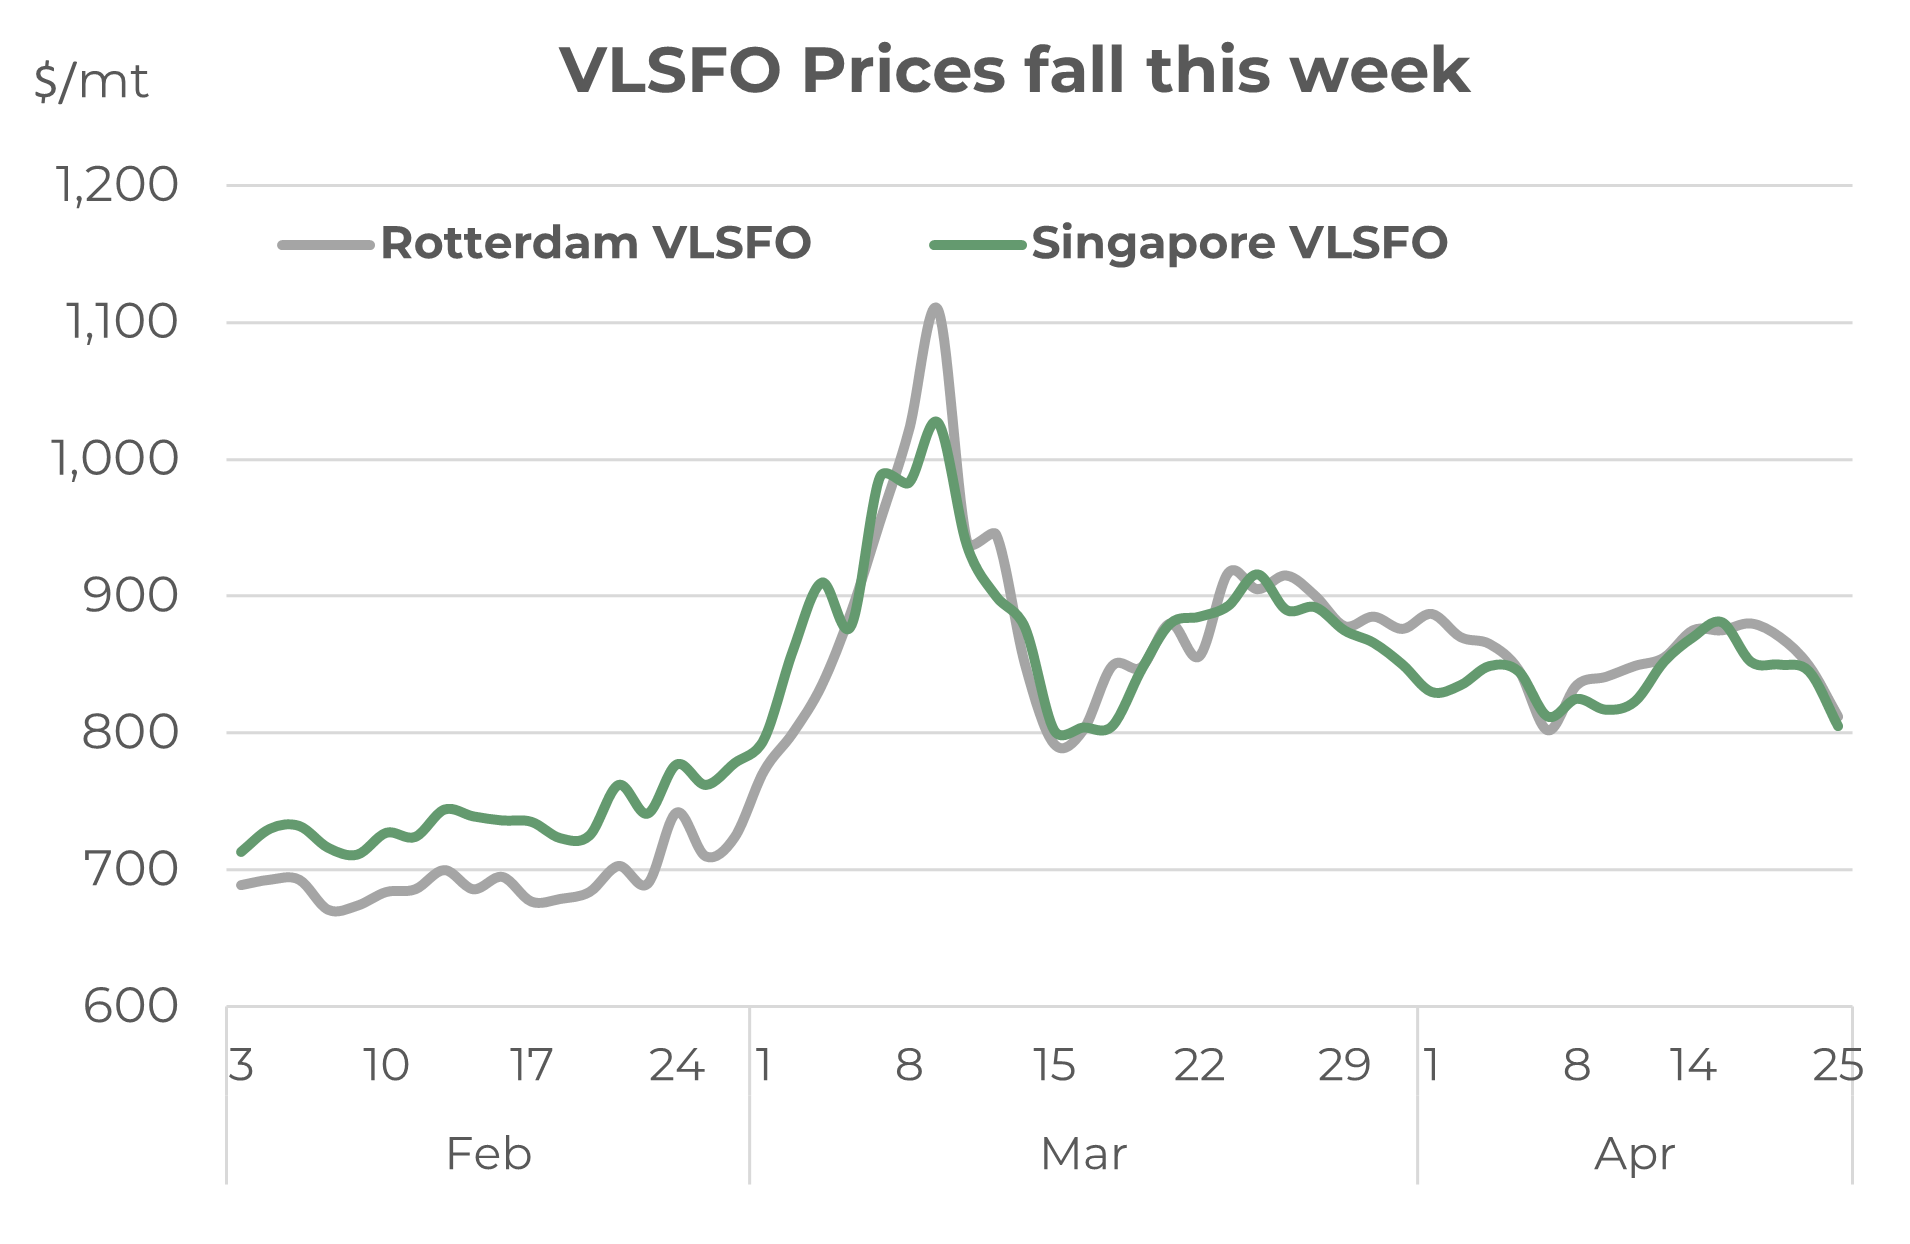
After the Russian invasion of Ukraine and the sharp price spike in early March, VLSFO has eased back and moved within the $800-900/mt range for more than a month. However, at the start of this week prices took a $40/mt dive to the low of the recent range; there are a lot of bearish news stories in the market and prices look vulnerable for another fall.
Within these price movements it is still worth noting that, unlike the historical norm, Rotterdam VLSFO prices have remained at or above Singapore quotes throughout this period. VLSFO pricing could continue this way, with more extreme pressures on Europe because of its closer proximity to the Russian market.
Source: Integr8 Fuels Read More
VLSFO Prices Under Threat
After the Russian invasion of Ukraine and the sharp price spike in early March, VLSFO has eased back and moved within the $800-900/mt range for more than a month. However, at the start of this week prices took a $40/mt dive to the low of the recent range; there are a lot of bearish news stories in the market and prices look vulnerable for another fall.
Within these price movements it is still worth noting that, unlike the historical norm, Rotterdam VLSFO prices have remained at or above Singapore quotes throughout this period. VLSFO pricing could continue this way, with more extreme pressures on Europe because of its closer proximity to the Russian market.
Source: Integr8 Fuels
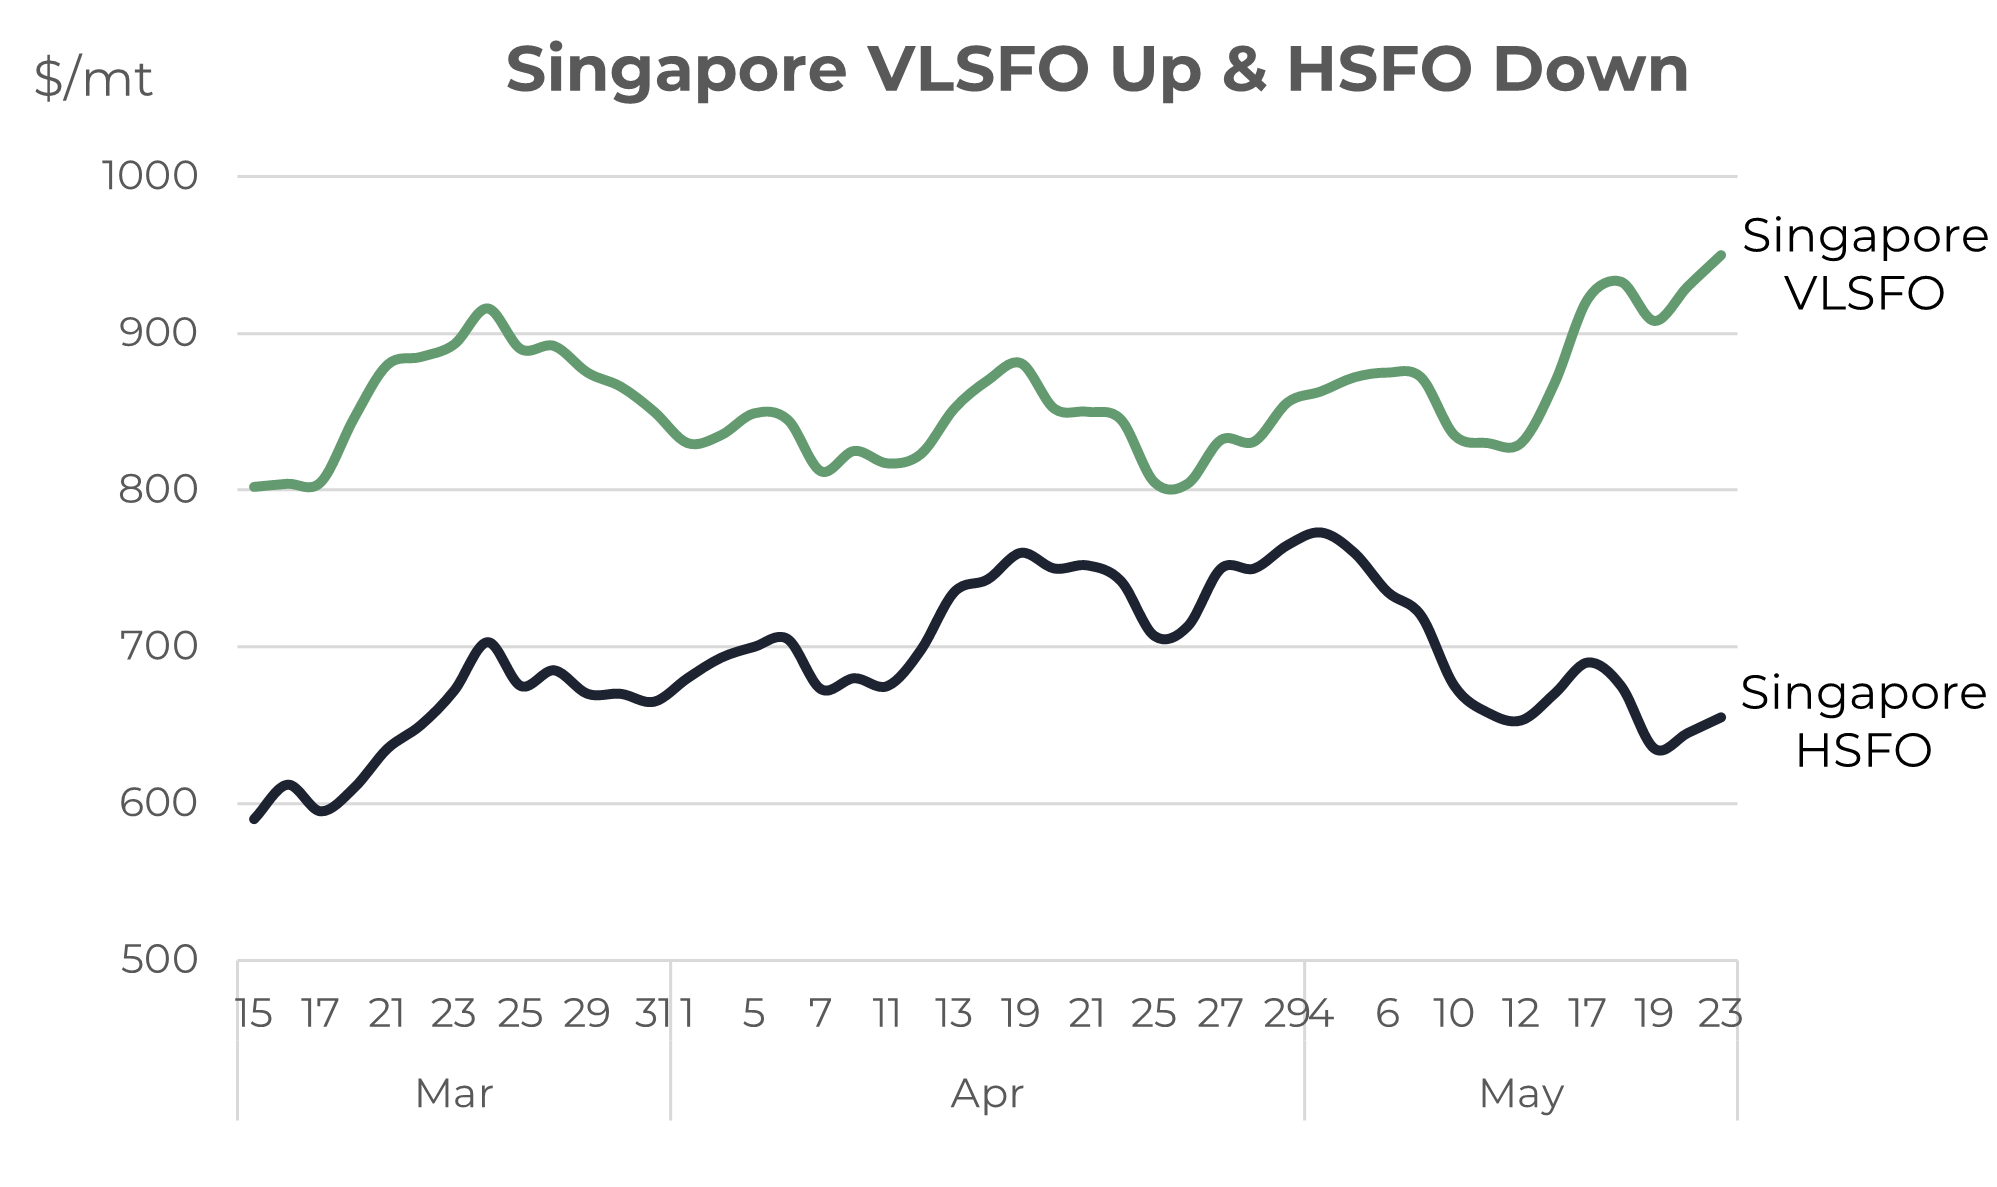
What is happening to Singapore HSFO?
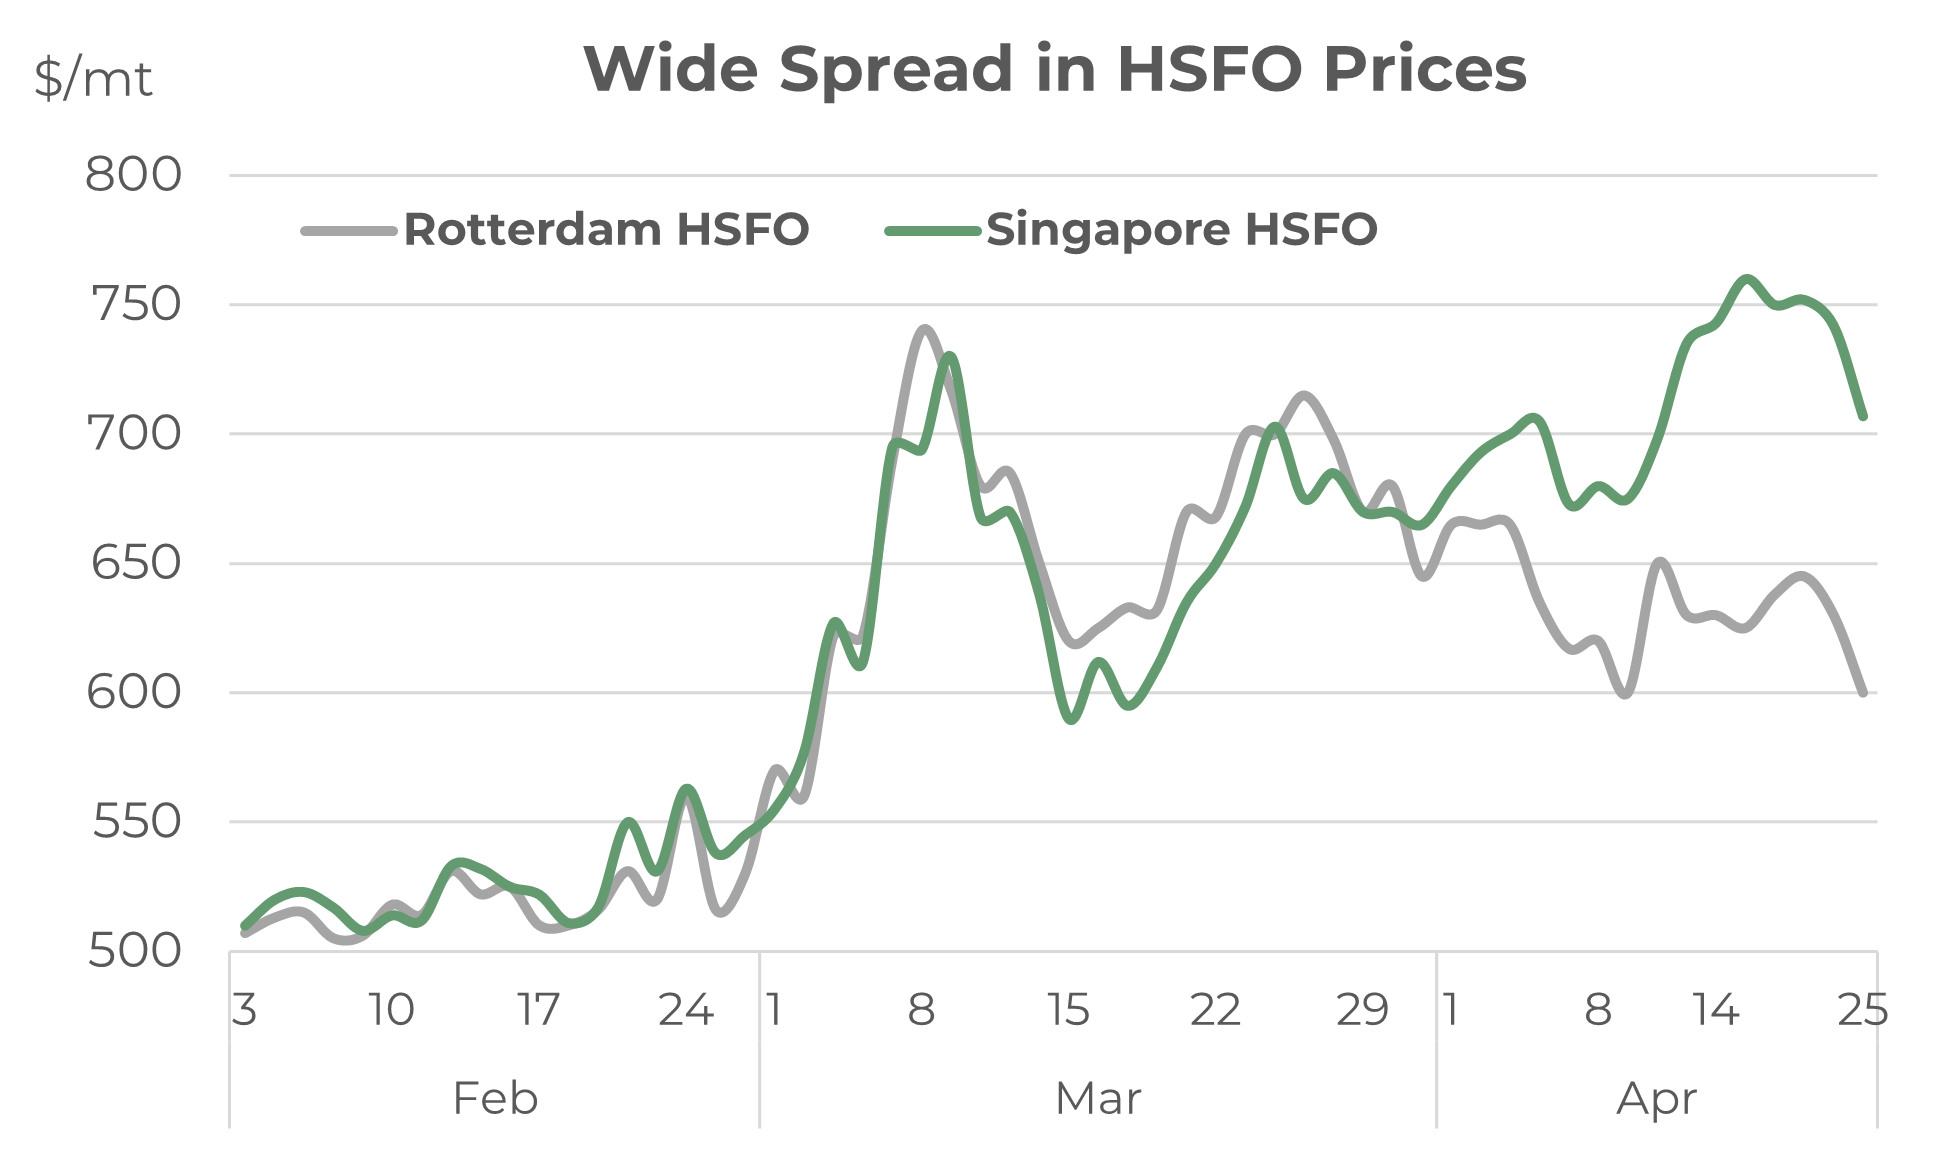
Whereas the rise and falls in Rotterdam and Singapore VLSFO prices have largely tracked each other over the past couple of months, and are currently both around 25% ($200/mt) below their peak, this is definitely not the case in the HSFO market. Rotterdam HSFO prices have eased more-or-less the same as international VLSFO prices, and are around 20% below their recent peak. BUT the Singapore HSFO bunker market has followed its own trajectory, and prices last week were even higher than the early March peak at the time around the Russian invasion.
 Source: Integr8 Fuels
There are a number of reasons why Singapore HSFO prices have taken this divergent upwards move, including bunker contamination issues. However, there are key fundamental drivers pushing this extreme pricing. The loss of Russian supplies has left western markets tight on high sulphur material, which has drastically cut the ‘normal’ flow of these volumes from west to east. In addition, more high sulphur Middle East fuel has been ‘pulled west’ to make up the Russian shortfall, rather than typically going east. This again has tightened the Asian HSFO markets. This is likely to be a continuing feature of the market, with no obvious near-term return of Russian oil supplies to western markets.
In addition to these potentially longer-term east/west fundamental changes, very high natural gas prices can make fuel oil a more attractive alternative into power generation in some Asian countries, such as Pakistan and Bangladesh. Because of this, these countries are already buying HSFO and there could be a higher seasonal demand for fuel oil in the coming months to meet summer cooling demand, again adding to the squeeze in the Asian high sulphur market.
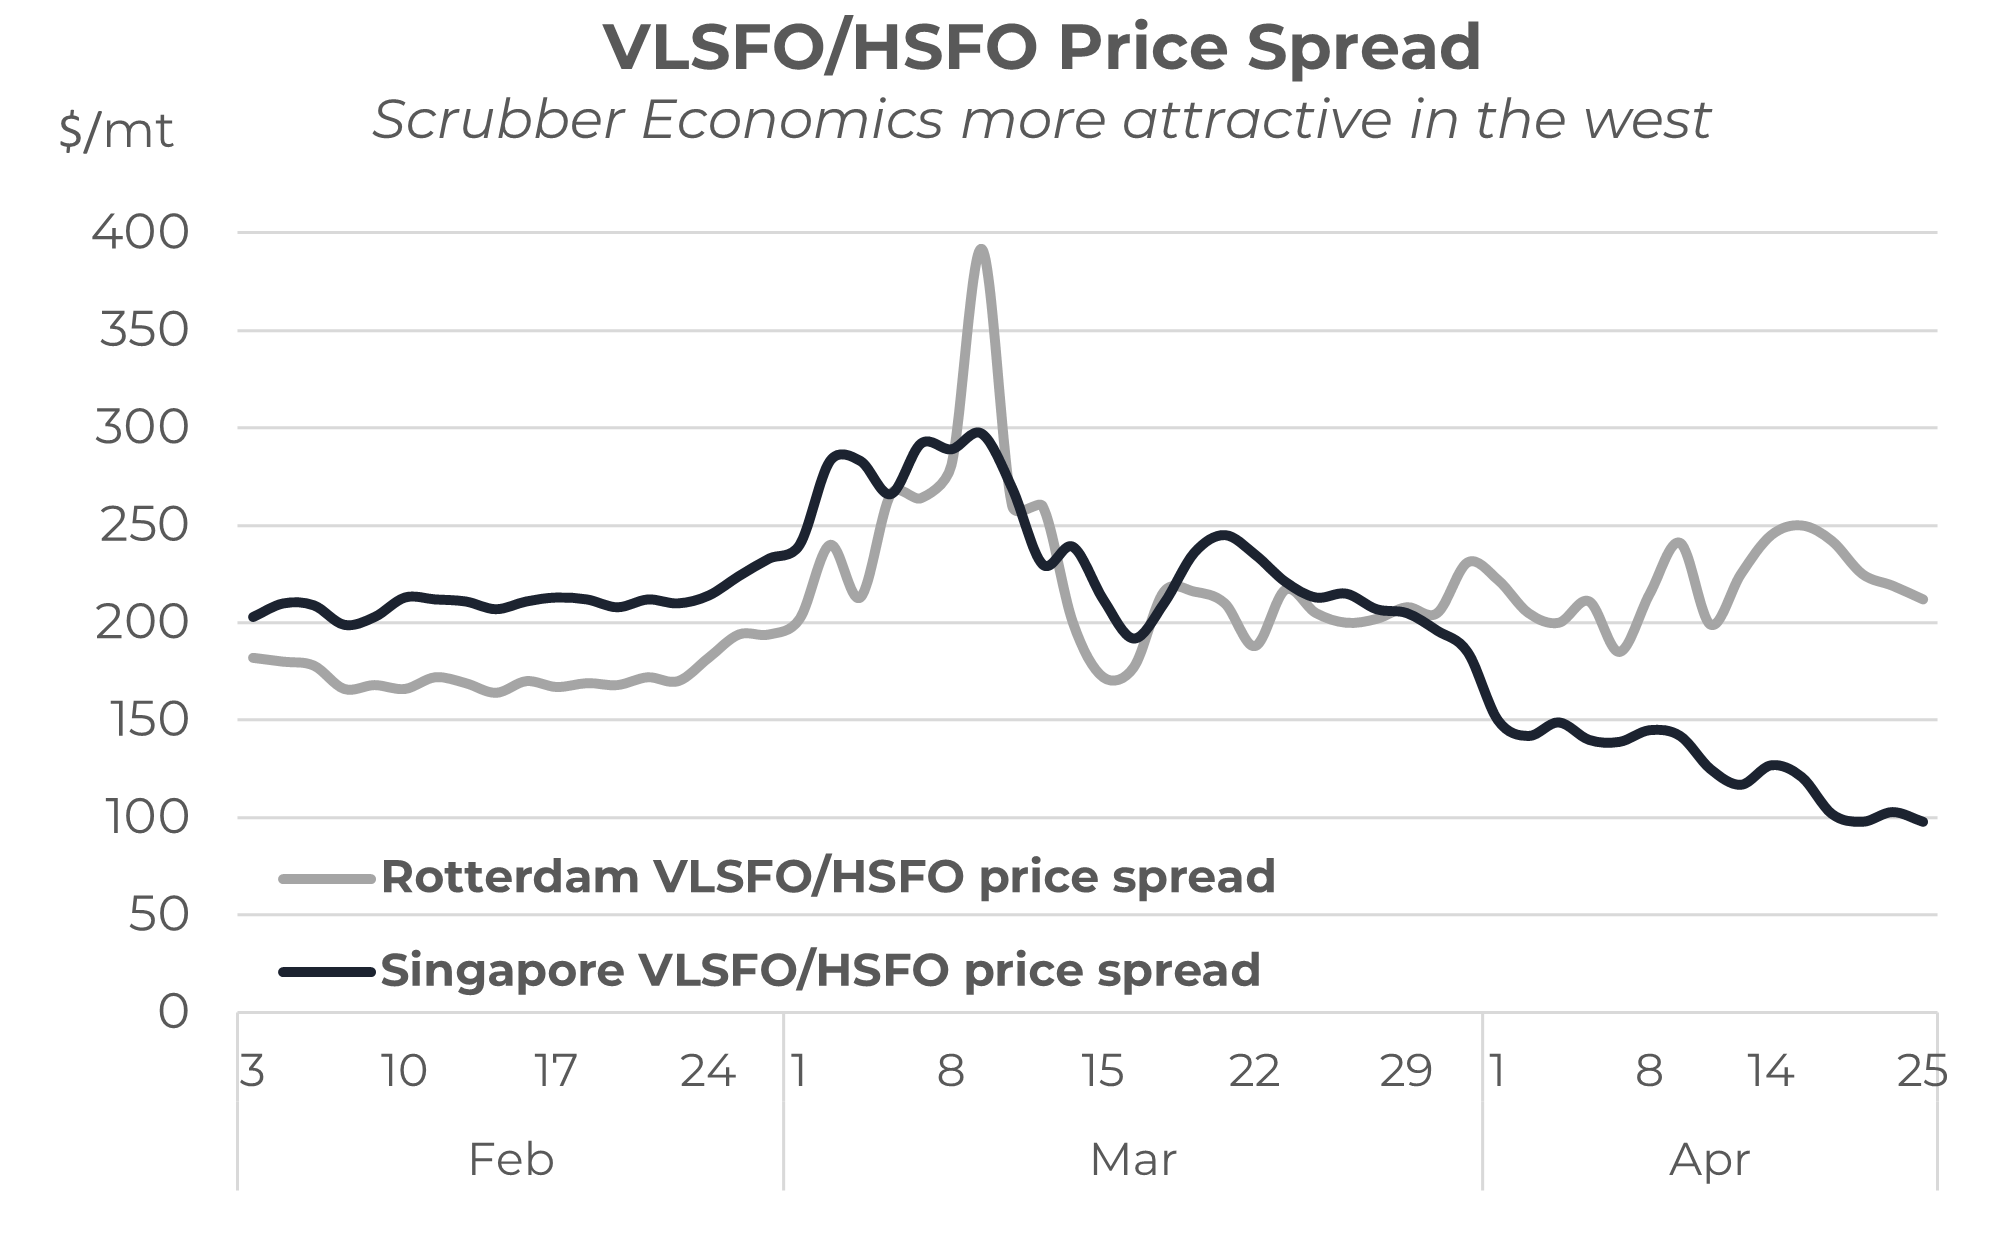
The net result is that the VLSFO/HSFO price spread has remained relatively wide in the west, at around $200/mt in Rotterdam, but has slid to only $100/mt in Singapore. The economics for scrubbers are clearly much stronger in the west than in the east.
Source: Integr8 Fuels
Although any contamination issues are likely to be resolved, the numerous fundamental drivers could keep Singapore HSFO quotes relatively high for some time, even in a falling market.
Economic slowdown will threaten oil demand and impact bunker prices
As the war in Ukraine continues, so the world’s financial markets are focused on high prices, inflation, much slower economic growth (and even talk of recession). All of these ‘bigger picture’ developments will clearly have a major impact on oil markets and what happens to bunker prices.
In our sector we have seen the sharp rise in prices because of the Russian invasion of Ukraine and subsequent embargoes and sanctions on Russia. In other markets, such as natural gas, the price hikes have been far greater, and numerous other commodity prices are also significantly higher. All these developments and fears are driving inflation rates to levels not seen for around 40 years; annual European inflation was at 8% in 1984 and the US in 1981/82. The obvious response is for interest rates to rise, which in turn is a threat to economic growth and future demand. The latest IMF report has already indicated a global slowdown based on the impacts of war and cuts in goods supplied from China because of the covid lockdowns.
In the same way, analysts are already lowering their expectations for future oil demand on the back of these war related and Chinese lockdown developments. Until now crude prices have generally held up, despite concerns on the Chinese lockdowns and downward revisions to economies and oil demand. This has been predominantly due to supply concerns going forward, including the current loss of Libyan crude exports because of domestic protests.
The supply concerns are still there, with more buyers refusing to take Russian oil, and Germany stating that it will stop all its 0.4 million b/d Russian crude imports by the end of this year. Some traders are also reducing or stopping Russian oil purchases. These developments may be considered price supportive, but signs at the start of this week suggest the focus is shifting more towards the Chinese lockdowns in the shorter-term and the looming economic issues in the longer term.
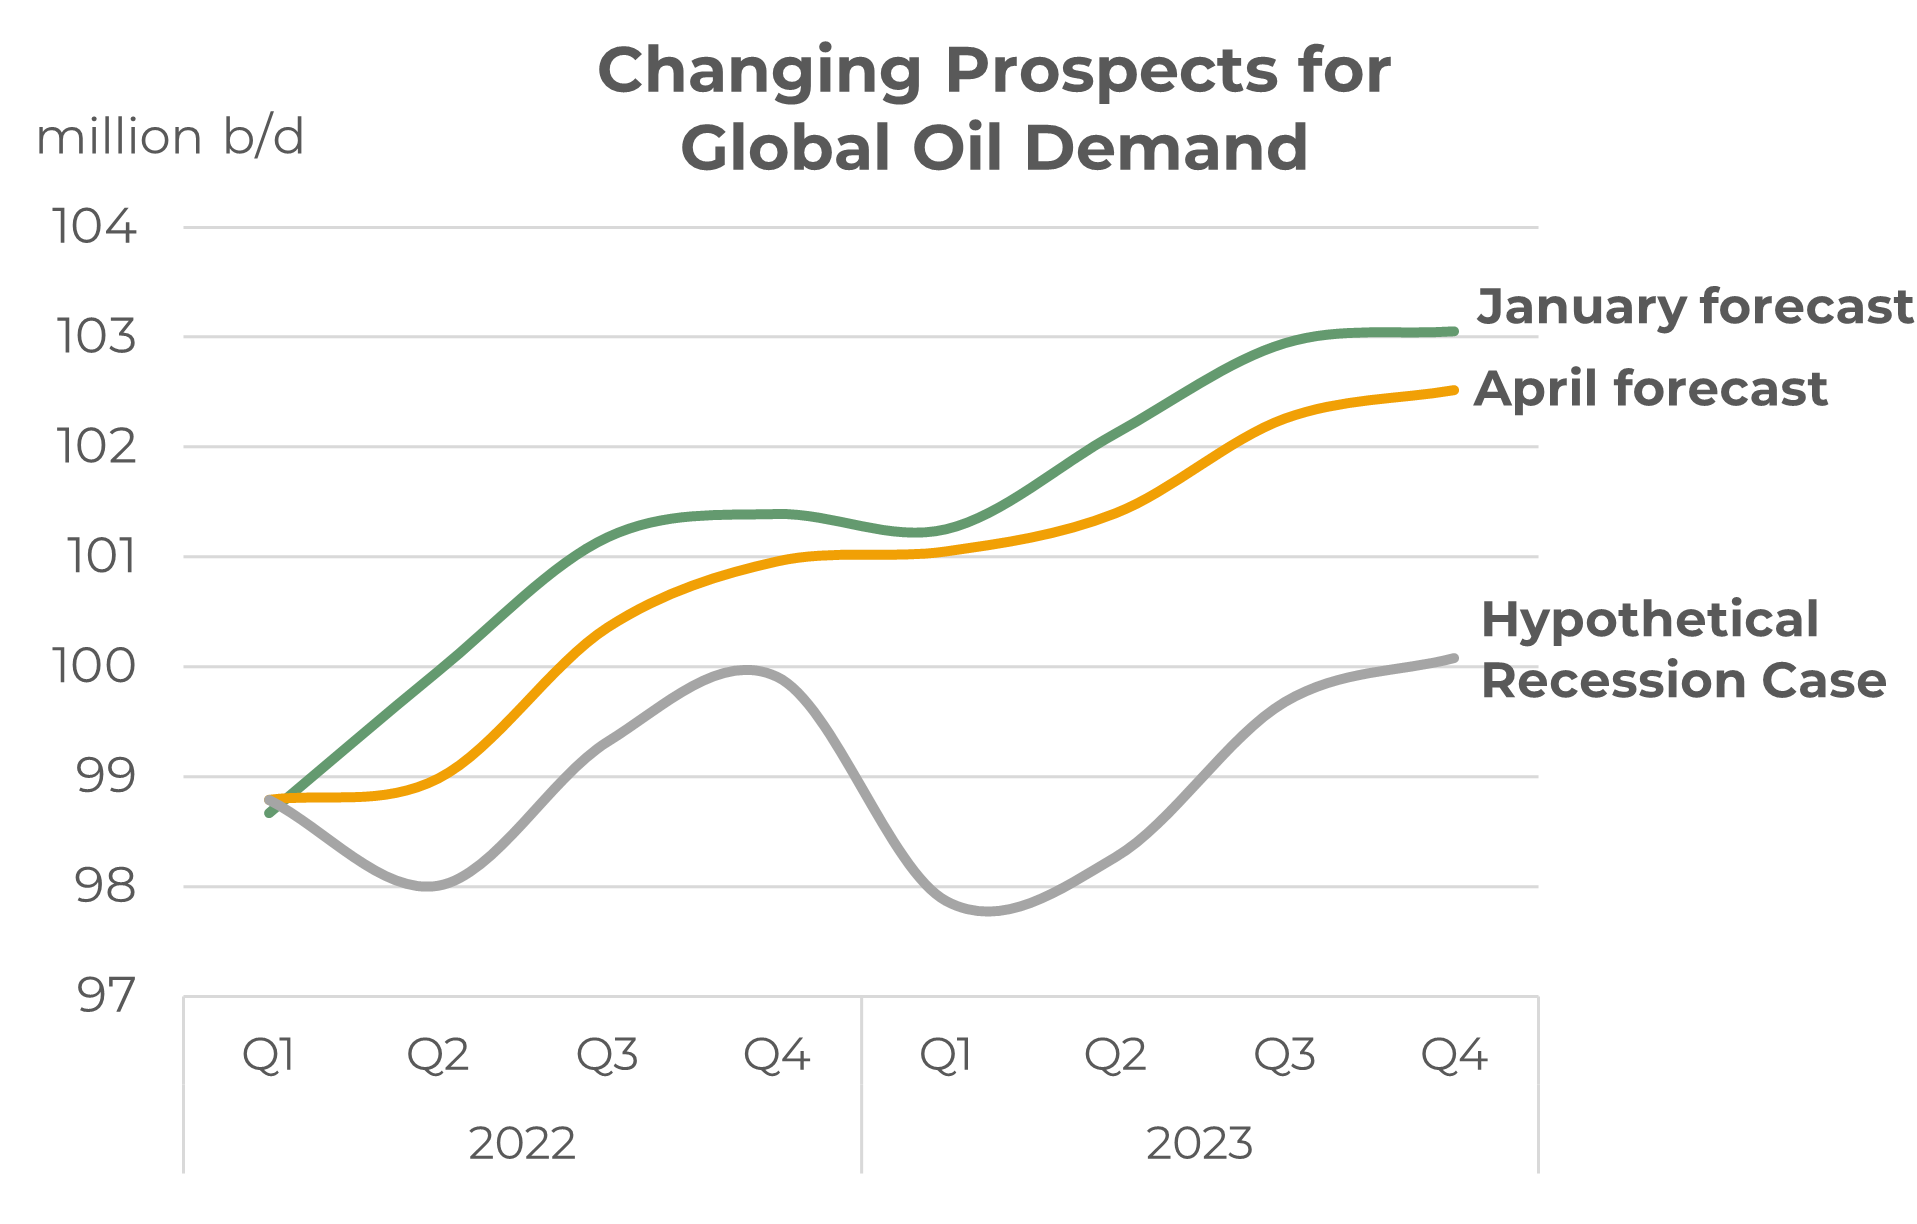
The graph below illustrates the general direction in global oil demand forecasts, with latest analyst reports indicating future demand around 0.6 million b/d lower than their January forecasts. This, in its self may not be too much, but ‘the storm clouds are brewing’, and there will be more talk and more analysis on the economic fallout of the war.
 Source: Integr8 Fuels
This is now the main concern for the market over 2022/23, and where-as the talk of recession may be premature, the conditions do at least warrant looking at such a case. Clearly the impact on oil demand over the next 2 years (and demand across all sectors) will be a function of how economies perform and what counter policies are put in place. However, a hypothetical recession case is shown in the graph above and it indicates a broad levelling off in demand with season fluctuations. Although the biggest demand falls in this case would be seen on gasoil/diesel and gasoline, the bunker market is not immune.
In summary, there will be more and more talk and reports about economic threats and if there is nothing to counter these stories, then oil prices are likely to come under more downwards pressure.
Steve Christy, Research Contributor
E: steve.christy@integr8fuels.com
Download this article as a PDF »
Prices are high, daily volatility is high and European bunker prices are above Singapore
March 23, 2022
VLSFO above $1,000/mt
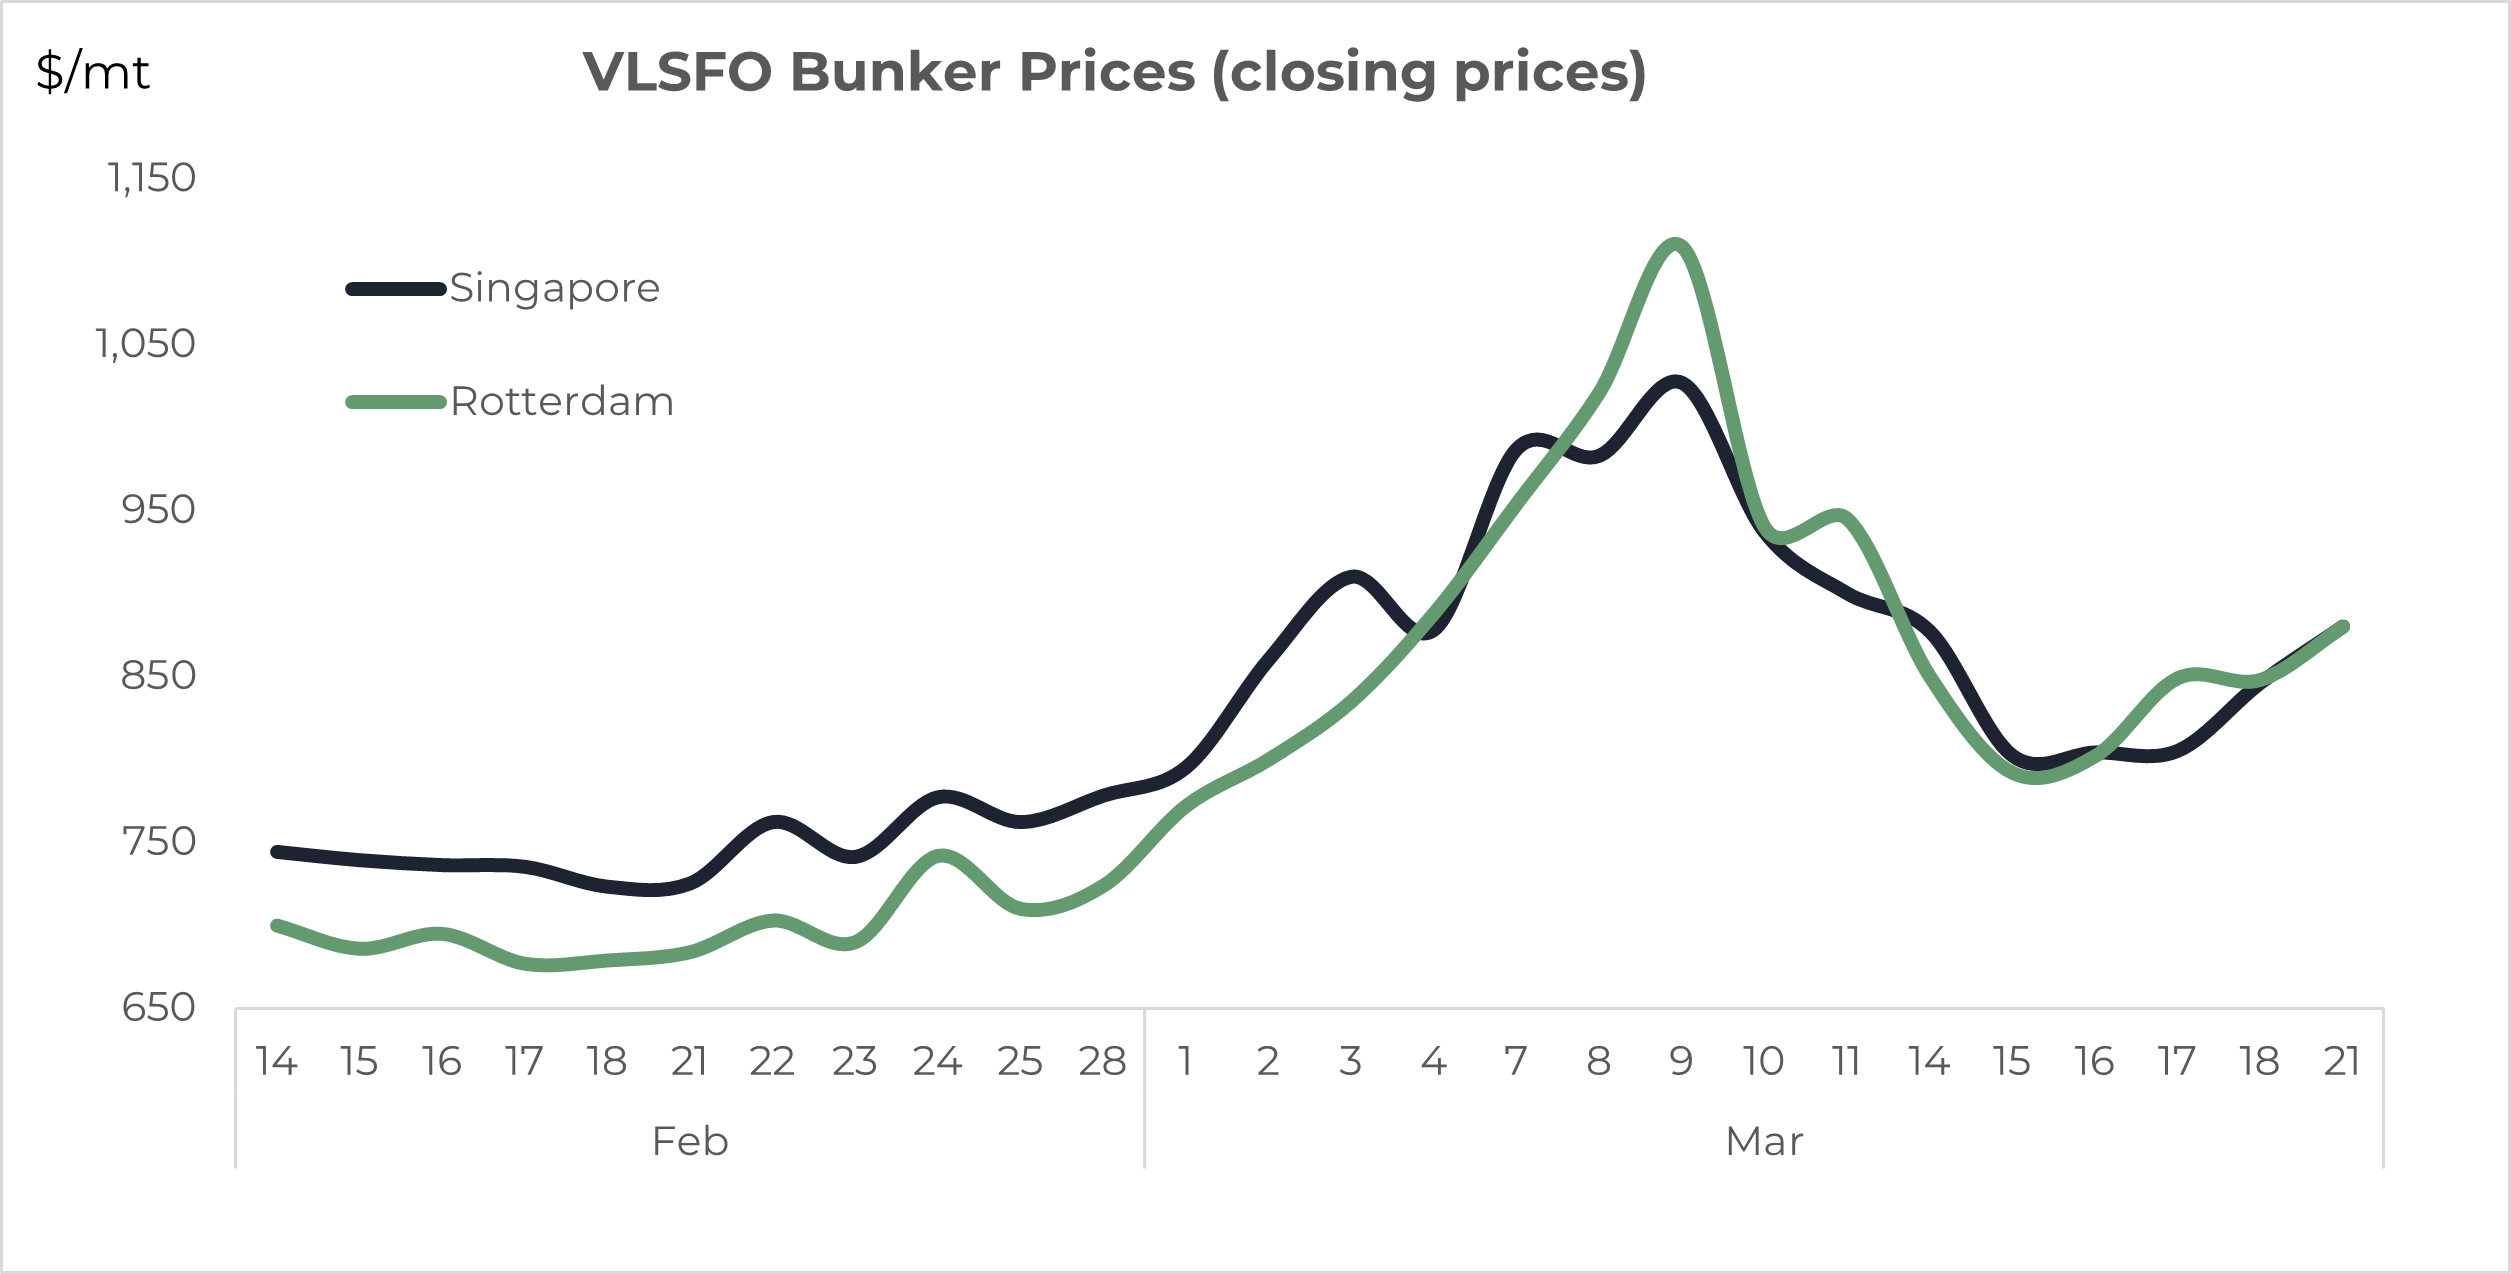
Just four weeks ago we wrote about Singapore VLSFO prices being at an all-time high of $765/mt. Since then, Singapore prices have hit $1,027/mt and Rotterdam prices have been even higher at $1,109/mt. The reasons are obvious and bunker prices clearly continue to move around developments and expectations surrounding the war in Ukraine.
We can only look at the microcosm of our own markets within what are the more extreme, far-reaching and horrific events in Ukraine, but bunkers are a global market, with crude prices tending to underpin our sector.
Since hitting more than $1,000/mt on March 9th, VLSFO prices have eased back on the prospects of weaker Chinese oil demand because of the recent surge in covid cases and major city lockdowns. The potential for higher oil supply and the release of strategic stocks from other countries has also taken some sting out of the market. However, the war in Ukraine continues and we are still facing huge challenges operating in such a volatile and uncertain market.
Source: Integr8 Fuels Read More
VLSFO above $1,000/mt
Just four weeks ago we wrote about Singapore VLSFO prices being at an all-time high of $765/mt. Since then, Singapore prices have hit $1,027/mt and Rotterdam prices have been even higher at $1,109/mt. The reasons are obvious and bunker prices clearly continue to move around developments and expectations surrounding the war in Ukraine.
We can only look at the microcosm of our own markets within what are the more extreme, far-reaching and horrific events in Ukraine, but bunkers are a global market, with crude prices tending to underpin our sector.
Since hitting more than $1,000/mt on March 9th, VLSFO prices have eased back on the prospects of weaker Chinese oil demand because of the recent surge in covid cases and major city lockdowns. The potential for higher oil supply and the release of strategic stocks from other countries has also taken some sting out of the market. However, the war in Ukraine continues and we are still facing huge challenges operating in such a volatile and uncertain market.
Source: Integr8 Fuels
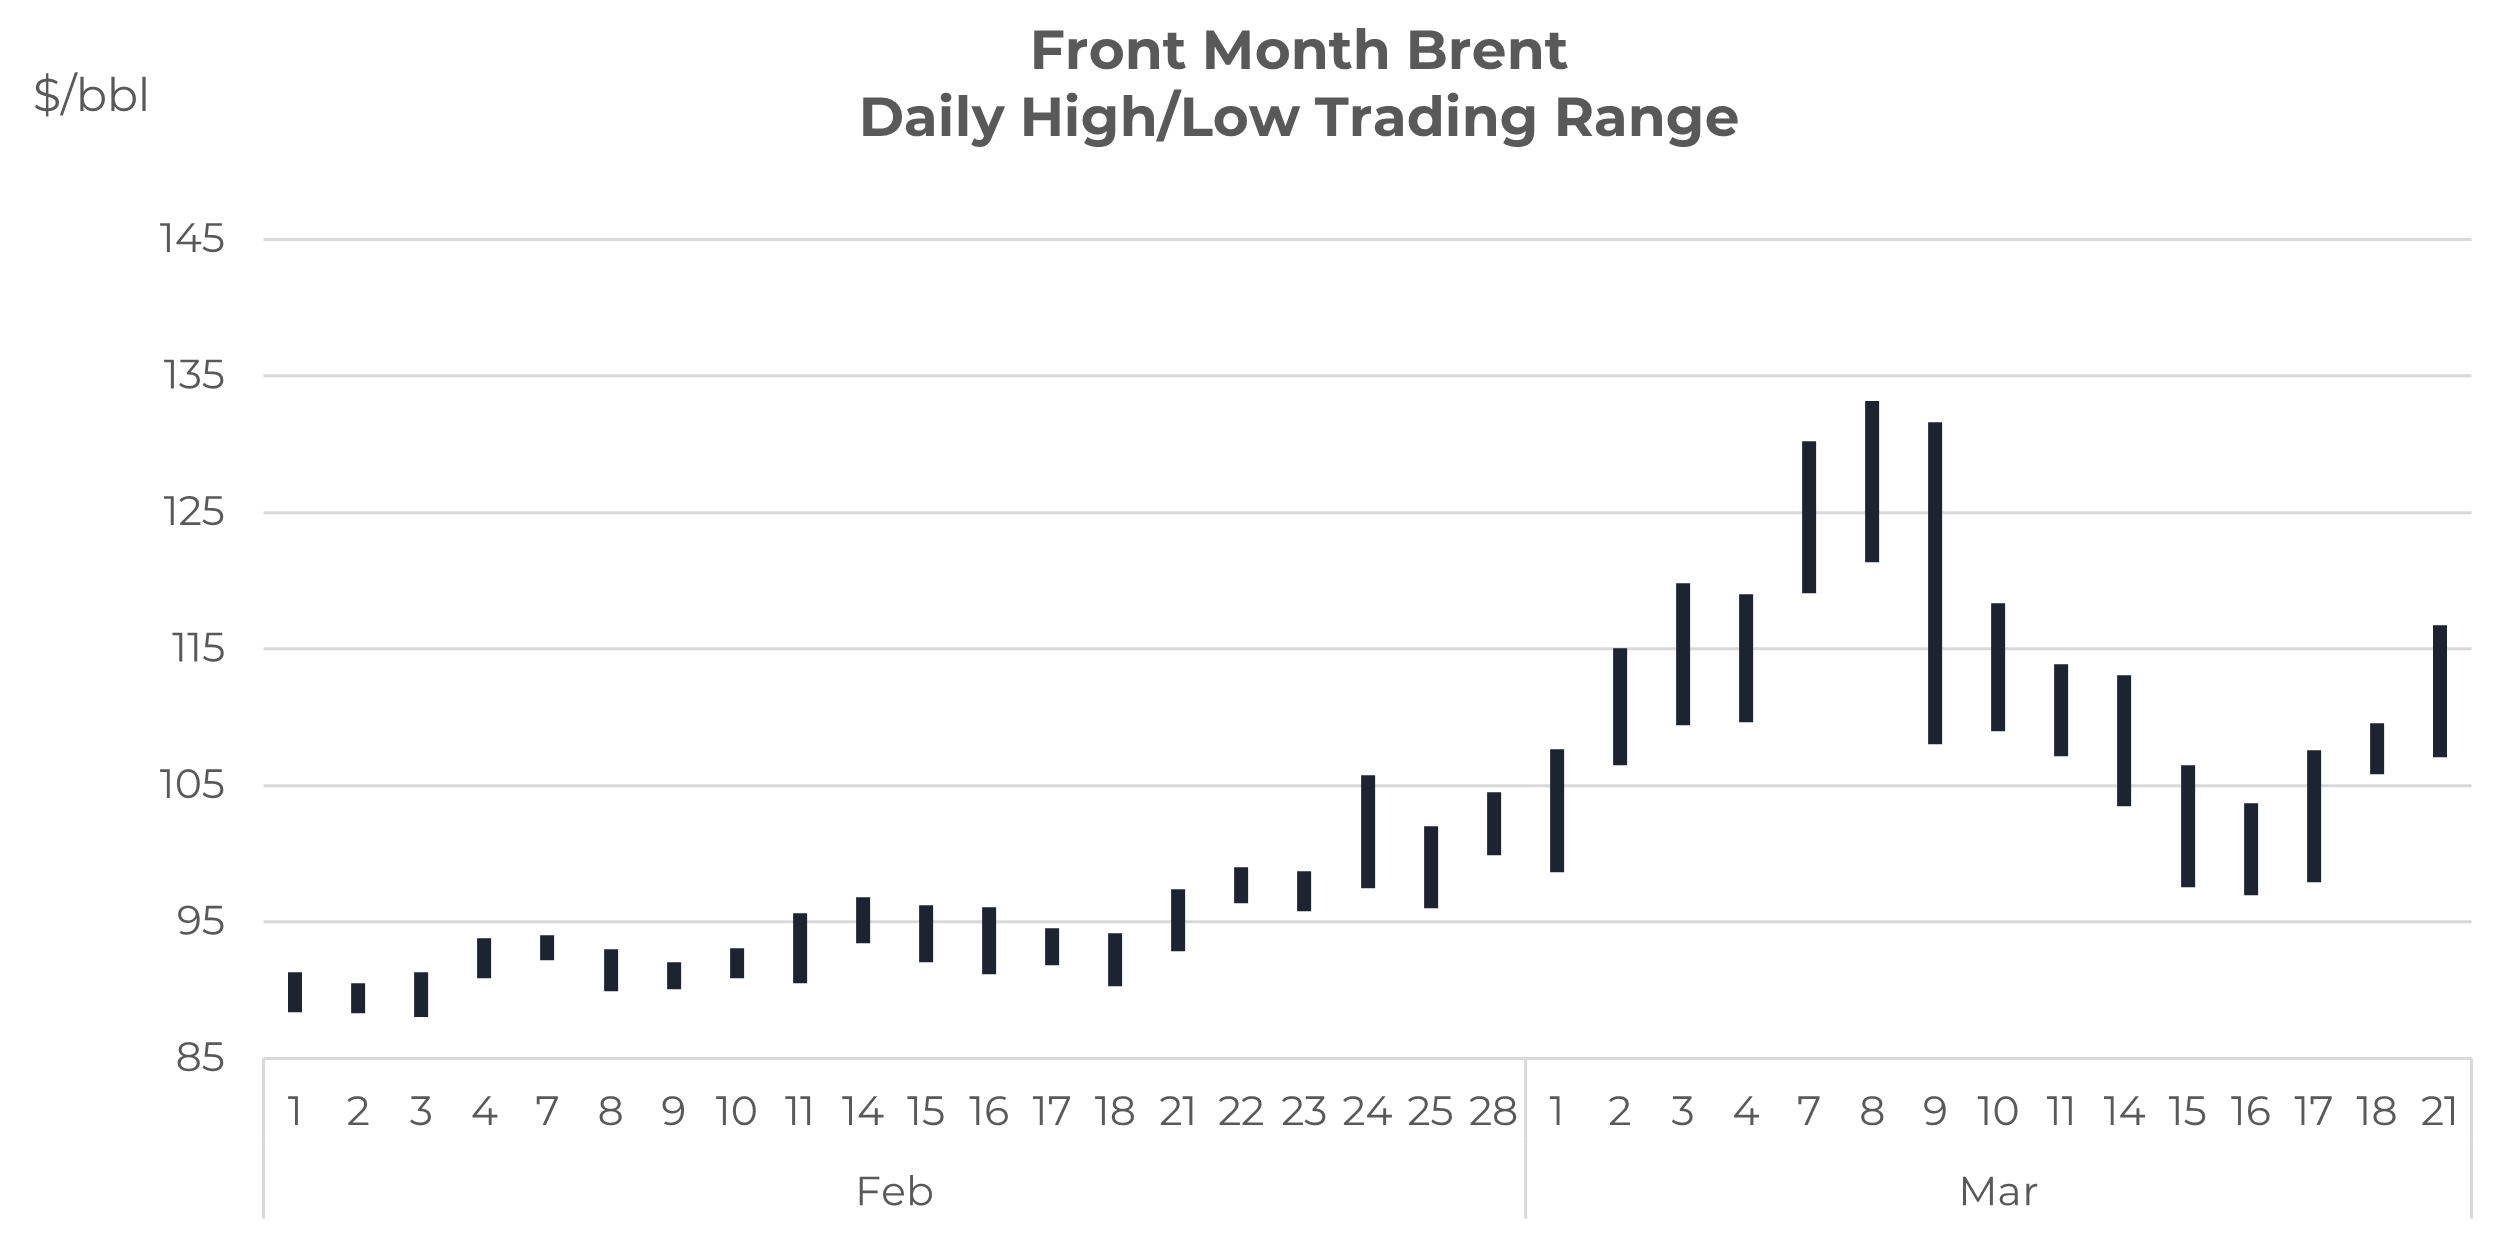
Bunker prices have been moving by more than $50/mt within a day
Not only have buyers and sellers in the bunker market been faced with this huge rise in prices since the Russia invasion, but the volatility within each day’s trading has been enormous. The graph below illustrates the price range and volatility in Brent front month futures each day since the beginning of February.
 Source: Integr8 Fuels
Before the invasion, Brent futures were trading in the high $80s and the daily high/low spread was around $2/bbl. This was equivalent to a daily price volatility of around $13/mt on bunkers. Volatility has been a quantum leap higher since the invasion, with the average daily high/low range in the Brent market reaching $9/bbl, which is equivalent to a daily movement of close to $60/mt on bunkers! This is still the case and a real challenge – At its peak, Brent varied over a $20/bbl range in just one day (March 9th) and this was equivalent to some $150/mt in the bunker sector.
These developments have forced a shift in buying and selling bunkers, where prices may only be quoted on firm enquiries, validities on price quotes may only last a few minutes and all with much tighter credit terms in such a high price world.
Rotterdam bunker prices are now at, or above Singapore
Regional variations in price do take place and clearly the closer proximity of Western Europe to Ukraine and Russia has led to the unusual position of Rotterdam bunkers moving above Singapore quotes.
This position of Rotterdam at or above Singapore prices is new and could continue, based on heavy restrictions on Russian crude exports to Europe. This is likely to come either through current circumstances where companies are unwilling to take or deal in Russian cargoes or through more formal sanctions. Either way, Europe is the most vulnerable market to the loss in Russian oil supplies and this has pushed prices in Europe even higher than in other international markets.
Historically, VLSFO prices in Singapore have typically been $20-30/mt above Rotterdam. Towards the end of last year crude oil prices increased and VLSFO strengthened even further relative to crude, and this pushed the Singapore premium to Rotterdam out to $60/mt. The events in Ukraine have unwound all of this, with Singapore and Rotterdam VLSFO prices now in line.
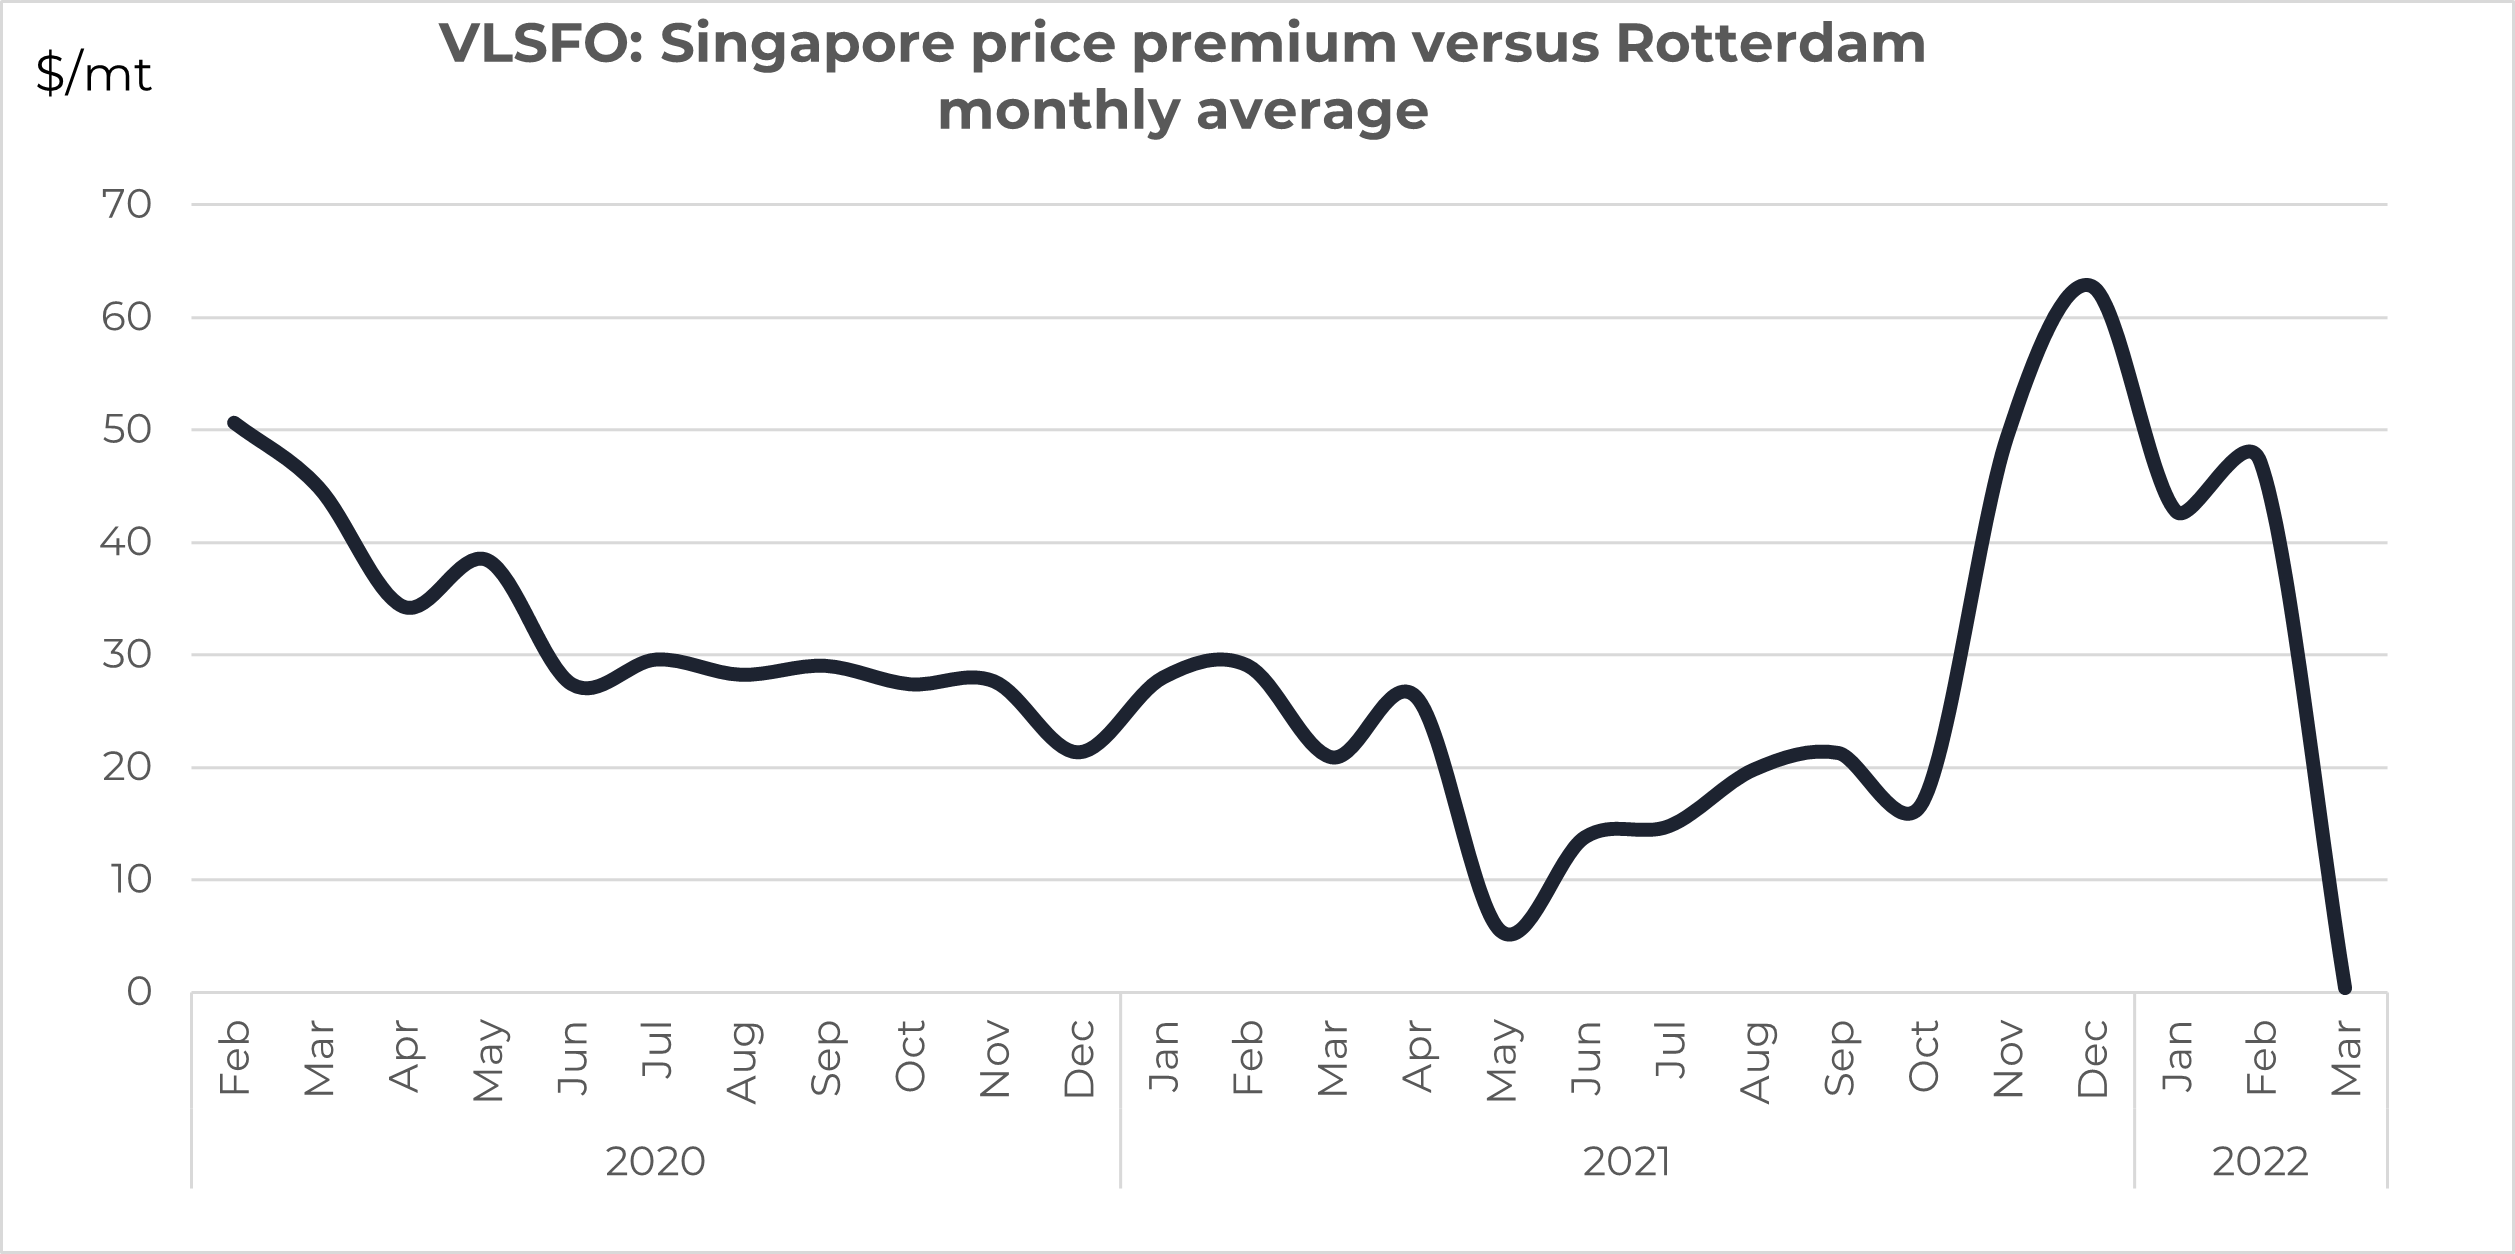
Source: Integr8 Fuels
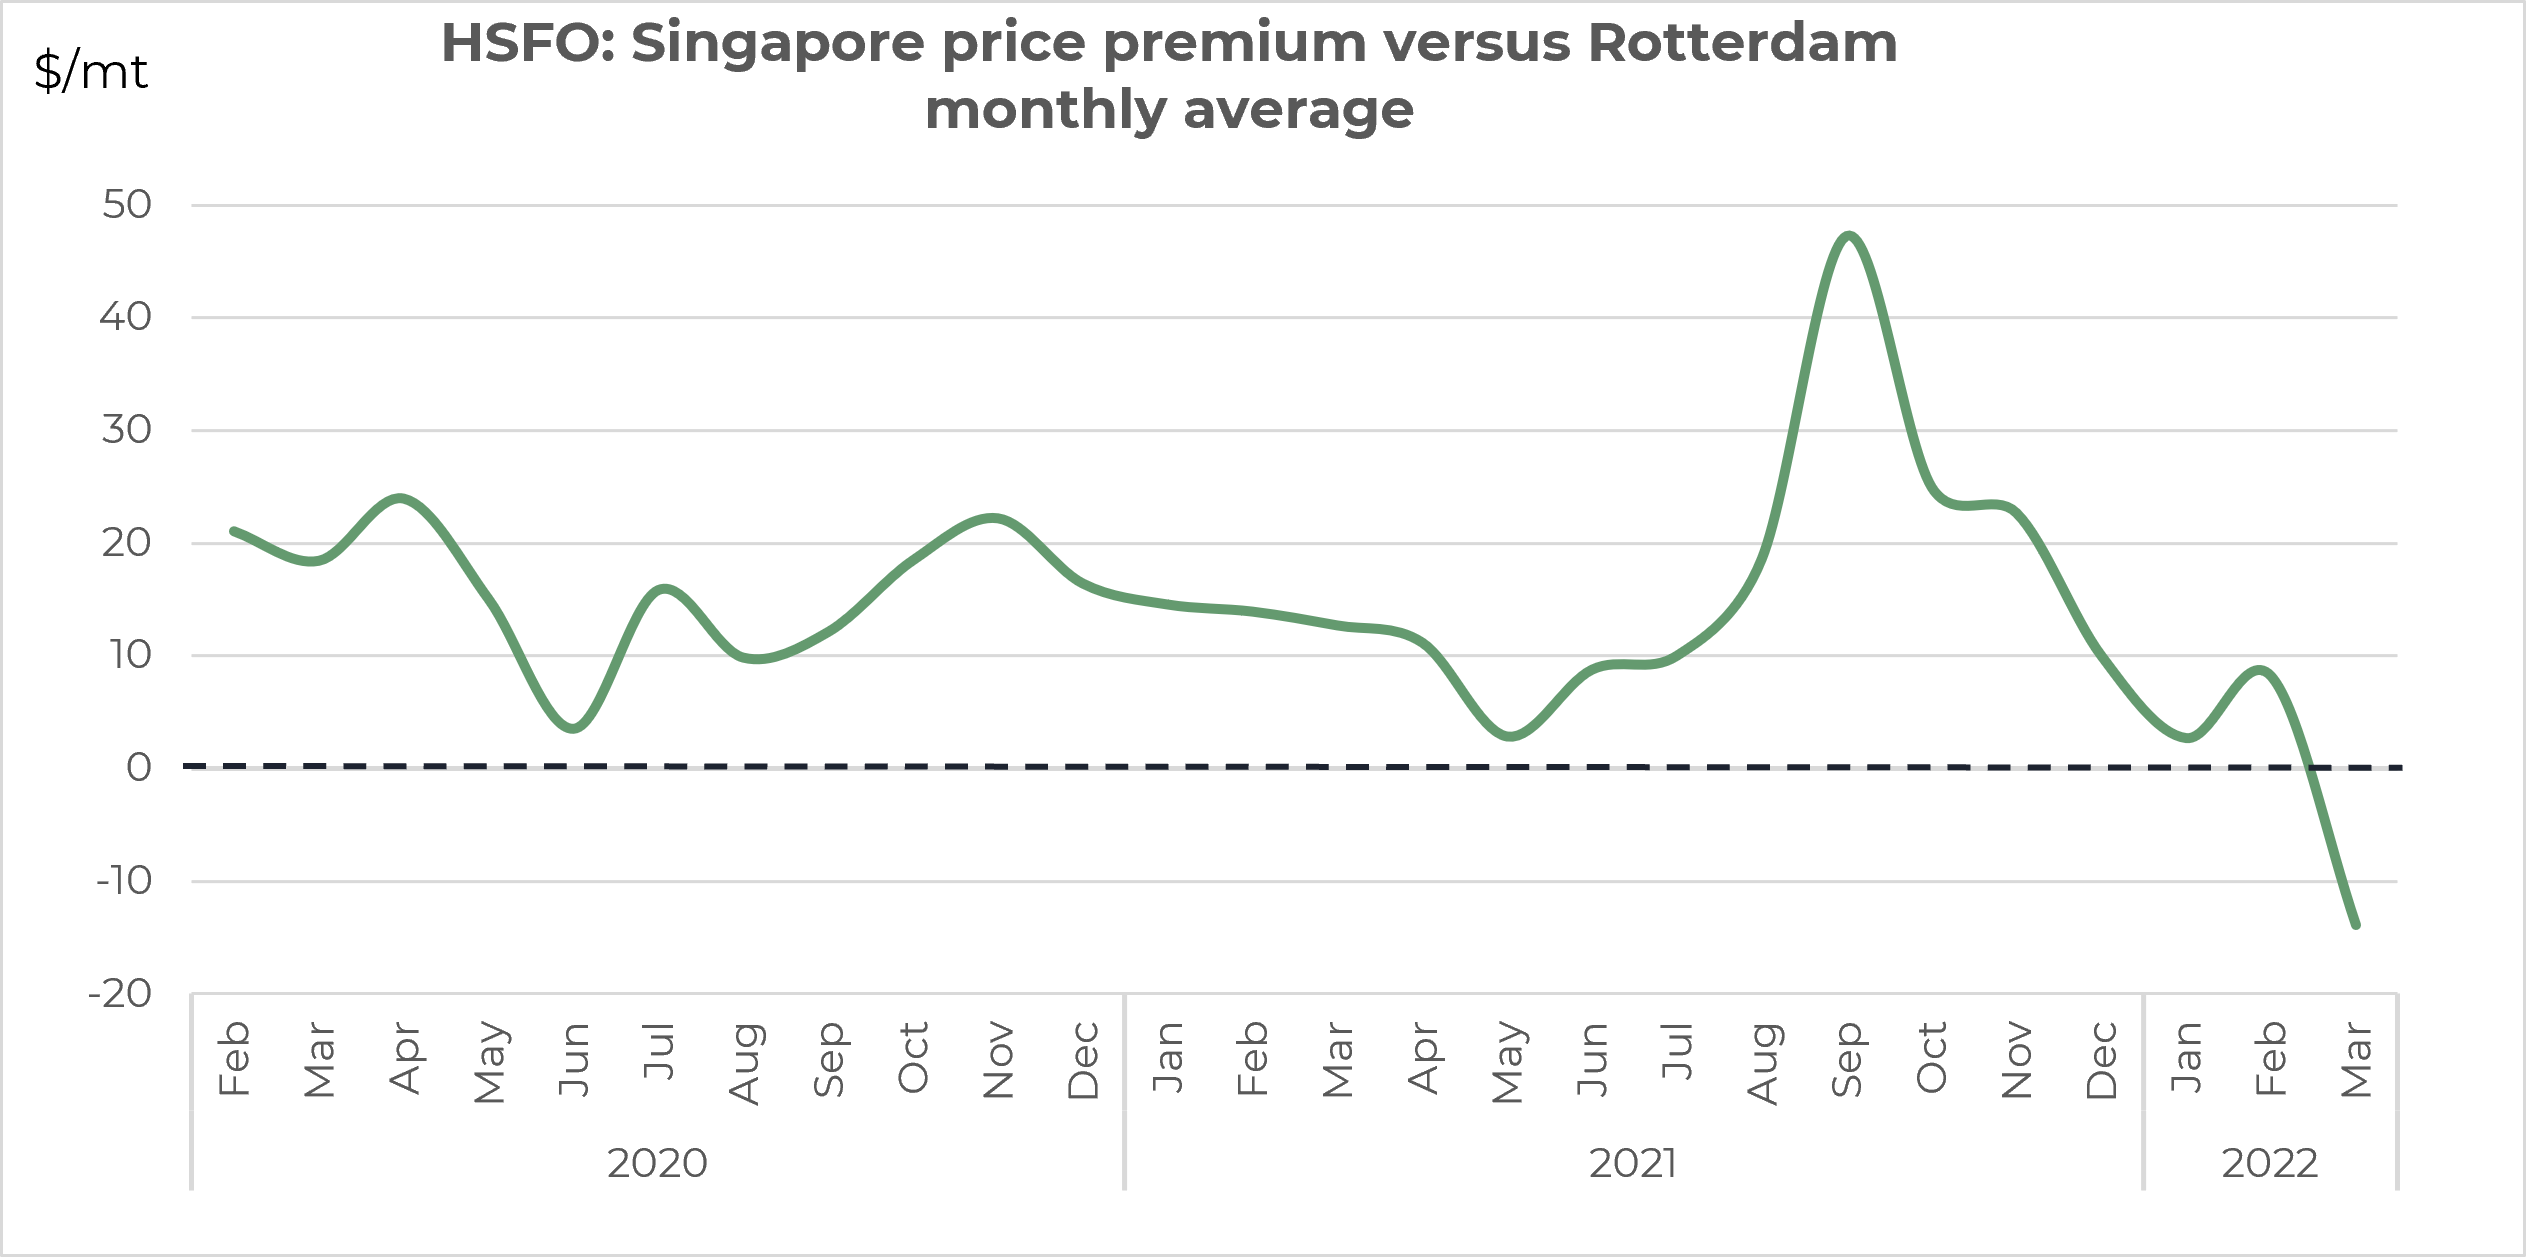
The swing in the HSFO price relationship is equally dramatic. Historically, Singapore HSFO has been around $10-20/mt above Rotterdam. This hiked to around $45/mt last year however, since the Russian invasion the relationship has completely reversed and Rotterdam prices are now above Singapore. So far this month Rotterdam HSFO has averaged $14/mt more than Singapore, with the current price relationship even more extreme and Rotterdam HSFO prices $35/mt above Singapore.
Source: Integr8 Fuels
All bunker markets are threatened, Europe is most exposed
These shifts in prices and price relationships are explained by the Russian invasion. At the end of last year Russia exported around 5 million b/d of crude and 2 million b/d of products, with two-thirds of these volumes going to Europe.
In the 5 million b/d Russian crude export market, around 3 million b/d went to Europe (via the Baltic Sea, Black Sea and Druzbha pipeline). The high dependence goes both ways, with the 3 million b/d of Russian crude going in to Europe accounting for one-third of all crude imports into the continent, stressing the current tightness in the European market. In comparison, Russian crude to the US only accounts for around 5% of their total imports, and Russian trade to Asia has been far less affected.
The same story is apparent for oil products, with the majority of Russian exports going to Europe, and Europe relying on Russia for almost 40% of all its total product import requirements.
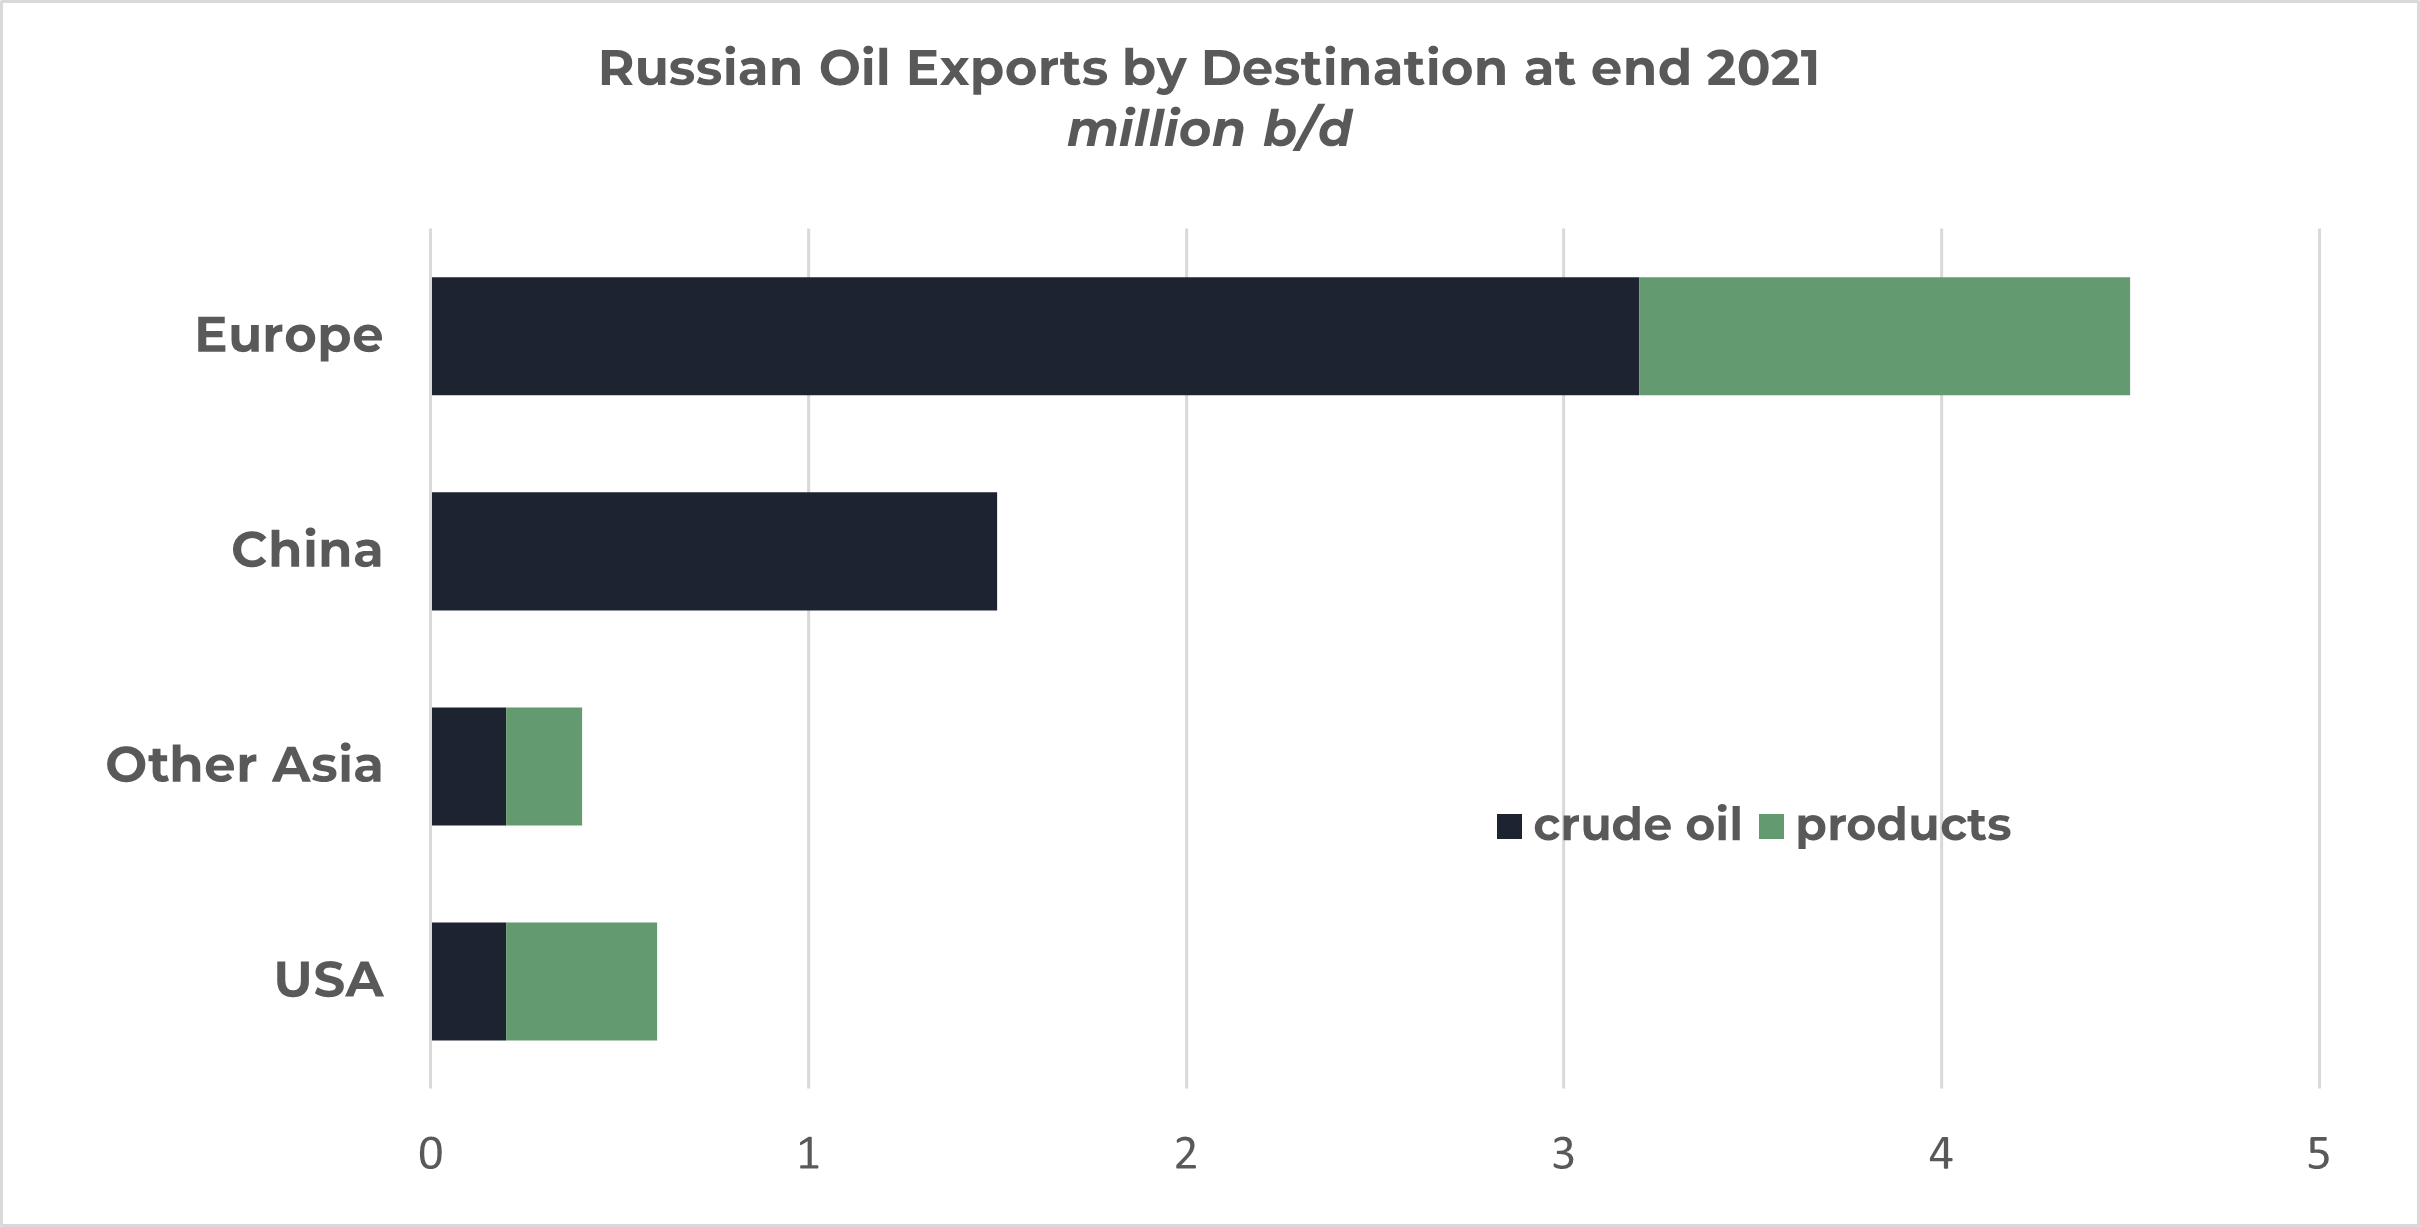
Source: Integr8 Fuels
In fact, the Russian diesel/gasoil export market is also having a major impact on the Rotterdam market, with more Russian volumes going on shorter haul trades to Germany and Poland, with lower volumes getting further west into France, the UK and Rotterdam. In addition, the European refining system cannot easily make up for the shortfall in Russian diesel/gasoil either in upgrading capacity or the limited ability to use alternative crude supplies. The situation is likely to be exacerbated in the short term as European refiners go into their seasonal spring maintenance programs; even if some refiners can delay maintenance, this will not solve the European gasoil tightness.
Hence, Europe’s heavy reliance on Russian crude and products has had a major and disproportionate impact on relative bunker prices in Rotterdam, with price rises even greater than the steep increases seen in other international markets. It is very difficult to see a quick return to previous levels of Russian oil trade to Europe, and so this shift between European and Singapore bunker prices could be a continuing feature for now.
At the moment Russia is having to heavily discount its selling prices to get oil volumes sold and the chances are these volumes will end up in Asia. In the longer-term it will be the trading relationship between Russia and Europe, and any resulting shift in trading patterns that will determine if there is a structural change in the Rotterdam/Singapore price relationship. Global trade is a balancing factor and we will have to see what happens to European fuel oil flows to Asia and/or Middle East product exports and if these are pulled from eastern destinations to western destinations.
Other things are happening however, will take a ‘back seat’…
There are other factors influencing prices at the moment, including:
• The major surge in covid cases in China (to a 2 year high) and the lockdowns in a number of major Chinese cities, including Shanghai;
• The global negative impact on oil demand from much higher oil, energy, food and retail prices leading to much higher inflationary pressures and lower GDP figures;
• How the global oil supply/demand picture may unfold, with lower demand expectations, lower supply volumes out of Russia and the OPEC+ group sticking to its current agreement and limiting any supply increase, despite very high prices;
• What is happening in the possible easing in Iranian sanctions.
For now, the focus has to be on the situation in Ukraine and its outcome, and where international relations with Russia end up.
Steve Christy, Research Contributor
E: steve.christy@integr8fuels.com
Download this article as a PDF »
VLSFO Prices Are At An All-time High – Politics Have Trumped Oil Fundamentals
February 22, 2022
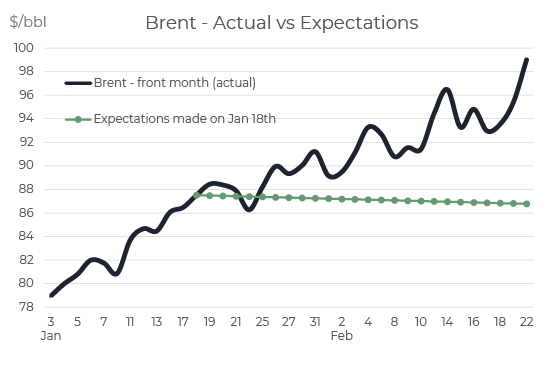
Brent is close to $100/bbl - Around $12/bbl higher than expected
Last month we outlined all the fundamental reasons why Brent crude prices were justified in the $80 region and why prices were expected to fall to the $70s in the second half of this year (and that bunker prices would follow the trend). We ended the note with a brief caveat on the politics around Russia and around Iran; clearly the caveat has kicked in and geopolitics have come to the forefront and taken oil prices up another level, with Brent futures in the range of $96 - $99/bbl.
Source: Integr8 Fuels
The political and military developments in Russia/Ukraine, talk of an imminent invasion and the very recentheightened tensions have pushed prices way above the expectations made a month ago.
Brent front month futures have been trading within a range of $96 - $99/bbl, and physical Brent has moved well above the ‘magical’ $100/bbl marker. It’s a reminder that fundamental analysis typically gives us the basis for price direction, but military and political threats trump the fundamentals. Read More
Brent is close to $100/bbl – Around $12/bbl higher than expected
Last month we outlined all the fundamental reasons why Brent crude prices were justified in the $80 region and why prices were expected to fall to the $70s in the second half of this year (and that bunker prices would follow the trend). We ended the note with a brief caveat on the politics around Russia and around Iran; clearly the caveat has kicked in and geopolitics have come to the forefront and taken oil prices up another level, with Brent futures in the range of $96 – $99/bbl.
 Source: Integr8 Fuels
The political and military developments in Russia/Ukraine, talk of an imminent invasion and the very recent
heightened tensions have pushed prices way above the expectations made a month ago.
Brent front month futures have been trading within a range of $96 – $99/bbl, and physical Brent has moved well above the ‘magical’ $100/bbl marker. It’s a reminder that fundamental analysis typically gives us the basis for price direction, but military and political threats trump the fundamentals.
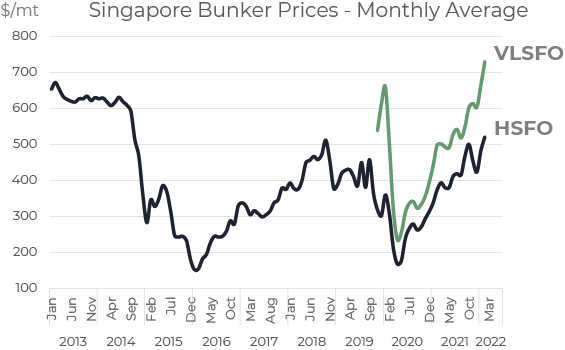
VLSFO prices are at all-time highs – Around $80/mt more than expected
Crude sets the underlying price for all oil products, and bunker prices have moved in line with Brent. It means that VLSFO prices in Singapore have been quoted in the range $750 – $770/mt, which is at an all-time high; even higher than the early January 2020 ‘introductory’ prices.
Singapore HSFO prices have also risen sharply, and averaged $520/mt so far this month, and at the time of writing are being quoted between $540 – $550/mt. You have to go back more than 7 years (to Oct 2014) to see higher prices; buying bunkers at the moment is an expensive business.
Source: Integr8 Fuels
The easy political analysis
Looking ahead, we are in the realms of the ‘known unknowns’; you don’t have to be much of a political analyst to suggest if Russia invades Ukraine, then oil and bunker prices are likely to go even higher and if an agreement or military withdrawal is reached then prices will go lower. In the big picture, we are now focused on the news briefings rather than the oil fundamentals.
Oil fundamentals still tell us something
However, it is still worth scratching below the surface of the fundamentals, just to see what responses the oil markets have come up with. Whether by design, or constraints, the short answer to this question is ’Nothing’. OPEC (and more recently OPEC+) has historically taken the role of managing oil prices, and $100/bbl crude has been seen as too high. At these levels we would have expected OPEC to boost oil production to take the ‘sting’ out of the market, but this hasn’t happened. In reality it is only Saudi Arabia, Kuwait and the UAE that are likely to have significant spare production capacity and able to boost output, with Iraq and Russia possibly also able to produce a bit more.
The current OPEC+ agreement is unwinding, but production increases are falling short of the planned expansion. In January it is estimated the group produced 0.9 million b/d less than the overall agreement. It seems a number of the OPEC+ countries cannot hit their targets because of ‘insufficient’ upstream spending and those countries with spare capacity are not willing to make up the production shortfall.
It’s politics coming at us from all angles
This again, emphasises the political dilemmas; the US would want the Saudis to boost oil production to ease oil prices, but the Saudis are in what can be considered as a successful alliance with the OPEC+ countries, and this includes Russia.
Keeping with the political theme, and the assumption most economically powerful countries want lower oil prices, it begs the question if the US will work more aggressively to get an agreement with Iran and so potentially open up another 1 million b/d of crude supply. Indirect talks between the US and Iran (in Vienna) are reportedly in their final stages, although these ‘final stages’ have been going on for some time. Iran is demanding that major sanctions
are lifted and legal assurances the US will not exit the deal again. A Washington comment is that this would be impossible, but the Russian/Ukraine situation is likely to give Iran a stronger negotiating stance.
Agreements are clearly a huge challenge at any time, but today the US is at the centre of two; Russia/Ukraine and the Iranian nuclear position. Even if there are solutions, there is also very often a political fall-out. With the US, Russia, China, Saudi Arabia and Iran all having a position, it’s going to take more of a political analyst to unravel any combination of alliances and discords between these five countries and what impacts they may, or may not have on oil prices.
Clearly an invasion of Ukraine is an extreme outcome and, bringing it down to our markets, prices would rise even further. However, a pull-back by Russia, and/or a successful summit between Russia and the US would obviously ease the situation and lower prices.
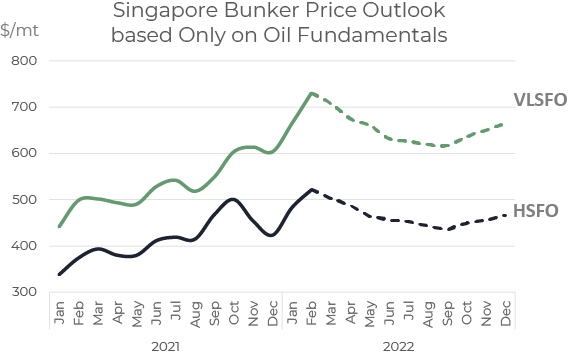
Let’s at least start with a ‘fundamental’ price forecast
A whole range of price outlooks can be determined using various scenarios around different geopolitical outcomes, but as a starting point, the graph below illustrates a bunker price outlook based purely on an oil fundamental viewpoint. The general sentiment here is slightly firmer than a month ago, with a starting point of lower oil product stocks; demand prospects a bit strong and supply developments a bit weaker. We could take this as a base position
and increase the price forecasts depending on any perceived or actual political or military threats, wherever they may take place.
 Source: Integr8 Fuels
At the moment, this price forecast would seem to set a floor. The conclusion this time round is the main price drivers are geopolitical, and the caveat is the relatively tight oil fundamentals.
Steve Christy, Research Contributor
E: steve.christy@integr8fuels.com
Download this article as a PDF »
High LNG prices boost conventional bunker demand, scrubbers stand to benefit
February 10, 2022
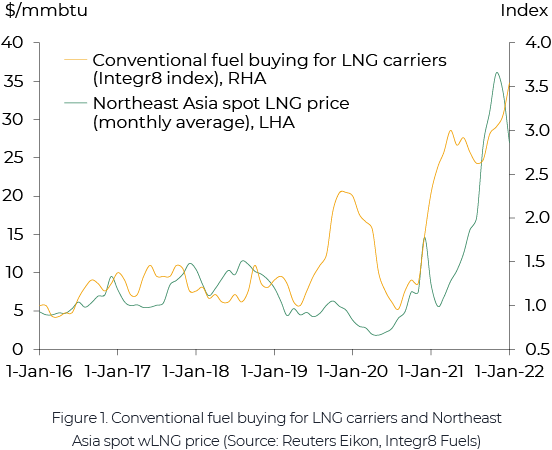
Less than two years ago countries across the world were closing their borders and locking down cities to stop the spread of Covid-19. Very few analysts could foresee crude oil going from below $20/bbl back then to almost touching the $100/bbl mark currently and gas prices staging an even more impressive comeback, from below $2/mmbtu in May 2020 for spot LNG in Northeast Asia to almost $50/mmbtu at the end of December 2021. While gas prices have retreated from their recent peaks, they remain very high historically. This is pushing owners of LNG carriers to burn cheaper conventional fuels adding to the growth in oil products demand. One “side effect” of such growth is more high sulphur fuel oil availability which widens the price spread between low and high sulphur marine fuels thus benefitting the scrubber tonnage.
LNG carriers increasingly burn conventional fuels
With high gas prices, LNG carriers are increasingly burning cheaper VLSFO and LSMGO and Integr8 Fuels have seen a growing number of such enquiries in recent months. Figure 1 (below) compares an index compiled by Integr8 Fuels showing an increase in the volume of conventional bunker fuels bought by LNG carriers with how this increase coincided with the rise in LNG prices. There was however a spike in buying interest around the start of 2020 despite low LNG prices, which can potentially be attributed to the IMO 2020 switch given the supply and price uncertainties at the time. The nature of LNG shipping is that gas tends to boil off at a certain rate during the voyage, so the majority of LNG carriers are built capable of burning this boil-off gas as bunkers, rather than releasing it into the atmosphere, along with conventional fuels.
Historically, most of the time LNG prices, adjusted for the energy content, stayed below conventional bunker fuel prices with the LNG carrier bunker fuel mix skewing sharply towards boil-off gas and only supplemented by conventional fuels depending on a number of commercial and operational factors. Figure 2 shows how LNG lost its price competitiveness to MGO (and thus to a greater extent VLSFO) resulting in LNG vessel operators minimising the use of boil-off (which has now more value as cargo) and increasing purchases of VLSFO and LSMGO.
Read More
Less than two years ago countries across the world were closing their borders and locking down cities to stop the spread of Covid-19. Very few analysts could foresee crude oil going from below $20/bbl back then to almost touching the $100/bbl mark currently and gas prices staging an even more impressive comeback, from below $2/mmbtu in May 2020 for spot LNG in Northeast Asia to almost $50/mmbtu at the end of December 2021. While gas prices have retreated from their recent peaks, they remain very high historically. This is pushing owners of LNG carriers to burn cheaper conventional fuels adding to the growth in oil products demand. One “side effect” of such growth is more high sulphur fuel oil availability which widens the price spread between low and high sulphur marine fuels thus benefitting the scrubber tonnage.
LNG carriers increasingly burn conventional fuels
With high gas prices, LNG carriers are increasingly burning cheaper VLSFO and LSMGO and Integr8 Fuels have seen a growing number of such enquiries in recent months. Figure 1 (below) compares an index compiled by Integr8 Fuels showing an increase in the volume of conventional bunker fuels bought by LNG carriers with how this increase coincided with the rise in LNG prices. There was however a spike in buying interest around the start of 2020 despite low LNG prices, which can potentially be attributed to the IMO 2020 switch given the supply and price uncertainties at the time. The nature of LNG shipping is that gas tends to boil off at a certain rate during the voyage, so the majority of LNG carriers are built capable of burning this boil-off gas as bunkers, rather than releasing it into the atmosphere, along with conventional fuels.
Historically, most of the time LNG prices, adjusted for the energy content, stayed below conventional bunker fuel prices with the LNG carrier bunker fuel mix skewing sharply towards boil-off gas and only supplemented by conventional fuels depending on a number of commercial and operational factors. Figure 2 shows how LNG lost its price competitiveness to MGO (and thus to a greater extent VLSFO) resulting in LNG vessel operators minimising the use of boil-off (which has now more value as cargo) and increasing purchases of VLSFO and LSMGO.
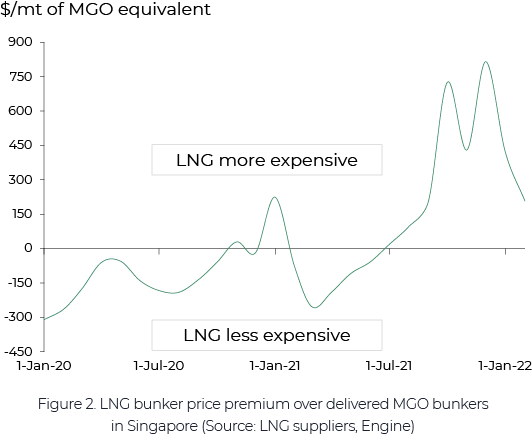
On an MGO equivalent, LNG bunker prices in Singapore were up to $200/mt more expensive than MGO at the end of January. This price spread was as wide as $800/mt back in December before narrowing more recently. Elsewhere in the world LNG bunkers are even more expensive with Rotterdam and West Mediterranean quotes seen at a $50/mt and $450/mt premium to Singapore respectively.
All of this currently makes conventional bunkers an obvious choice for LNG carriers thus adding to global oil products demand growth.
LNG bunker switch contributes to global oil products demand growth
While gas prices are likely to ease off going into Q2 they are still expected to remain at much elevated levels historically. This means that the likelihood of a prolonged period of LNG carriers running on conventional fuels remains relatively high.
While the switch takes some demand off from LNG, it contributes to VLSFO and LSMGO demand. With the global LNG fleet of around 620 vessels and having taken out the vessels that can only burn conventional fuels, we applied fuel consumption, gasoil to fuel oil buying ratios, LNG to conventional fuels switch estimates and the differences in the energy content to come up with an approximation of how much extra oil products demand this switch can add (Figure 3).
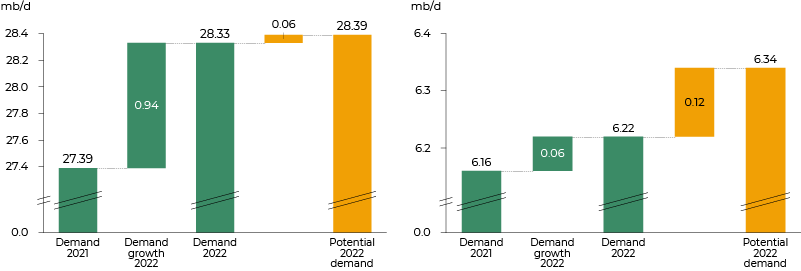 Figure 3. Global gasoil (left) and fuel oil (right) demand growth position (Source: Wood Mackenzie, Integr8 Fuels)
Hypothetically and if sustained for a year, the LNG to conventional fuels switch could potentially add an extra 60,000 b/d to gasoil demand (through LSMGO) and 120,000 b/d to fuel oil demand (through VLSFO). In reality, gasoil demand additions should be somewhat higher and fuel oil lower as VLSFO in itself is a hybrid fuel. While the extra demand from the LNG to conventional fuels switch is likely to be just over 6% of the growth expected in 2022 for gasoil, it is much higher in the case of fuel oil.
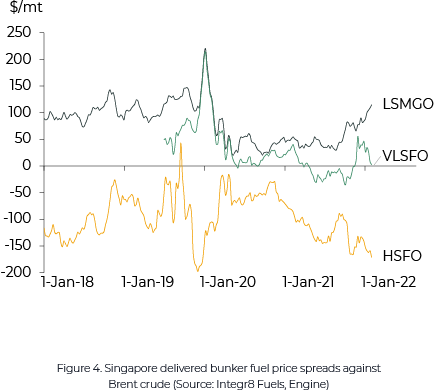
Figure 4 (below) shows Singapore delivered LSMGO, VLSFO and HSFO prices relative to Brent crude oil. While the LSMGO to Brent spread increased to the levels last seen before Covid-19, the HSFO spread decreased to the lowest in four years, excluding the short period of time during the IMO2020 when it was slightly lower still. Higher gasoil demand results in a wider gasoil spread to Brent pushing refineries to increase production. While it is often possible to slightly adjust refinery configuration to yield more gasoil, the increase in its output often comes with processing more crude oil. This in turn results in a higher fuel oil output which weighs on HSFO prices.
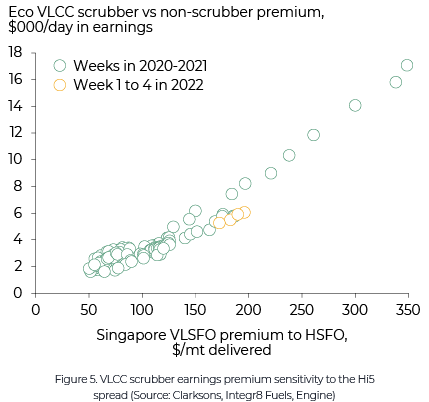
By the end of January 2022, the spread between Singapore LSMGO and HSFO increased to $286/mt, up from $134/mt this time last year. The spread between VLSFO and HSFO, often called the Hi5 spread, has also increased from $118/mt to $168/mt. With the wider Hi5 spread, scrubber vessels stand to benefit. For example, scrubber fitted VLCCs have been earning almost double their non-scrubber fitted counterparts. This has helped prevent their owners from straying too far from breakeven levels.
Figure 5 (also below) shows that in the 4 weeks of January 2022 VLCCs with scrubbers had an earnings advantage of between $5,000/day and $6,000/day with only a handful of weeks back in early 2020 when a winder Hi5 spread resulted in larger scrubber premiums.
Where do we go from here?
Overall, while spot freight rates dropped, higher LNG prices pushed more LNG owners to increasingly burn conventional fuels adding to recovering gasoil and fuel oil demand. In the meantime, scrubber fitted vessels benefitted from the widening of the sulphur spread in bunkers.
While previously the global gas market had a stronger connection with oil, this link has been weaker recently. There are a number of factors that may affect both markets and the competitiveness of conventional fuels compared with LNG going forward. On one hand, unseasonably low gas inventories and the uncertainty surrounding the commissioning of a gas supply pipe from Russia to Germany provide support to gas prices. On the other hand, the expectation that OPEC and non-OPEC countries will continue increasing oil production may bring oil prices lower. If this is the case, we may continue to see interest from owners of LNG fleets to buy more conventional fuels than they normally do, particularly as the winter heating season in the Northern hemisphere is not just over yet.
Anton Shamray, Senior Research Analyst
Download this article as a PDF »
Not all price falls are equal – Certainly not in bunkers
December 16, 2021
We thought it might take 6 months for crude to fall $10, but it only took a few days!
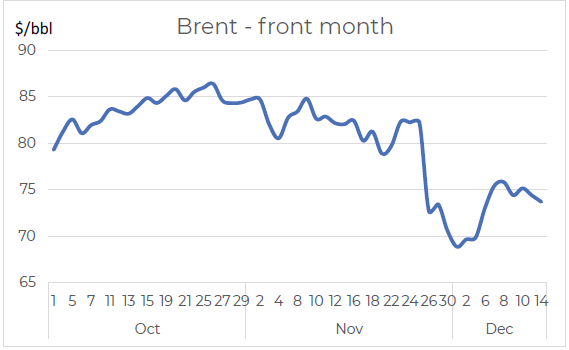
Things tend happen a lot faster in the market than we typically expect, and the past month has definitely been one of those periods. In mid-November we wrote about prices easing over the next 3-6 months, based on the global oil market moving from what had been long-run stock draws, to expectations of long-run stock builds. So, in mid-November we were talking about Brent falling from the low $80s to the low $70s over the next 6 months; in reality we only had to wait 2 weeks!
Source: Integr8 Fuels
The new Omicron variant was first reported on 24th November and raised immediate concerns of another wave of travel restrictions (or even partial lockdowns) and potentially reversing what had been sustained increases in global oil demand. At the same time, the OPEC+ group stuck to their planned, phased increases in production. The fundamentals almost always win out, and this story is one of ‘surplus’ oil and much bigger stock builds than previously thought. Read More
We thought it might take 6 months for crude to fall $10, but it only took a few days!
Things tend happen a lot faster in the market than we typically expect, and the past month has definitely been one of those periods. In mid-November we wrote about prices easing over the next 3-6 months, based on the global oil market moving from what had been long-run stock draws, to expectations of long-run stock builds. So, in mid-November we were talking about Brent falling from the low $80s to the low $70s over the next 6 months; in reality we only had to wait 2 weeks!
 Source: Integr8 Fuels
The new Omicron variant was first reported on 24th November and raised immediate concerns of another wave of travel restrictions (or even partial lockdowns) and potentially reversing what had been sustained increases in global oil demand. At the same time, the OPEC+ group stuck to their planned, phased increases in production. The fundamentals almost always win out, and this story is one of ‘surplus’ oil and much bigger stock builds than previously thought.
Brent futures prices fell by $13 In less a week, to below $70/bbl. There has been a bit of a subsequent rebound as OPEC+ hinted at a possible production cutback, even before their next scheduled monthly meeting, on January 4th. In addition, COVID concerns seem to have eased, with indications that vaccinations ‘can work’. However, current crude prices are still around $8/bbl lower than a month ago.
What has this meant for bunker prices?
Market prices for VLSFO and HSFO have reacted very differently over the past few months. VLSFO prices are strong, and premiums to Brent crude have recently hit 9-month highs, as VLSFO supply has been tight. This is because of:
- A ‘pull’ on refinery operations and components away from VLSFO and into the growing demand for other products;
- Strong winter demand for LSFO into the power generation sector, principally in Asia, but also taking place in Europe;
- A drop in LSFO imports into Singapore, from within Asia and also from the west.
All of this has resulted in very low stocks and a strong price premium for VLSFO. At the same time, HSFO supplies have increased as refinery throughputs have risen to meet the growing demand for other products. So, we have seen a tightness in VLSFO supplies and a complete contrast, of increasing volumes of HSFO, in line with increased refinery runs.
We have already highlighted the net $8/bbl drop in Brent over the past month, and the fundamental strength in VLSFO and weakness in HSFO. The outcome is that versus crude, the relative pricing of the two bunker grades have gone in completely opposite directions.
How big have these shifts in bunker prices been?
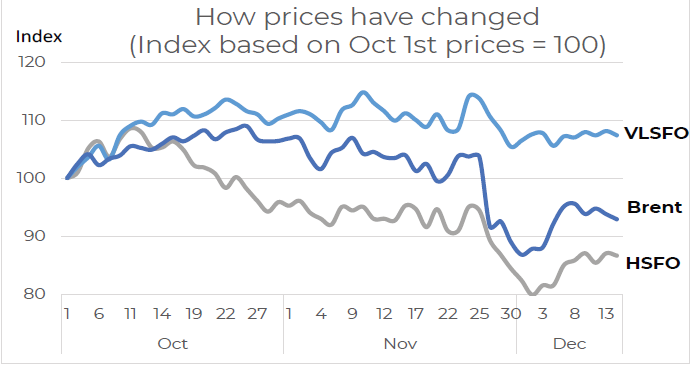
Using an index and taking October 1st prices as 100, VLSFO prices have been consistently higher than this starting point and are currently 7% higher than on October 1st; there has been no major collapse in VLSFO prices with the Omicron outbreak. Although Brent prices did move higher through October and November, there was an immediate collapse with the Omicron announcement, and although prices have rebounded since then, they are still 7% lower than at October 1st.
 Source: Integr8 Fuels
For HSFO the market moves have been even more dramatic. Unlike for VLSFO and Brent, even through October and November HSFO prices were falling below their October 1st levels, and the Omicron outbreak only drove prices even lower. Like crude, there has been some recent recovery, but today HSFO prices are almost 15% lower than at the start of October.
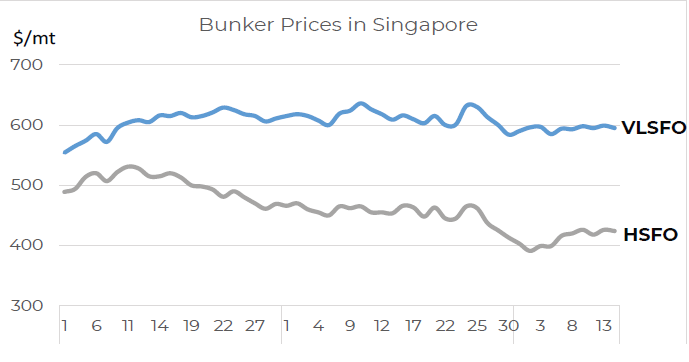
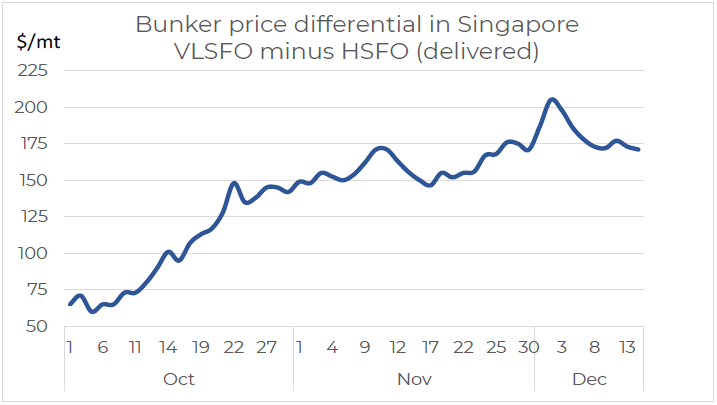
So, VLSFO prices are now 7% higher than early October and HSFO near 15% lower; the spread between the two grades has clearly widened enormously over the past 10 weeks. The graph below shows Singapore bunker prices in absolute terms, with VLSFO moving up and then consistently hovering around the $600/mt mark, and HSFO prices falling from at or just above $500/mt, to at or just above $400/mt now.
 Source: Integr8 Fuels
These fundamental drivers supporting VLSFO pricing and weakening HSFO prices have meant the differential between the two has moved from only $60 70/mt at the beginning of October to $175-200/mt this month.
 Source: Integr8 Fuels
A wider VLSFO/HSFO differential means stronger scrubber economics
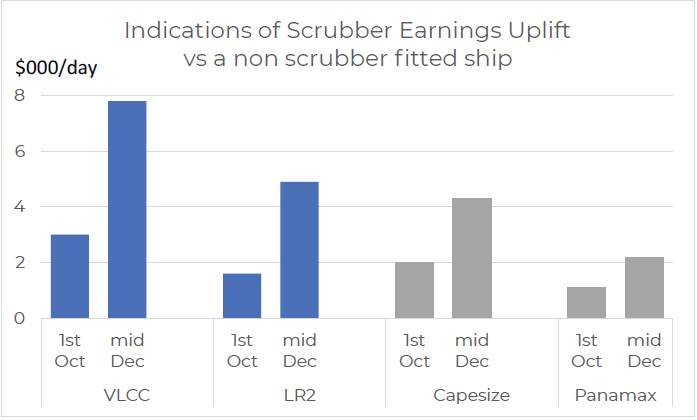
These shifts in pricing have clearly given a bigger advantage to those ships operating with scrubbers. There are a lot of variables involved in assessing the earnings uplift for scrubber fitted ships, but bunker prices are obviously a big one, followed by fuel consumption and the length of voyage.
Before the recent widening in the VLSFO/HSFO price differential, general indications were that the earnings uplift for representative tanker and dry bulk vessels fitted with scrubbers was around $1,000-3,000/day. Today those indications are almost three time greater and in the range $2,000-8,000/day, with the bigger figure for VLCCs and the smaller for Panamax dry bulk vessels.
 Source: Integr8 Fuels
Focusing on the tanker market, this scrubber uplift is hugely significant because it raises current average earnings indications from only $2,000/day for a non-scrubber fitted VLCC to around $10,000/day for a scrubber fitted one (still extremely low, but not as low as $2,000/day!). In the dry bulk sector, the gains are likely to seen as less significant, as the uplift is smaller and the market much stronger, with non-scrubber fitted capesize earnings around $35,000/day and a scrubber-fitted one close to $40,000/day.
Will the VLSFO/HSFO differential remain this this wide
The general tendency is likely to be, if oil demand is rising and refinery margins are strong, then the VLSFO/HSFO differential is likely to remain relatively wide. In this case there will be continuing pressures on supplies into the VLSFO blend and HSFO availabilities are likely to be in ‘surplus’, with higher refinery throughputs. However, if oil demand is really threatened by the Omicron variant, then the pressures on VLSFO supply are likely to ease and ‘surplus’ HSFO availabilities are likely to be removed with lower refinery runs. It is one of those “on the one hand this, and on the other hand that” answers, but this is what will
drive the fundamentals over the coming months and we must look to the Omicron impact, government responses, along with refining margins and throughputs.
The sentiment at the moment seems to be that the Omicron variant will not have a huge impact on the markets. Also, Asian refiners are generally looking at taking their full entitlement of Middle East crude liftings in January, and this is despite an increase in official crude price formulas. So current market sentiment seems to suggest a wide VLSFO/ HSFO differential looks more likely over the near term.
Ending where we started, ‘things tend to happen a lot faster than we typically expect’.
Steve Christy, Research Contributor
E: steve.christy@integr8fuels.com
Download this article as a PDF »
Bunker buyers lose up to $5/mt for not covering enough suppliers
December 9, 2021
With the Brent price recently touching the $80 mark and before the Omicron variant concerns pushed it lower, bunker prices reached levels not seen since early 2020. Following the OPEC+ decision not to release additional crude oil volumes on the market and continuing to add to existing supply gradually, we may see more oil price increases going forward, particularly if Omicron proves to be less deadly as initially thought and given the current tight oil supply and demand balance. The process of buying bunker fuel is essentially a reverse auction where more participants often mean a better price achieved, which is particularly important in the high oil price environment. In this article, we discuss the reasons and quantify the impact of low supplier coverage and response rate on the price paid and look into the ways to get more suppliers to quote.
More suppliers quoting means lower price paid…
We analysed a sample of over 250 Integr8 Fuels stems fixed so far in 2021 covering the hubs of ARA, Gibralter Straits and Malta which are served by multiple suppliers. For each stem, only the larger quantity fuel was analysed (often VLSFO or HSFO, unless a single LSMGO grade was procured) as supplier coverage in the dual fuel stems often depends on the main larger quantity grade.
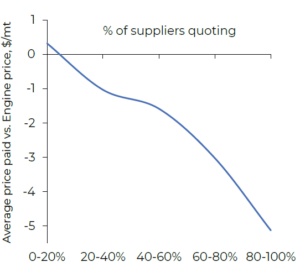
Figure 1. (below) shows the relationship between the supplier response rate (the share of suppliers quoting a price in the total number of suppliers) and the average premium or discount paid over the bunker benchmark price provided by ENGINE.
It is evident that, on average, stems with less than 20% of suppliers quoting were fixed at a slight premium to the benchmark, while stems with over 60% of suppliers quoting were fixed at significant discounts, hence having more suppliers’ quotes resulted in an average savings of up to $5/mt. And there are a number of ways to achieve such savings.
Left: Figure 1. Supplier response rate vs. price paid (Source: Integr8 Fuels, ENGINE)
To visually represent this, all the stems have been mapped for supplier coverage and response rate with stems falling into three distinct categories (Figure 2.). Around 30% of stems fall into the first category, where both supplier coverage and response rates were low, including most of the stems with one supplier. Stems in this category were on average fixed with a $0.2/mt discount to the ENGINE benchmark price. Intuitively, an over payment could be expected, however, the small discount was mostly due to a number of large quantity fixtures that usually attract good prices. Read More
With the Brent price recently touching the $80 mark and before the Omicron variant concerns pushed it lower, bunker prices reached levels not seen since early 2020. Following the OPEC+ decision not to release additional crude oil volumes on the market and continuing to add to existing supply gradually, we may see more oil price increases going forward, particularly if Omicron proves to be less deadly as initially thought and given the current tight oil supply and demand balance. The process of buying bunker fuel is essentially a reverse auction where more participants often mean a better price achieved, which is particularly important in the high oil price environment. In this article, we discuss the reasons and quantify the impact of low supplier coverage and response rate on the price paid and look into the ways to get more suppliers to quote.
More suppliers quoting means lower price paid…
We analysed a sample of over 250 Integr8 Fuels stems fixed so far in 2021 covering the hubs of ARA, Gibralter Straits and Malta which are served by multiple suppliers. For each stem, only the larger quantity fuel was analysed (often VLSFO or HSFO, unless a single LSMGO grade was procured) as supplier coverage in the dual fuel stems often depends on the main larger quantity grade.
Figure 1. (below) shows the relationship between the supplier response rate (the share of suppliers quoting a price in the total number of suppliers) and the average premium or discount paid over the bunker benchmark price provided by ENGINE.
It is evident that, on average, stems with less than 20% of suppliers quoting were fixed at a slight premium to the benchmark, while stems with over 60% of suppliers quoting were fixed at significant discounts, hence having more suppliers’ quotes resulted in an average savings of up to $5/mt. And there are a number of ways to achieve such savings.
Left: Figure 1. Supplier response rate vs. price paid (Source: Integr8 Fuels, ENGINE)
To visually represent this, all the stems have been mapped for supplier coverage and response rate with stems falling into three distinct categories (Figure 2.). Around 30% of stems fall into the first category, where both supplier coverage and response rates were low, including most of the stems with one supplier. Stems in this category were on average fixed with a $0.2/mt discount to the ENGINE benchmark price. Intuitively, an over payment could be expected, however, the small discount was mostly due to a number of large quantity fixtures that usually attract good prices.
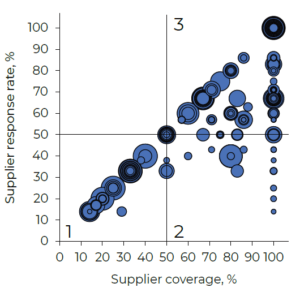 The stems in the second category, which constitute around 15% of all stems, had good a supplier coverage but a low response rate. These are characterised by their smaller size, shorter lead time and a small discount to the benchmark of $0.3/mt. A lot of these fixtures were done for same day delivery. Lastly, in the third category are the stems with a good supplier coverage and response rate – these on average achieved a much larger discount of $3.4/mt to the benchmark and this is the category where more fixtures should be aiming to be.
Left: Figure 2. Stems by supplier coverage and response rate. (Source: Integr8 Fuels)
Interestingly, we found a number of stems with the high supplier coverage and response rate yet with sizeable over-payments beyond the ENGINE benchmark pricing. The main reason for this was found to be the limitation imposed by some companies in the wake of the IMO2020 change on the acceptable levels of sulphur and viscosity when buying VLSFO. While in some instances such limitations helped to avoid buying
fuel that was more likely to test off-spec or cause issues on board vessels, in others this meant that some suppliers offering lower prices were being disqualified on the basis of provisional certificates of quality which were not always representative of the delivered fuel quality. A similar trend was spotted among the minority of stems where a certain spec was requested, for example, ISO 8217:2017.
Overall, the data shows that increasing the lead time and stem quantity, avoiding out of hours and weekend enquiries, being flexible with the fuel specs where operationally possible and safe to do so, can help increase suppliers’ response and achieve a better price paid. Moving beyond the stem sample analysed, another typical reason for sub-optimal supplier coverage is that some companies only prefer to deal with a limited
number of physical suppliers directly.
Traders can help increase supplier coverage
Direct business is often perceived as the only way to achieve low prices as it cuts the middleman from the equation. This does work well for large companies buying substantial volumes of bunkers globally who have the resources to negotiate prices, set up and maintain credit lines with the hundreds of suppliers globally. However, the reality is that a lot of medium and smaller companies may only be dealing with a handful of suppliers directly thus not covering the whole market. This significantly limits their bargaining power.
A trader can not only cover the rest of the market but also act as insurance policy should the company’s own credit lines with suppliers become tight, particularly in the rising oil price environment.
Long gone the days when traders were matching sellers with buyers. In recent years, investment has been going into gathering data, setting up systems, news flow and analytics. While receiving quotes and sending back counteroffers to five suppliers may not sound too complex, a trader may have a system that allows to compare supplier quotations on the weighted by fuel grade average price while also considering suppliers’ historical claims, density short lifts, recent quality issues and fuel energy content.
These days a trader can not only cover every supplier in the market but also warn about supply delays (as no one wants their $40,000/day earning bulk carrier to go off hire waiting for bunker supplies), worsening weather conditions, help prevent claims, bundle up several enquiries to achieve volume discounts and even help with bunker planning, optimal port suggestions or combination of ports to bunker your vessel.
Anton Shamray, Senior Research Analyst
E: anton.s@navig8group.com
Download this article as a PDF »