What is the best indicator for bunker price direction?
VLSFO prices finally fall – down $270/mt in Singapore
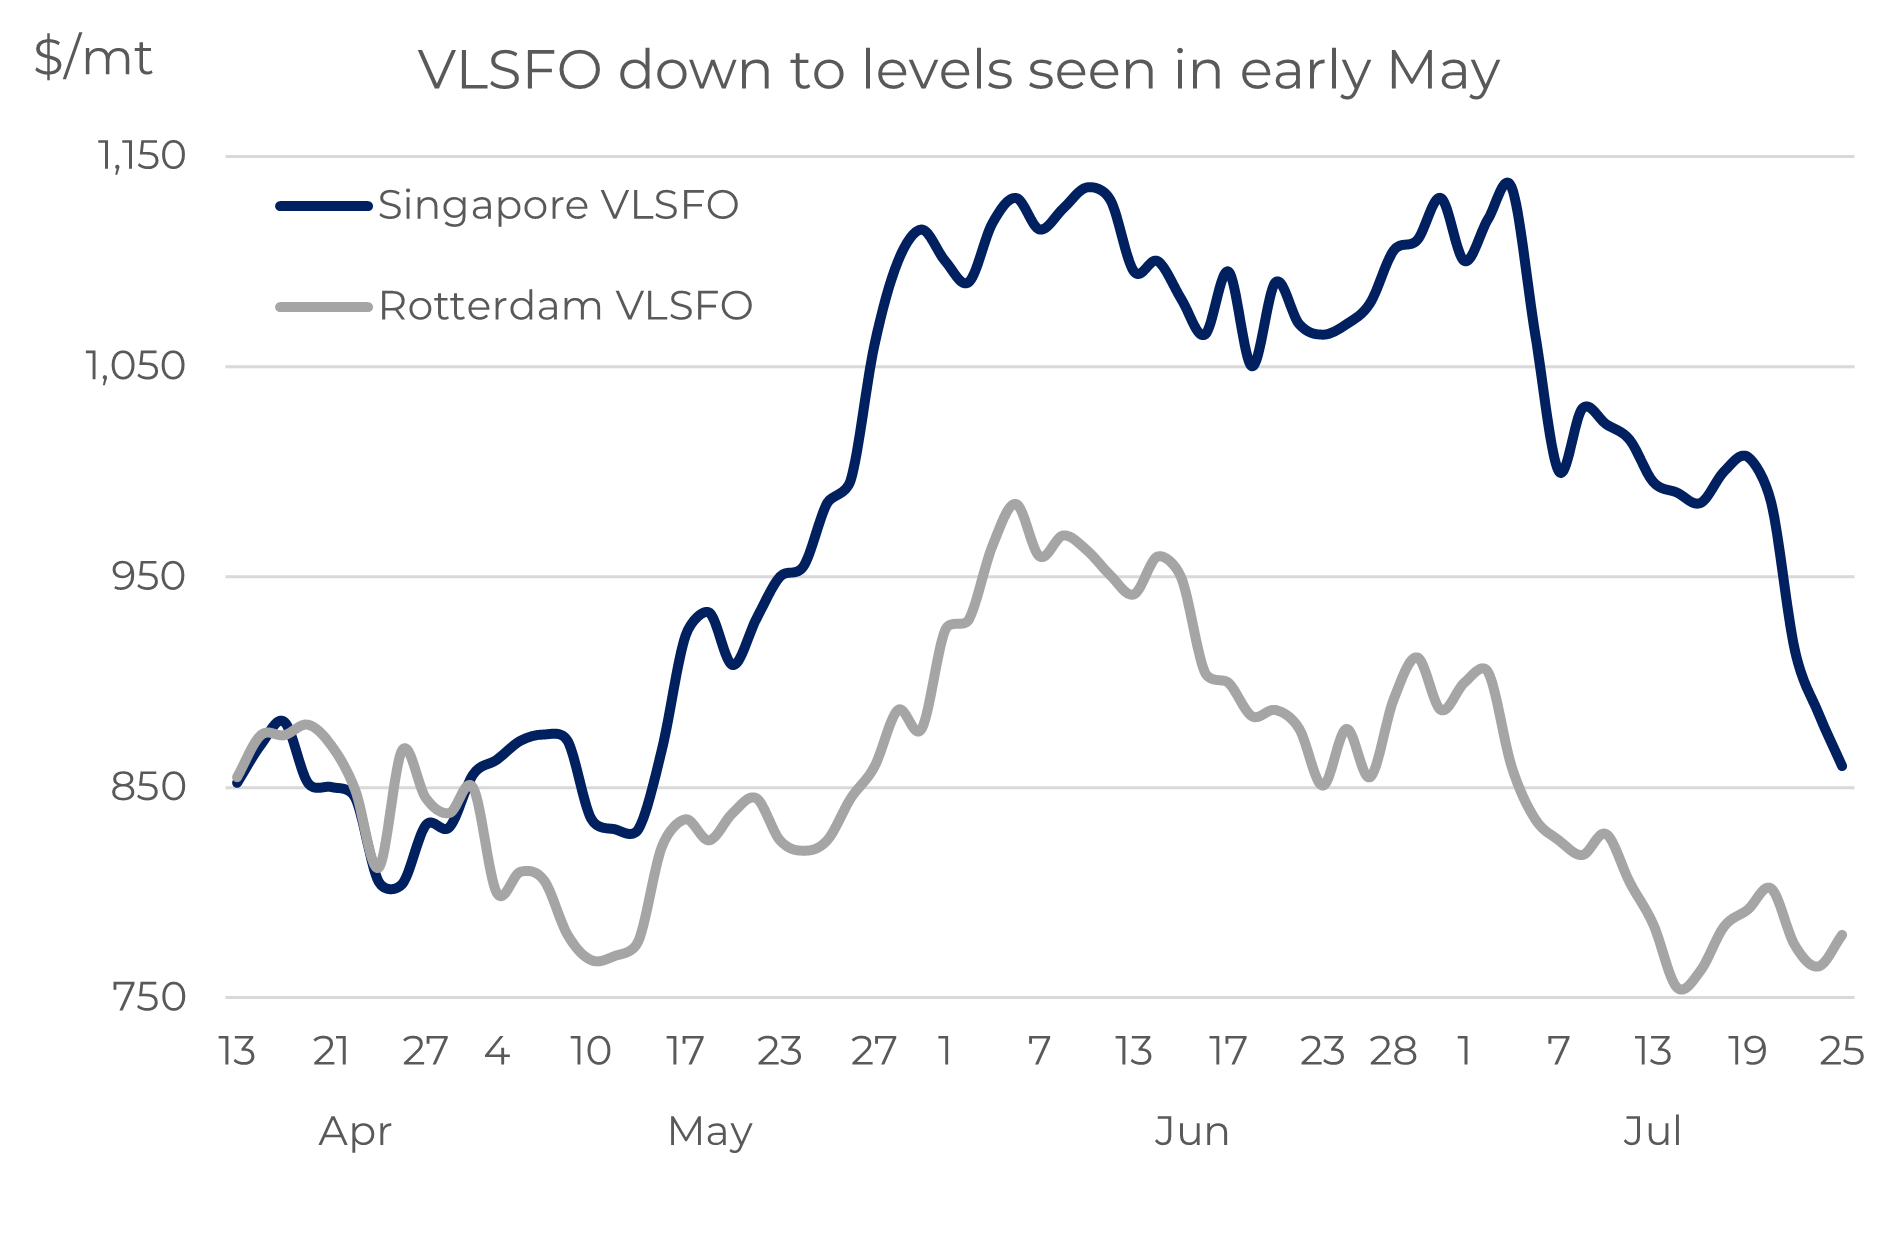
After almost 2 months of Singapore VLSFO prices being above $1,000/mt, we have finally seen an easing in the market. There have been two sharp price drops this month and Singapore VLSFO is now back to around $860/mt; still historically high, but at least similar to levels in early May.
Source: Integr8 Fuels
VLSFO prices have also fallen in Rotterdam, but with prices already significantly lower than Singapore, the drop was not by as much. So far this month Rotterdam prices are down by around $100/mt to $780. It does mean the difference in VLSFO between the two locations has narrowed massively from around $250/mt to $80/mt currently, but this compares with an average differential of only $25/mt last year; there is still a bigger than usual difference between Rotterdam and Singapore VLSFO prices.
Global refinery margins are down massively
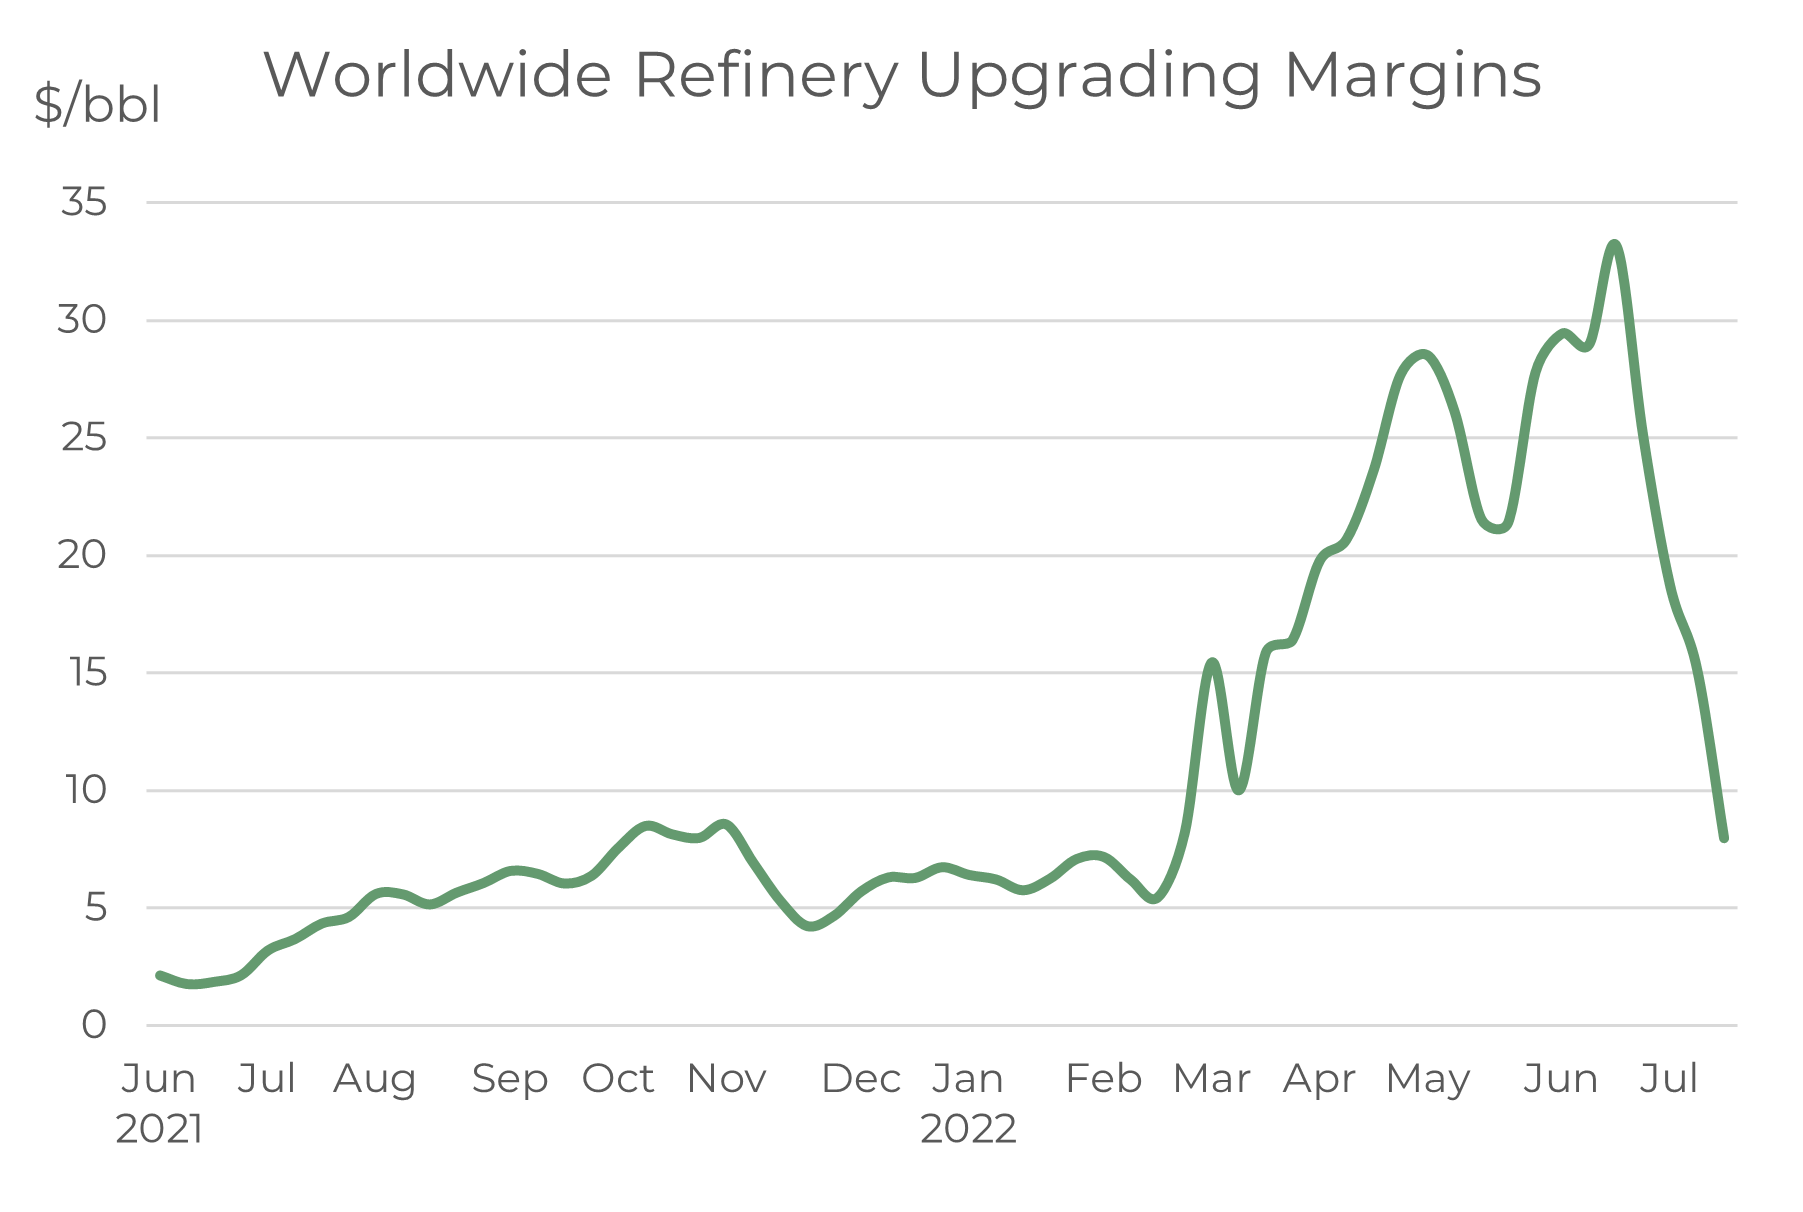
Over the past couple of months, we have focused on refinery margins as a marker of the strength in products markets and ultimately a key indicator for bunker price movements. In May and June refinery margins moved to record highs, driven by extreme tightness in gasoline, diesel and jet markets around the world. However, these margins have collapsed over the past 2-3 weeks, mainly because of far greater weakness in gasoline and diesel markets in most parts of the world (jet margins are lower but the falls have not generally been to the same extent).
 Source: Integr8 Fuels
Gasoline in the US has weakened significantly with a loss in demand from $5/gallon prices (high by US standards, but not necessarily in other parts of the world). This in turn has closed the arb on European gasoline moving transatlantic and so eased any tightness in the European market. In Asia, gasoline margins have fallen from record highs to their lowest in the past 12 months, as higher exports from China and Malaysia ease the supply concerns.
VLSFO prices have followed this exact same trend in margins, at a time when crude oil prices have generally been around $105-115/bbl.
The ‘refinery margins indicator’ reflects the heavy support for VLSFO prices in May/June, and clearly demonstrates the diminishing support for VLSFO over the past few weeks. However, with margins moving back towards more historical norms, it is now time to shift focus towards other indicators to get some feel of where bunker prices could go in the near term.
What is the next good indicator for bunker prices?
The concerns about economic threats, inflation, interest rates and even recession have ebbed and flowed. For us looking at short-term oil and bunker prices, these concerns have taken a back seat for the past 2 months; but with support for products and margins easing, talk about economic uncertainty and the negative outlook for oil demand is now likely to re-emerge.
The other ‘big picture’ feature that will affect bunker prices in the short-term is crude oil production and if OPEC+ increase output, as requested by the US.
These two factors cover both sides of the supply/demand fundamentals; possible downwards revisions to oil demand because of a weaker economic outlook and potential increases in crude oil supplies.
Will it be higher oil production that leads to lower bunker prices?
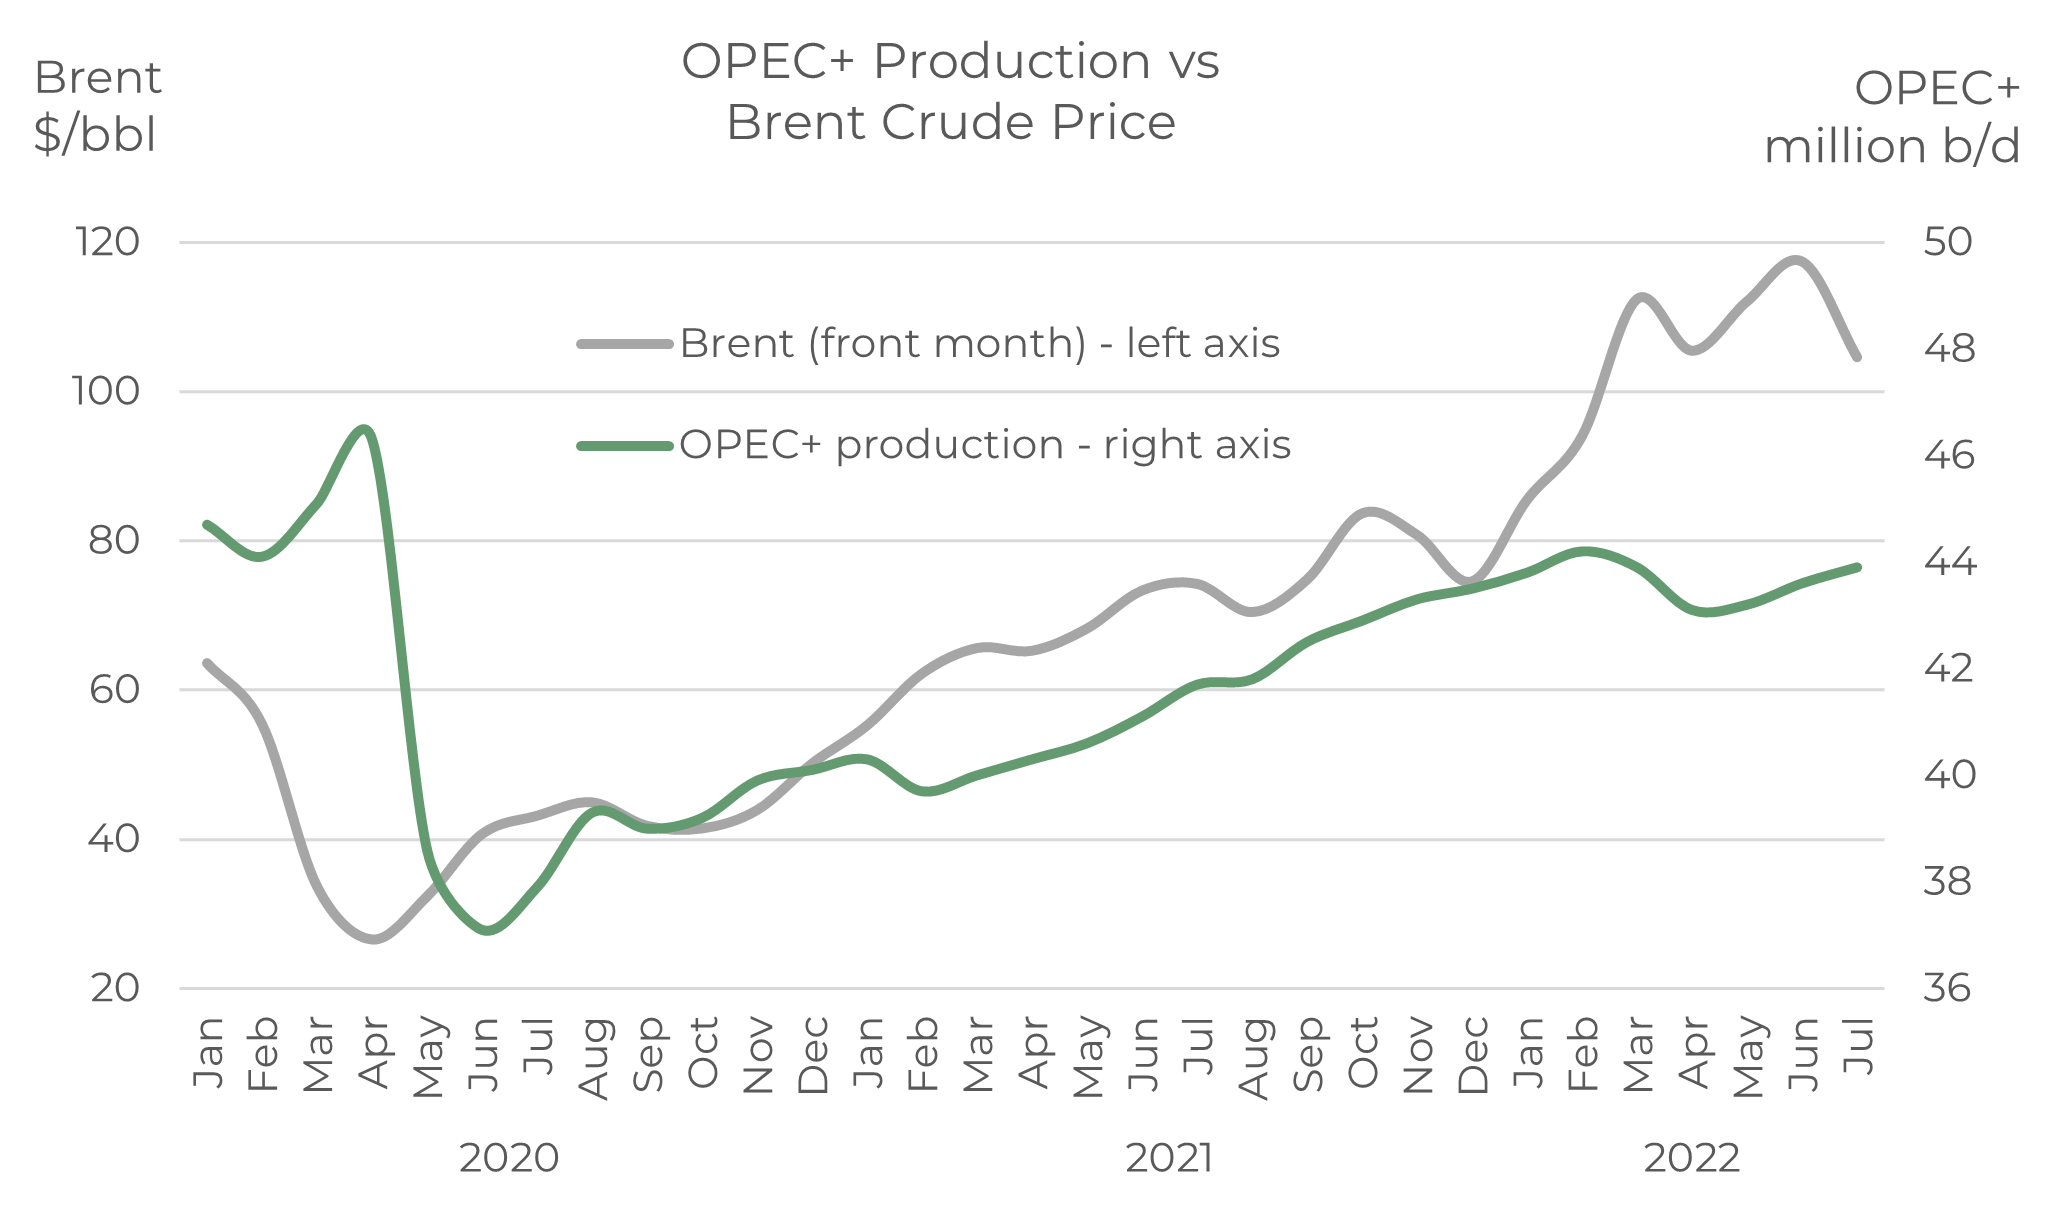
Historically OPEC manages the marginal barrel of oil supply and has generally responded to sharp movements in oil prices; increasing output when prices are ‘too high’ and cutting production when prices are ‘too low’. The extremes of the covid situation clearly show this strategy in the graph below, with Brent prices falling from the low $60s to the low $20s at the start of the pandemic and the expanded group of OPEC+ slashing output by 8 million b/d (almost 20%).
Once the pandemic started to ease, leading to oil demand and prices rising, so OPEC+ raised production back towards earlier levels. This all continued on the ‘usual’ strategy through to earlier this year and just before the invasion of Ukraine.
Source: Integr8 Fuels
However, since the Russian/Ukraine conflict started in February, Brent prices have risen from $85/bbl to around $105-115/bbl and OPEC+ production has not increased at all. There was actually a dip in output in March/April, but this was largely due to the loss of Russian production. However, even excluding Russia, production from the rest of the OPEC+ group has not increased at all since the invasion.
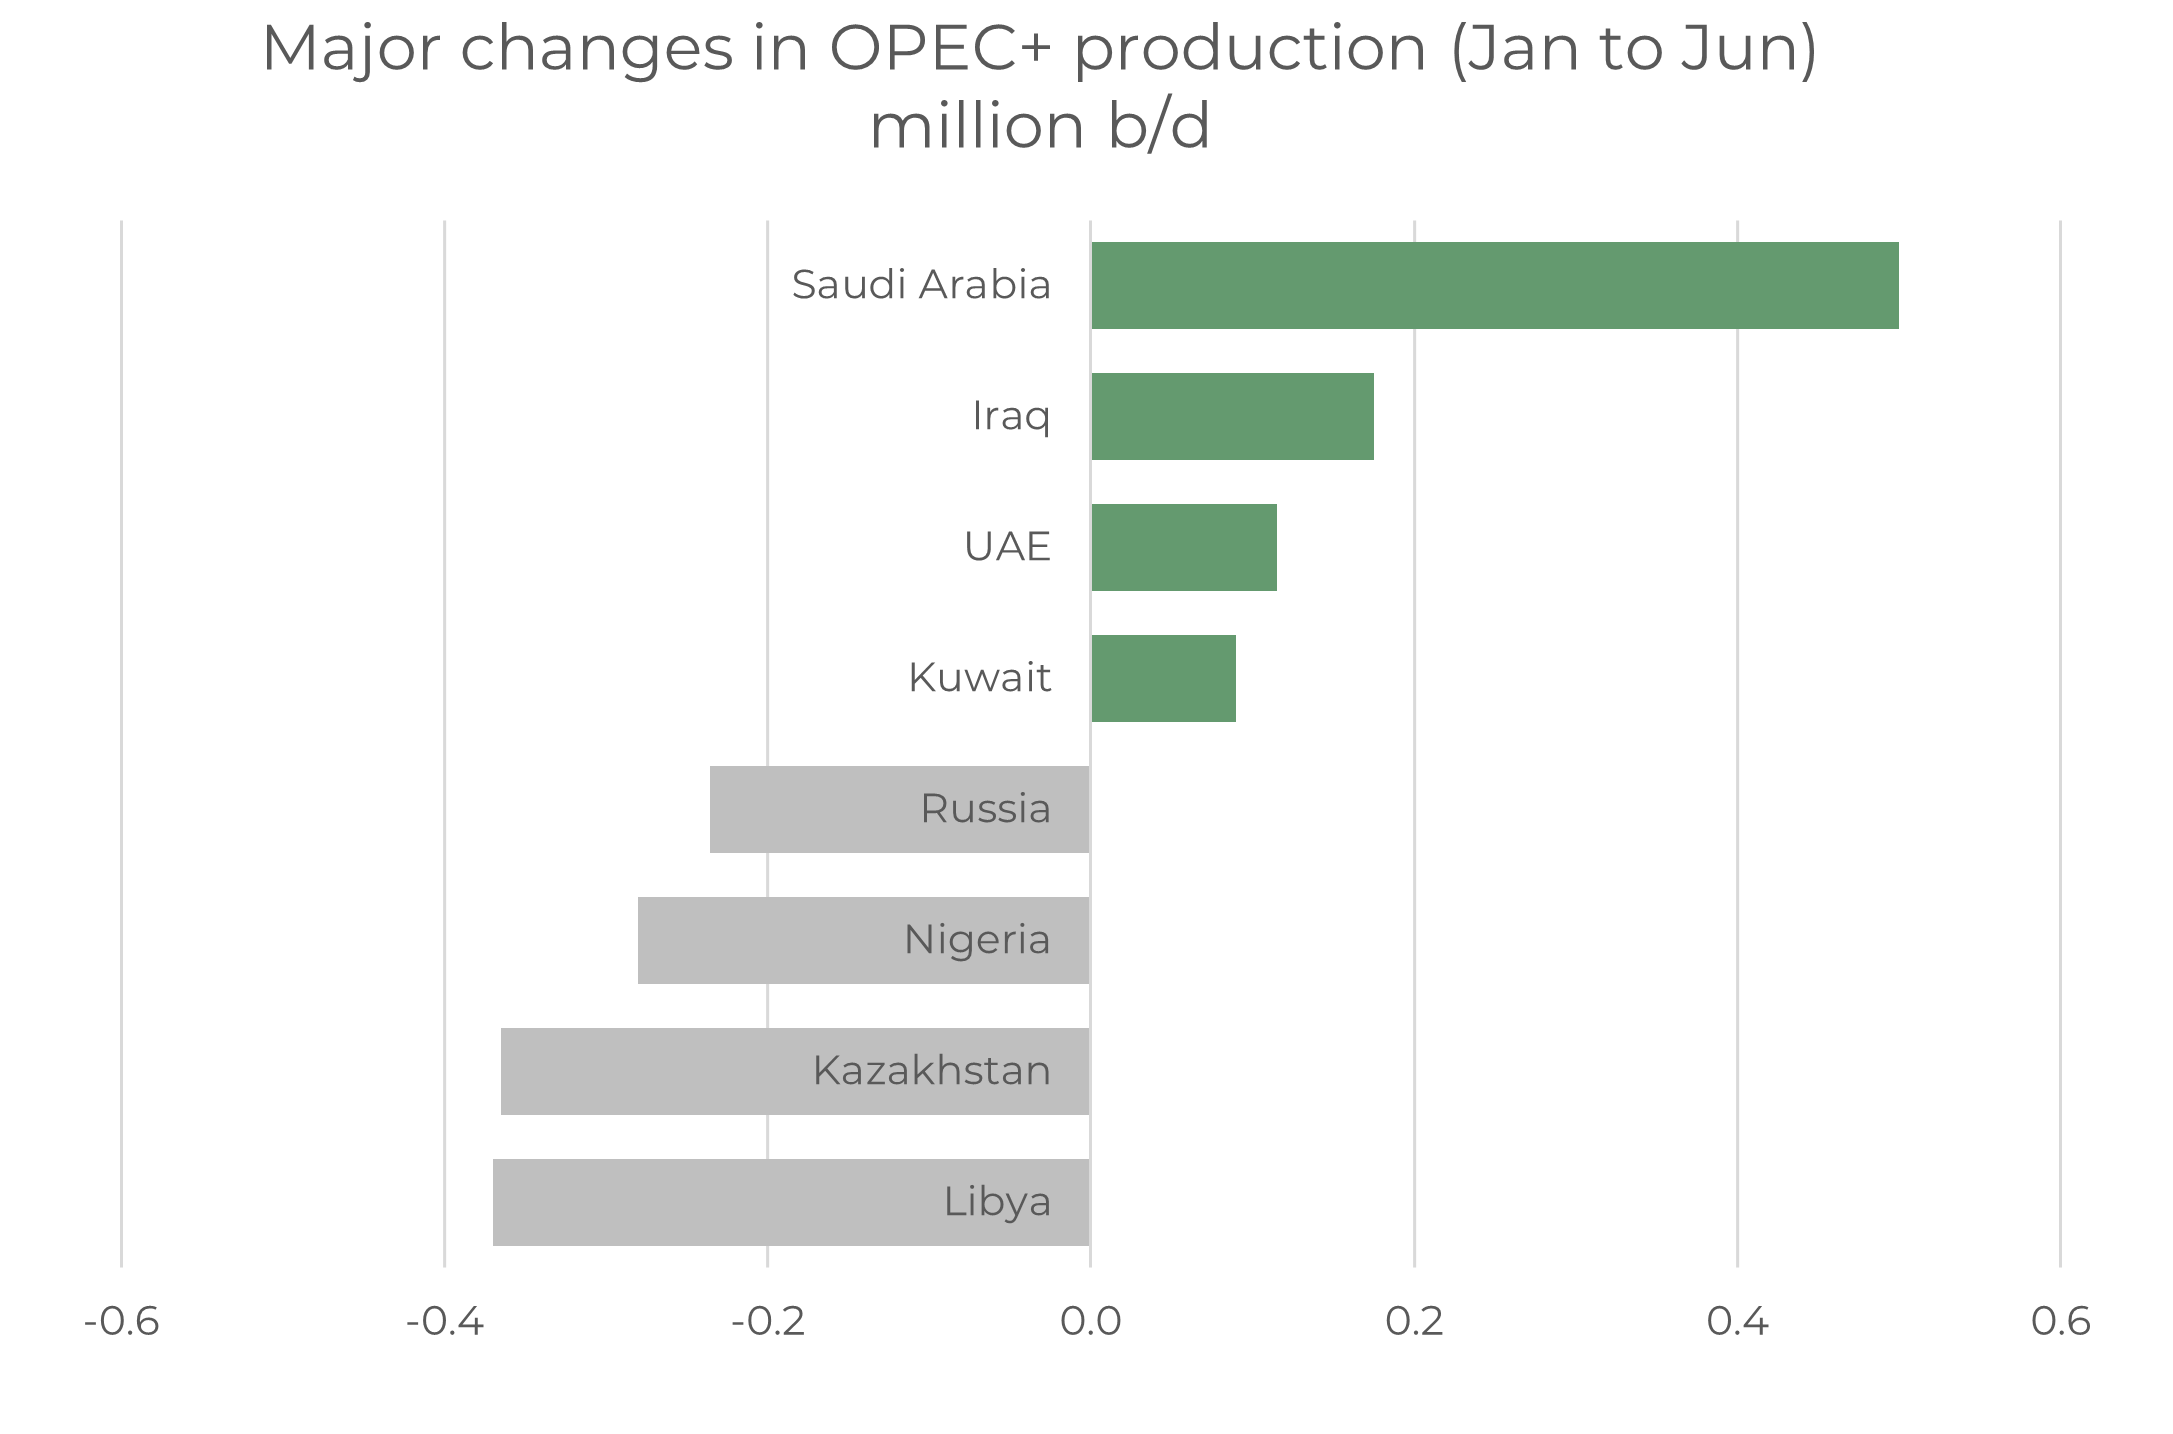
There is a lot going on at a country level within the OPEC+ group. Libyan output is currently around 0.3 million b/d lower than in January because of political tensions and protests, although it looks as though it is now increasing. Kazakhstan crude output is also down by around 0.3 million b/d, with problems surrounding exports passing through Russia and loading at Russian terminals; Kazakh crudes have been renamed in order to ease this. Output from Nigeria has also fallen by 0.3 million b/d.
There are also problems in many OPEC+ countries, where insufficient E&P spending has meant production capacity is below their allocated quotas.
This means most countries in the OPEC+ group do not have the capacity to raise output, even if quotas are increased. It is left to the few OPEC+ countries that do have spare capacity to set the strategy; namely Saudi Arabia, UAE, Kuwait and possibly Iraq. In all of these Saudi Arabia is by far the most influential.
Over recent months these ‘spare capacity’ countries have increased output by around 0.9 million b/d, but this only compensates for losses in output elsewhere within OPEC+.
Source: Integr8 Fuels
So, excluding Russia, current OPEC+ production is the same as it was back in January, and oil prices are some $20-25/bbl higher.
The US has made numerous calls for OPEC+ to raise production in response to prices going above $100/bbl. President Biden even made a trip to Saudi Arabia two weeks ago, but the calls appear to have come up with nothing in terms of a Saudi response to increase output; and it is Saudi Arabia that is likely to be the decision maker for OPEC+ strategy.
Not refinery margins; Not likely oil production. Is it the economy?
So, all the indications are that refinery margins have run their course to historic highs and now back towards historic norms, so these are no longer the most useful indicator for bunker price direction.
In terms of a production increase to reduce oil prices, Saudi Arabia is the linchpin here and the one to watch, but it currently shows no signs of hiking output; there will be increases in US shale production, but these will be gradual.
Outside of this, the next thing to watch is sentiment and direction in the economy. Bearish signals here may be the only thing that takes down oil and bunker prices in the near term. Lower prices are what a lot of people want, but this probably isn’t the best way to get them!
Steve Christy, Research Contributor
E: steve.christy@integr8fuels.com


Contact our Experts
With 50+ traders in 12 offices around the world, our team is available 24/7 to support you in your energy procurement needs.