As Oil Markets Stabilise, Singapore VLSFO Remains the Outlier
June 24, 2026
View this article as a PDF » Crude prices close to their ‘lows’ A US-Iran MoU is in place and negotiations are underway. The path was never going to be smooth, and Israeli attacks on Lebanon at the very start of the process highlight the challenges ahead. However,… Read More
Crude prices close to their ‘lows’
A US-Iran MoU is in place and negotiations are underway. The path was never going to be smooth, and Israeli attacks on Lebanon at the very start of the process highlight the challenges ahead. However, the initial talks on ending the war and allowing future nuclear inspections are encouraging. The latest Brent and WTI crude futures markets appear to have more or less priced in a conclusion to the war and the reopening of the Strait of Hormuz. Prices may fall a little further on positive headline news, but from here the downside potential looks relatively limited.
Front-month Brent was trading at around $77/bbl at the time of writing, down from $105/bbl just over a month ago and a peak of $124/bbl at the end of April. We have come a long way from those highs, and there was never an expectation that prices would return to the monthly average Brent levels in the $60s seen during the 11 months from April 2025 to February 2026.
Source: Integr8 Fuels
Where are we with Singapore and Brent VLSFO pricing?
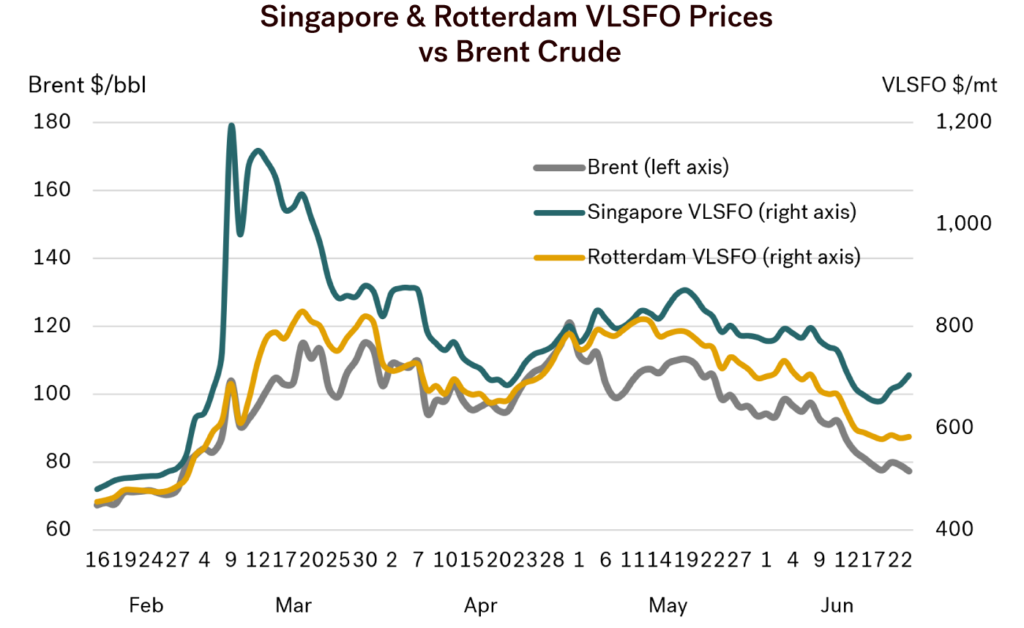
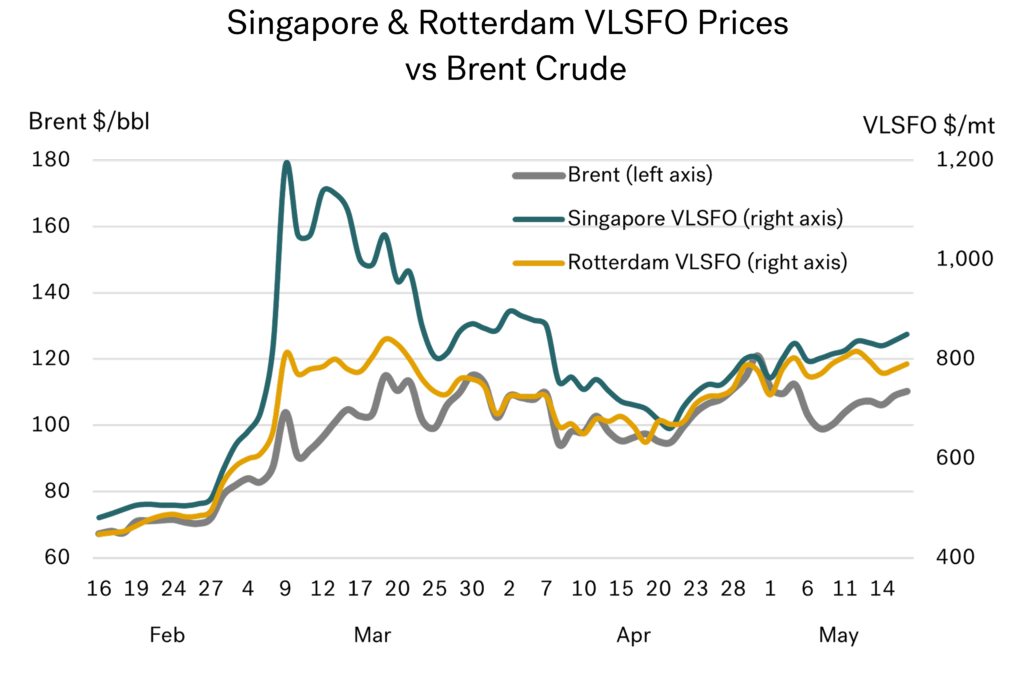
At this stage it appears that Rotterdam VLSFO prices are largely tracking the decline in front month Brent, but with a slight premium versus crude. There may be some room for this to ease a bit more, but not by much. To take Rotterdam VLSFO prices much lower we will need another drop in crude prices.
The situation in Singapore is different. Singapore VLSFO prices were falling, but have then risen over the past few days and are now at a very strong premium to crude. It may take a while, but this premium is expected to erode as oil markets stabilise and ‘get back to normal’. There seems to be more room for Singapore VLSFO to fall than for Rotterdam.
How the market is now looking at Brent crude futures
Obviously, war, uncertainty and the loss in supply have driven the whole oil price complex much higher. At the same time, pressures in physical supplies and also in near month futures prices have created a more extreme level of backwardation in price structures. This reflects the immediate tensions, and the sentiment at any given stage. In the graph below we have illustrated this by showing the price premium for front month Brent futures versus the second month price.
This shows the level of backwardation in this market climbed from less than $1/bbl just before the war, to anywhere between $4-10/bbl during March and April. Since then, backwardation has eased as expectations moved towards a peace agreement. Now it looks like an agreement will soon be in place, and backwardation has reverted back to pre-war levels. In fact, there is only around $0.40/bbl backwardation each month through to June next year. This is a very flat outlook, and not a sign of huge pressure.
Also, although it is not a forecast, and only the level at which people are prepared to trade, the current futures price for Brent a year ahead (June 2027 contract) is at $73/bbl, which is only $4/bbl below current prices.

Source: Integr8 Fuels
Given limited room for crude, how much further can VLSFO prices fall?
In last month’s report we highlighted the pressures on refining and the massive hike in overall margins that this war has triggered. The graph below takes this one step further, looking at VLSFO prices versus front month Brent. The measurement is adjusted to a weight basis and shown in terms of $/mt.

Source: Integr8 Fuels
This shows Singapore VLSFO prices had been running at around $25/mt below Brent equivalent, but at the start of the war surged to a $150/mt premium to crude. Although there was then a dip, current Singapore VLSFO prices have again increased, and are now $125/mt above Brent.
In contrast, Rotterdam VLSFO prices have moved from a typical $50/mt discount to Brent to a near equivalence today. This does show the disproportionate pressures that hit the Singapore VLSFO market at the start of the war, and also today. It also illustrates there is far more room for Singapore VLSFO prices to fall than for Rotterdam prices.
Assuming a complete (or near complete) opening of the strait of Hormuz takes place, these price relationships can be expected to ease as we get back to a more ‘normal’ flow of crude and product exports from the Middle East.
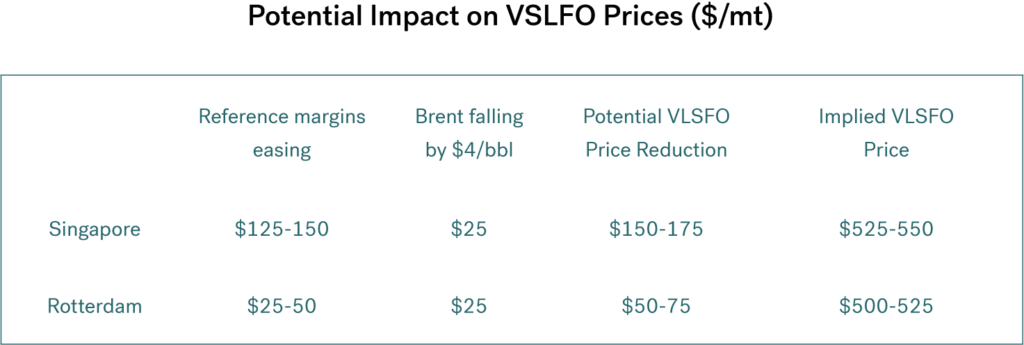
It is unlikely to be immediate, but even if crude prices were to remain at close to current levels, we would expect Singapore VLSFO prices to fall by around $125-150/mt over time, and Rotterdam prices by around another $25-50/mt as product premiums diminish.
So, even without any further fall in crude prices, once trade via the strait normalises, and international markets become more balanced, we could see Singapore VLSFO at $550-575/mt, and Rotterdam prices just below $550/mt.
This shows Singapore VLSFO prices had been running at around $25/mt below Brent equivalent, but at the start of the war surged to a $150/mt premium to crude. Although there was then a dip, current Singapore VLSFO prices have again increased, and are now $125/mt above Brent.
In contrast, Rotterdam VLSFO prices have moved from a typical $50/mt discount to Brent to a near equivalence today. This does show the disproportionate pressures that hit the Singapore VLSFO market at the start of the war, and also today. It also illustrates there is far more room for Singapore VLSFO prices to fall than for Rotterdam prices.
Assuming a complete (or near complete) opening of the strait of Hormuz takes place, these price relationships can be expected to ease as we get back to a more ‘normal’ flow of crude and product exports from the Middle East.
It is unlikely to be immediate, but even if crude prices were to remain at close to current levels, we would expect Singapore VLSFO prices to fall by around $125-150/mt over time, and Rotterdam prices by around another $25-50/mt as product premiums diminish.
So, even without any further fall in crude prices, once trade via the strait normalises, and international markets become more balanced, we could see Singapore VLSFO at $550-575/mt, and Rotterdam prices just below $550/mt.
A basic guide to consider future VLSFO pricing
There are always caveats around such statements. The starting point is that a strong and successful peace agreement would need to be in place, along with the free flow of traffic through the Strait.
There are a wide range of views on crude oil prices for the rest of this year. Some commentators are still carrying relatively high Brent forecasts at well above $85/bbl, although these are likely based on expectations formed before the latest round of US-Iran agreements and negotiations. Other commentators are looking for Brent to fall back into the $60s, driven by a rapid build-up in global oil inventories and lower expectations for oil demand following the war.
A more balanced view, however, is perhaps aligned with Goldman Sachs, which sees Brent trading in the $70–75/bbl range further out.
This feels like a good place to start the analysis. It is always easier to begin with a working assumption and then assess how the market evolves from there. This approach allows us to adjust price views as negotiations progress (or stall), as the practical realities of reopening the Strait of Hormuz unfold, and as the level of confidence in any agreement becomes clearer.
Using expectations that VLSFO prices will ease relative to crude, and that crude prices could edge down by a further $4/bbl over the rest of this year and into next, we could be looking at Singapore VLSFO prices around $150–175/mt lower than current levels, and Rotterdam VLSFO around $50–75/mt lower.
Source: Integr8 Fuels
The conclusions look good; we just need reality to follow suit!
This scenario could look quite favourable, but it does rely on a number of positive assumptions embedded within the price outlook. The most useful way to frame it is to keep the two elements separate. First, are markets likely to rebalance fairly quickly? If so, we would expect product prices to ease and refinery margins to come down. Second, could crude prices fall further? This could happen if the US and Iran are able to reach a more durable agreement through ongoing negotiations, potentially bringing an end to the conflict and even, in time, easing sanctions on Iran.
For now, we can only wait and see.
Steve Christy
Research Contributor
E: steve.christy@integr8fuels.com
Tighter Refining Conditions Are Supporting Higher Bunker Prices
May 20, 2026
View this article as a PDF » Prices are on the up (again) We have already seen that it is almost impossible to predict how and when the Iran war will end, and when the Strait of Hormuz will reopen. In last month’s report, we looked at the… Read More
Prices are on the up (again)
We have already seen that it is almost impossible to predict how and when the Iran war will end, and when the Strait of Hormuz will reopen. In last month’s report, we looked at the potential for bunker prices to fall if the war were to end within two to three weeks, which seemed credible at the time, and a higher price trajectory towards $900/mt for Singapore VLSFO if the war continued for another one to two months. At present, we are clearly on the higher trajectory.
Prices continue to rise and fall with sentiment surrounding a possible end to the war, but over the past couple of weeks the overall direction has been upwards. At the same time, bunker prices have once again moved ahead of crude, and Singapore VLSFO also strengthened relative to Rotterdam.
 Source: Integr8 Fuels
Where to next?
It seems we are on a rolling cycle of commentary where analysts continue to assume the war will end within the next month. However, even if it does, refinery operations have already been severely reduced and stock levels materially depleted. There is no quick return to where we were; the market has fundamentally changed in the past 12 weeks.
Refinery throughput is down and product markets are looking increasingly tight
The loss of Middle East crude production and refinery operations is at the centre of everything. Looking at the IEA’s view of the refinery sector, estimated global throughput for April is down by more than 7 million b/d since the start of the war. This is significantly greater than the estimated 3 million b/d drop in demand that has taken place this quarter.
The consequence is lower product stock levels and tighter product markets, creating uncertainty, higher prices, and higher refinery margins.
Current IEA forecasts for refinery throughput are also based on the Strait reopening sometime within the next month, with Middle East crude production and refinery operations moving much higher in Q3 and returning to pre-war levels in Q4. It is not an unreasonable premise, but it remains only
a premise.
 Source: IEA
The impact on refining is focused East of Suez
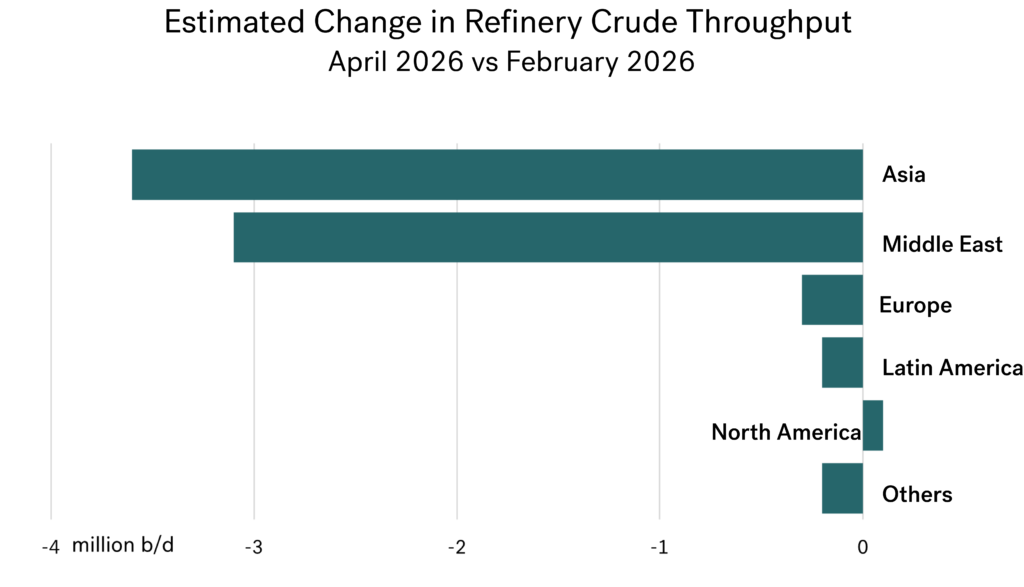
The more than 7 million b/d cutback in global refinery operations since February has been concentrated in the Middle East (down 3.1 million b/d) because of the inability to export products, and in Asia-Pacific (down 3.6 million b/d) because of the initial loss of crude imports from the Middle East into the region (see figure below).
 Source: IEA
Cutbacks in refinery operations elsewhere have been far more limited, with European runs down by only 0.3 million b/d, and Latin America down 0.2 million b/d. Runs in North America have increased slightly. The clear loss in access to “local” refinery supplies has therefore been in Asia-Pacific. However, regions do not rely solely on their own refinery operations; product imports and exports exist to balance deficits and surpluses across all international markets.
If one region suffers, every region suffers
Even through throughputs in the West have been largely unaffected, the competition for international products has intensified. As a prime example, Europe relies heavily on diesel, gasoil, and jet imports from the Middle East, but so does Asia-Pacific. This means both regions are now trying to “fill the gap”, but the situation in Asia is even more extreme because the region also has a massive shortfall in product supply from its own refineries.
This results in increased global competition for crude and products, lower oil stocks, a tightening market, higher prices, and stronger refining margins.
Early indications of what is happening to product stocks
These market squeezes can be observed through stock levels but reported stock data usually lags by at least 2-3 months, meaning we are still in a “waiting game” for full confirmation.
The fundamentals indicate a global stock draw of around 4 million b/d, while available data from the US and independent storage in Amsterdam, Rotterdam, and Antwerp (ARA) help to illustrate the position, including where and which products are the most under pressure.
Overall product stocks in ARA fell by 13% in April and are now at their lowest levels in more than 10 years. The situation in the US is very different, with product stocks down only 3% and still higher than 12 months ago. North-West Europe appears to be a significantly tighter market than the US.
 Source: Integr8 Fuels
However, we need to dig down to individual products. Here, gasoline stocks in the US have fallen, but the country remains a net importer of this product. Conversely, ARA gasoline stocks have increased slightly, with the region remaining a net exporter.
Distillate stocks are down sharply in North-West Europe, as the region is heavily dependent on imports. Distillate stocks in the US are also down, but this is not a demand issue; rather, it reflects higher US exports, which have reached the second-highest monthly total in 10 years, with much of this material flowing to meet European and Asian deficits. Both distillate markets are tight, but for different reasons.
The tightness in key products will have a direct bearing on VLSFO and HSFO bunker prices in these regions and further afield; we cannot separate bunker markets from wider barrel dynamics or regional product balances.
Refinery margins are an up-to-date measure of how tight markets are
Although it is still too early for more extensive oil stocks data, the implications are already clear. Product balances are tightening, and refinery margins are much higher than pre-war levels.
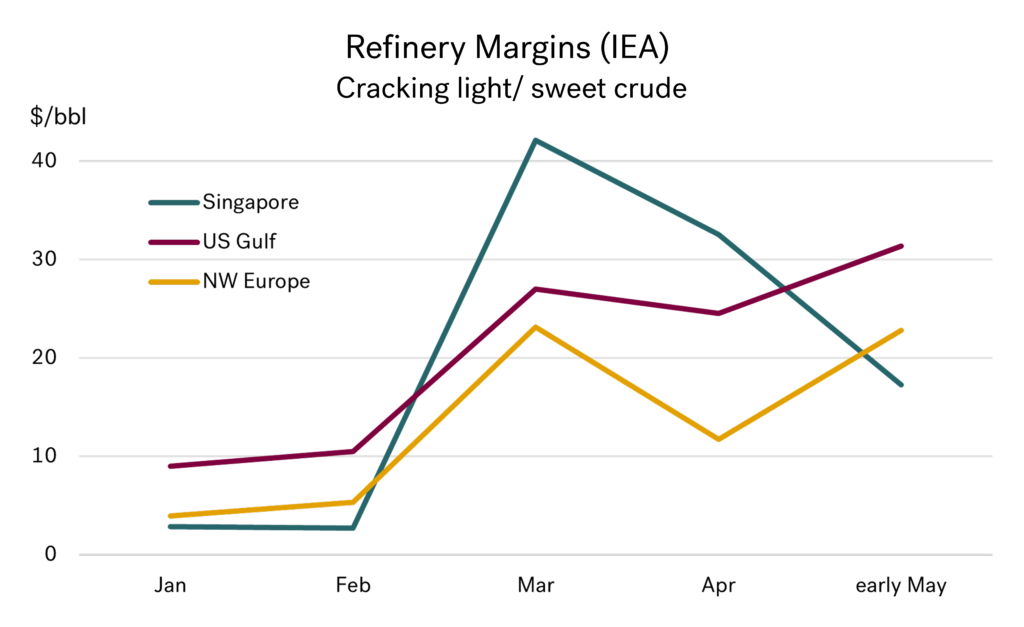
The initial post-war response saw Singapore refinery margins surge, reflected in exceptionally high Singapore VLSFO prices in March. Since then, we have seen a pull on crude and products from West to East. With this, there has been some rebalancing across regions, with Singapore margins easing and Atlantic margins strengthening. Currently, Singapore and European margins have converged to more similar levels, but all remain at much higher levels than in February.
These shifts in refinery margins have also been reflected in bunker price movements, with Singapore and Rotterdam VLSFO prices more closely aligned than in March and early April, although Singapore VLSFO is once again, showing signs of strengthening.
 Source: IEA
Conclusions
Given the market conditions and refinery margins, it is likely that upcoming seasonal refinery maintenance programmes will be limited. We are also likely to see further ebbs and flows in crude and product trade patterns, along with more releases from strategic stocks, but none of these are likely to be sufficient to fully offset current market tightness.
As for the end of the war, we appear to be in a rolling narrative where it is consistently described as being around four weeks away. If there is no near-term resolution, a potential backstop could be the run-up to the US midterm elections in November. There are no guarantees, but if that becomes the key marker, then we are talking about months rather than weeks.
Steve Christy
Research Contributor
E: steve.christy@integr8fuels.com

Familiar Patterns Emerging: How Market Volatility May Shape Bunker Quality
May 7, 2026
View this article as a PDF » Tighter oil markets are starting to show in bunker fuel quality. Early sample data is moving, and published statistics are still catching up. Marine fuel quality is often treated as a technical issue, but it is also a market signal. Bunker… Read More
Tighter oil markets are starting to show in bunker fuel quality. Early sample data is moving, and published statistics are still catching up.
Marine fuel quality is often treated as a technical issue, but it is also a market signal. Bunker fuel sits at the end of a long and pressured chain: crude selection, refinery configuration, storage logistics, cutter stock economics, barge availability, and regulatory change. When that chain is disturbed, whether through planned regulation or sudden market disruption, the impact is not limited to price. It can also show up in the fuel itself: density, metals, ash, sediment, stability, sulphur margin, and unusual blend components.
I have written about this theme before. In my latest Bunker Quality Trends Report, I argued that quality data should not be viewed solely as a pass-or-fail exercise against specification. It can also provide insight into how the fuel pool is shifting. Upward trends in metals, pour point, ash, or density may not render a fuel unsuitable, but they can still point to changes in crude slate, refinery streams, or blending practice.
The warning signs that preceded previous bunker quality events are visible again. Not as a confirmed repeat of Houston in 2018 or Singapore in 2022, but as early movement in the data before the wider market has fully priced in the risk.
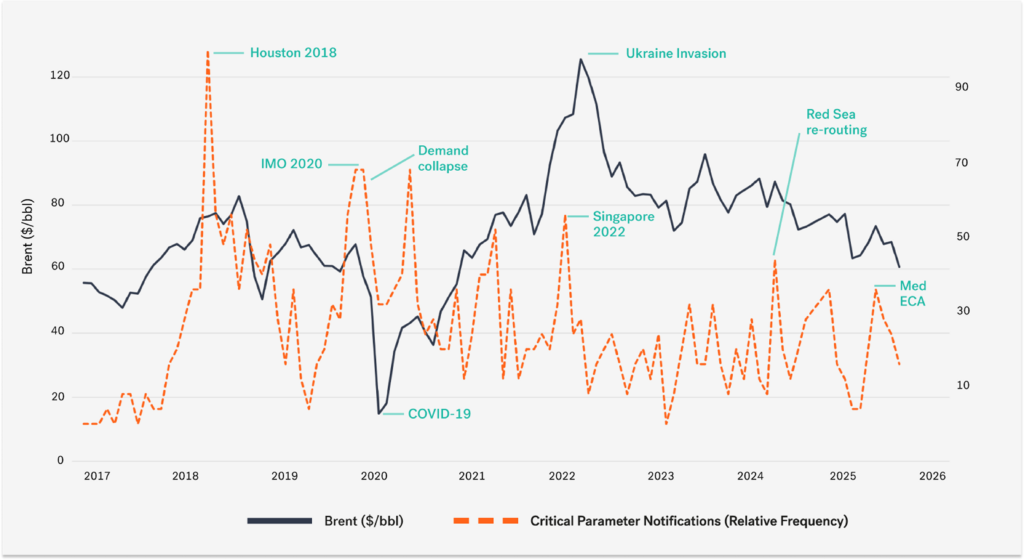
Figure 1: Historical timeline tracking Brent prices alongside critical parameter notifications, relative to frequency. (Integr8 Fuels)
The pattern started with what became known across the industry as the Houston problem in 2018. This served as a modern reminder that bunker quality risk can sit outside the normal specification tables. It was not an isolated supplier failure, but a wider blending pool issue that affected fuel moving through multiple suppliers across the region.
In a rising market, blenders appeared to have pushed the envelope. Cheaper and less familiar cutter stocks entered the pool, while very little GCMS testing was being carried out as part of routine quality control. Affected fuels were later associated with phenolic compounds and fatty acids, which in many cases correlated with elevated Total Acid Number. Vessels reported fuel pump, fuel system and engine-related problems.
The lesson was clear: routine ISO 8217 testing was essential, but it did not always tell the whole story.
IMO 2020 & COVID-19
IMO 2020 then showed that quality pressure does not need to come from a surprise incident. It can also come from a planned transition. The move from High Sulphur Fuel Oil (HSFO) to Very Low Sulphur Fuel Oil (VLSFO) pushed the global bunker market through one of the largest blending shifts it had ever seen. Refiners, suppliers, terminals, barges and ship operators all had to adjust within a compressed timeframe.
New VLSFO blends entered the market at scale, with different aromatic and paraffinic balances, as well as distinct stability behaviour and handling characteristics. Cross-contamination, compatibility concerns, purifier loading, and sediment control all became live operational issues.
This was not simply a failure of planning. It was the natural stress created when the entire fuel pool changes direction at speed.
COVID-19 brought a very different type of shock. The collapse in transport demand changed refinery economics almost overnight. Gasoline demand weakened during what would normally have been the driving season, aviation demand collapsed, and refiners were left with intermediate streams, including Vacuum Gas Oil (VGO), that no longer had their usual economic outlets.
With fewer routes into conventional transport fuel demand, some of this material found its way into the bunker blending pool. The quality signal was not a single global contamination event. It was more subtle, with increased attention on paraffinic content, cold flow behaviour, stability, and the use of components that may not have been as prominent under normal demand conditions.
Again, the fuel reflected the market around it.
2022 Singapore HSFO Contamination
The Singapore HSFO contamination case in 2022 reinforced the same lesson. The fuel affected was not a straightforward specification failure. It contained high levels of chlorinated organic compounds, including 1,2 dichloroethane and tetrachloroethylene, and was later traced by the Maritime and Port Authority of Singapore to fuel loaded at Khor Fakkan, before being shipped for further blending and delivered into Singapore. Around 200 ships received this fuel, and roughly 80 of those 200 ships reported fuel pump and engine-related issues.
This occurred during a period of extreme market volatility following the invasion of Ukraine, when crude flows, product flows, and blending economics were under pressure.
The point was not that the war directly caused the contamination. Rather, stressed markets created conditions in which unusual intermediate streams could enter the bunker pool, often outside the reach of routine specification testing.
Disruption in the Red Sea & Bab el Mandab
The Red Sea and Bab el Mandab disruption brought a different type of pressure. This was not primarily a contamination story; it was a logistics story. The Houthi threat forced diversions around the Cape of Good Hope, increasing voyage distances, vessel speeds, bunker consumption, and pressure on strategic refuelling hubs. As noted previously in 2025, this pressure affected quality, particularly where tighter barge utilisation was a factor. This resulted in faster grade switching and reduced segregation margins, increasing the risk of cross-contamination, including VLSFO sulphur exceedances in certain locations.
The January 2025 sanctions added another layer of pressure by changing which barrels could move, where they could move, and who could handle them. Russian fuel oil, VGO, and related blend components had been part of the global balancing system. As these flows became harder for mainstream buyers, traders, insurers, and shipowners to access, the market had to replace them quickly.
In the early phase, this meant greater reliance on alternative residual streams, including heavier, metal-rich Middle East fuel oil barrels. This changed the fingerprint of the blend pool, particularly in terms of metals, ash, density, and stability characteristics.
As discussed in the latest edition of our Bunker Quality Trends Report the quality impact was not a single headline contamination case, but a broader drift in the residual fuel pool as replacement barrels worked their way into key bunker hubs.
The current market is now showing a similar set of pressures.
Integr8 Fuels’ expert contributor, Steve Christy’s recent article framed the oil market as moving from surplus to shortage. That is also the right starting point for the quality discussion. The Strait of Hormuz shock has not only lifted prices; it has changed the shape of the market. A previously comfortable balance has tightened, with supply risk, stock draws, and war premium now sitting at the centre of the outlook. Bunker prices moved first. Fuel quality may be next.
The first reaction was price. Asian bunkers carried a heavy premium when the Strait of Hormuz risk escalated, before that premium started to unwind as crude and product flows adjusted.
The more important point for quality is what happens beneath the surface. Asian refiners competed more aggressively for Atlantic Basin crude, including South American and U.S. barrels. Atlantic markets tightened, Asian markets eased, and the refining system began to rebalance around a
new constraint.
That is the type of movement that can alter the residual fuel pool before anything formally falls outside specification.
Drawing on Integr8’s sample base of around 130 million tonnes of quality data per annum, the early signals are already visible.
Considering residual fuels at a high level, the main bunker hubs moved from a 1.8% specification exceedance rate in January and February 2026 to 2.6% in March and April to date. That represents a roughly 44% relative increase, with HSFO showing the stronger signal.
Singapore HSFO is one of the clearer examples. The headline specification exceedance rate was stable at 0.9% in Q4 2025 and again in January and February 2026, before rising to 2.7% in March and April to date. This does not confirm a major quality event, but it does indicate a clear change in both the rate and the composition of quality pressure.
Figure 2: Data shown as individual parameter flags versus samples tested. One sample may carry more than one flag. (Integr8 Fuels)
The parameter split is where the story becomes more useful. Ash remained the main continuous signal, rising from 0.16% in Q4 2025 to 0.61% in January and February, then to 2.11% in March and April to date. Sodium also became more visible, moving from 0.12% to 0.75% between Jan-Feb and Mar-Apr 2026. Water requires careful interpretation because it was already present in Q4, eased in January and February, and then returned more strongly in March and April. This makes it a renewed signal rather than a new one.
Water matters because it is both an operational issue and a commercial one. It adds no energy, but unless it is identified and accounted for, it is still paid for as part of the delivered tonne. It also increases the amount of non-combustible material that must be settled, drained, purified, and ultimately, disposed of. When flat prices are high, this is not a minor quality inconvenience; it is direct value leakage.
The wider pattern is also consistent with tighter blend economics and reduced blend giveaway. When cutter stocks become more expensive relative to base residual material, there is increased pressure to minimise its use, hence lowering the cost of the barrel. Fuels may remain compliant, but they can sit closer to commercial or specification limits. This does not prove a quality event, but it does show how quality data can capture commercial pressure before the market gives it a name.
Away from routine table testing, the Singapore market has also seen a series of quality alerts between March and May 2026. Early reports identified elevated alkylresorcinols and phenolic compounds in VLSFO samples, with some vessels reporting sludge formation, fuel pump wear, and piston ring damage. Attention then shifted towards VLSFO stems containing compounds associated with Estonian shale oil-derived streams. Subsequent market reporting in May suggested the continued presence of these components in additional Singapore fuel samples, with indications that some blends may contain materially higher concentrations than previously observed.
At the time of reporting, operational issues had not been confirmed across all affected stems, although caution has continued to be advised. While no confirmed correlation has yet been established between these fuels and reported operational issues, including sludging and one alleged case of fuel pump damage, the most recent alert does suggest the continued presence of this stream within the market. These findings do not, in themselves, confirm a wider market quality event. However, they do reinforce the broader point that unusual blend components are appearing in the marine fuel pool during a period of shifting supply flows and tighter blend economics.
At the same time, the story is not only about shortages. Some flows are opening up. Venezuelan heavy sour crude has been moving back into the U.S. Gulf Coast refining system in greater volumes, and U.S. Gulf refiners are structurally well placed to process it. Reported Venezuelan crude imports into the U.S. Gulf increased into early 2026, with Valero reportedly targeting up to 6.5 million
barrels for March and Chevron expected to lift Venezuelan exports to the U.S. materially over the same period.
That matters for bunker quality because Venezuelan crude is not a neutral barrel. It is typically heavy and sour, and many grades carry higher asphaltene and metals content than lighter sweet alternatives. In refining, those heavier, more metal-rich components tend to concentrate into the residual fraction which is where the marine fuel pool is most exposed.
The point is not that Venezuelan crude automatically creates a quality problem; it may instead support availability and improve U.S. Gulf refinery economics. However, it can also change the residual fingerprint through density, ash, vanadium, and stability behaviour.
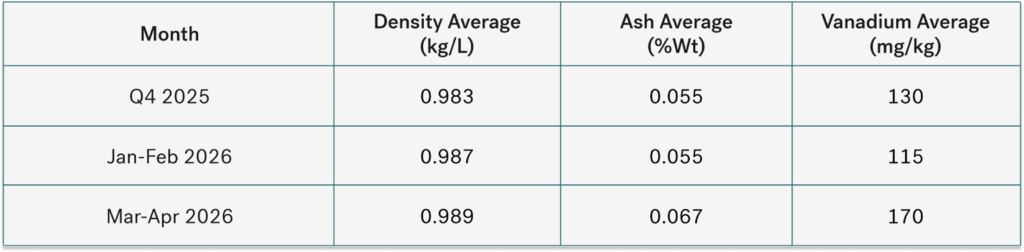
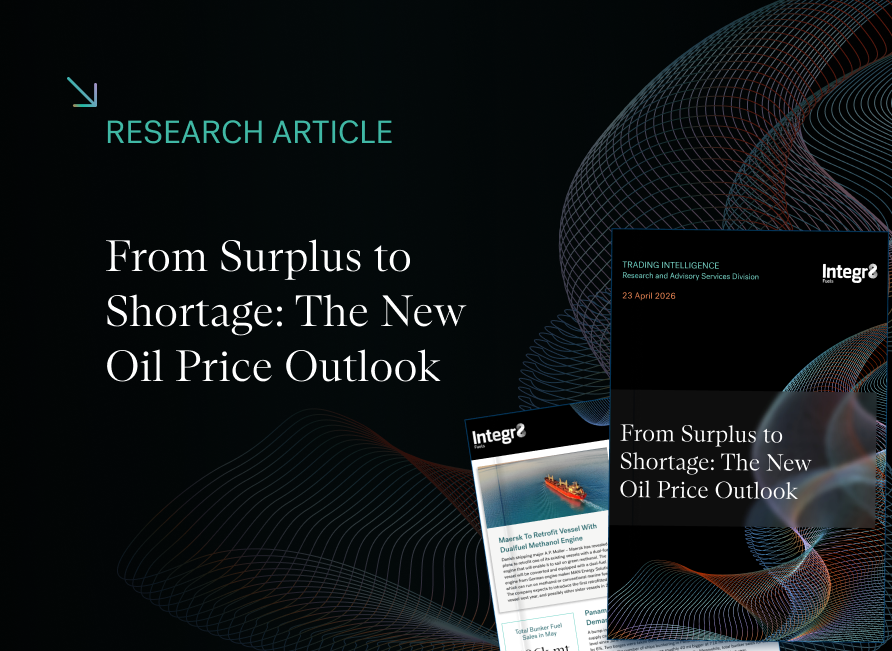
Figure 3: Data reflective of density, ash, and vanadium averages taken from fuel samples between Q4 2025 and Q1 2026. (Integr8 Fuels)
That is why the Greater Houston signal is worth watching. The formal exceedance rate does not yet indicate a major local quality event, but the fingerprint has shifted. Higher density, rising ash, and a stronger metals signal are consistent with a heavier residual pool.
This does not prove causation and should not be framed as a simple “Venezuelan crude equals quality issues” argument. The more defensible interpretation is that the crude slate and residual balancing system are changing, and the quality data is beginning to reflect that shift.
Conclusion
The conclusion is not that the market is heading for another incident like Houston in 2018 or Singapore in 2022. That would be too simplistic, and the data does not yet support it. The more important conclusion is that the conditions which allow quality risk to build are clearly present again. Bunker prices are rising, crude and product flows are shifting, blend economics are tighter, logistics are under pressure, and unusual components are already appearing in alerts outside the normal specification table. This combination is one that warrants attention.
The early data does not show a global contamination event, though it does show movement. Residual fuel exceedance rates at the main hubs have increased. HSFO is carrying the stronger signal. Singapore HSFO has shown a clear step up in ash, sodium, and water flags, and Greater Houston HSFO is developing a heavier residual fingerprint through density, ash, and vanadium. None of these realities point to a single cause. What they do point to is a bunker pool that is changing.
Quality is not only a question of whether fuel passes or fails ISO 8217. It is a question of usable energy, operational reliability, treatment burden, compatibility risk, and value loss that does not appear on the bunker invoice. Water, metals, ash, and stability behaviour all affect what the buyer receives. A clean certificate of quality does not resolve the commercial question.
The practical message is direct. This is the point in the cycle where buyers, suppliers, and operators should tighten surveillance before the claims arrive. The market may not be repeating what took place in Houston or Singapore, but the warning signs are familiar. The fuel quality data is already signalling that the pool is under stress.
Chris Turner
Technical Manager
E: chris.t@integr8fuels.com
From Surplus to Shortage: The New Oil Price Outlook
April 22, 2026
View this article as a PDF » Market volatility is quieter, but not quiet enough. Any hope that the Iran war and the hike in oil prices would be short-lived, with only a limited impact on bunker prices, can be forgotten. First, the good news: front-month Brent crude… Read More
Market volatility is quieter, but not quiet enough.
Any hope that the Iran war and the hike in oil prices would be short-lived, with only a limited impact on bunker prices, can be forgotten.
First, the good news: front-month Brent crude prices have come down from their peak of close to $120/bbl, and the massive premium paid for bunkers in Asia has disappeared. But the bad news is that we are still paying some $200/mt more for bunkers than two months ago —an increase of around 40%.
At the time of writing, front-month Brent crude is trading around the $95/bbl mark, and Singapore VLSFO prices have fallen from $1,200/mt in early March to below $700/mt. With Rotterdam prices dropping from $840/mt to $675/mt, the overall price structure looks a lot more balanced, but remains a quantum leap higher than before.
 Source: Integr8 Fuels
The huge Asian price premium was short-lived
In 2025, around 90% of crude and 75% of products passing through the Strait of Hormuz went to Asia. Therefore, it was not surprising that when the Strait closed, we saw a massive premium being paid for Asian bunkers. But, paraphrasing the oil economist Paul Frankel, the beauty and simplicity is that “oil is a liquid”, and so it can be easily moved around the world. Asian refiners have competed more aggressively for Atlantic Basin crude, taking more volumes from South America and the US. Although these crude grades are typically lighter than the ‘normal’ Middle East intake and could cause inefficiencies in the refining system, the net result is a re-balancing of crude supplies; Atlantic markets have tightened and Asian markets have eased.
This, plus a move to increase Chinese VLSFO output and some decline in product demand generally, has removed the massive Singapore VLSFO price premium seen in March.
Oil fundamentals have been turned on their head
It currently looks like we have lost around 10 million b/d of oil supply due to the Hormuz closure. Although oil demand has fallen in response to higher prices and reduced availability, this only amounts to around 1.5 million b/d so far. The net result is that supply has fallen significantly below demand, and oil stocks are now declining rapidly.
On the demand side, the IEA has already revised down its oil demand forecast for this year, taking it from a modest increase of 0.7 million b/d to an actual decline of 0.1 million b/d versus 2025 levels. The longer the straits remain blocked, the greater the demand destruction will be. However, for now, the dominant story in the fundamentals is still the 10 million b/d loss in supply.
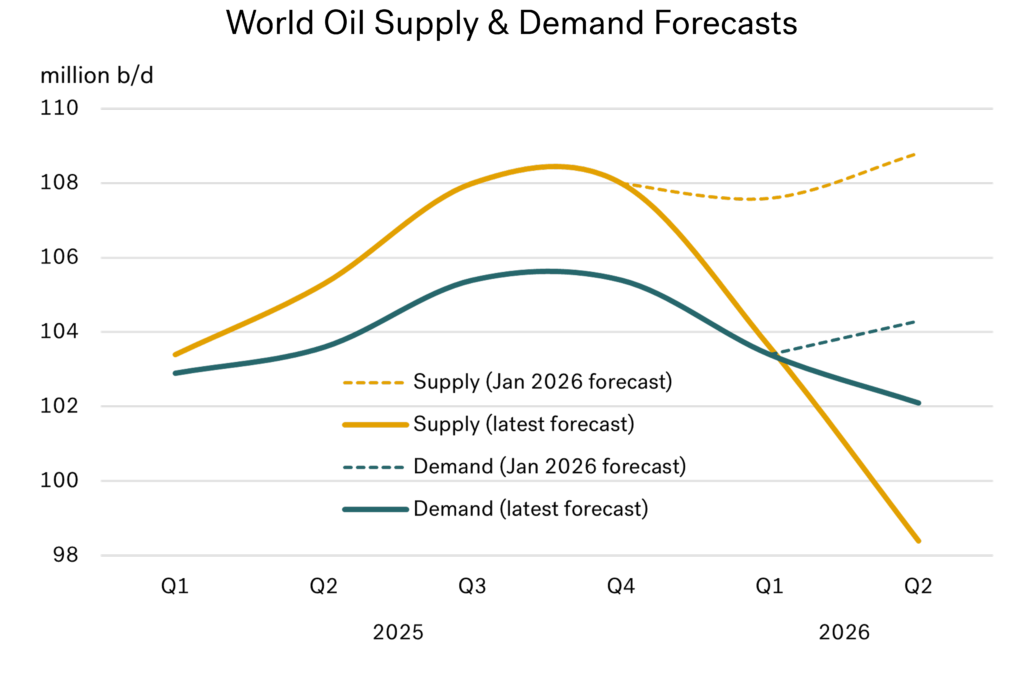
Back in January, expectations were that oil demand would be around 104 million b/d throughout this year, with supply at around 108 million b/d. The implication was a massive 4 million b/d stock build, and hence talk of much lower oil prices, even pushing VLSFO into the low $300s (see figure below).
 Source: Integr8 Fuels
The war has completely reversed these fundamentals. In the latest IEA forecasts, supply in Q2 has fallen to 98 million b/d, significantly below the revised 102 million b/d demand figure. Instead of a 4 million b/d stock build, we are now looking at a 4 million b/d stock draw. If we compare the current situation with expectations just a few months ago, it is clear why talk of Brent returning to $60/bbl and VLSFO dropping below $400/mt now looks unrealistic.
Oil stocks are now falling fast
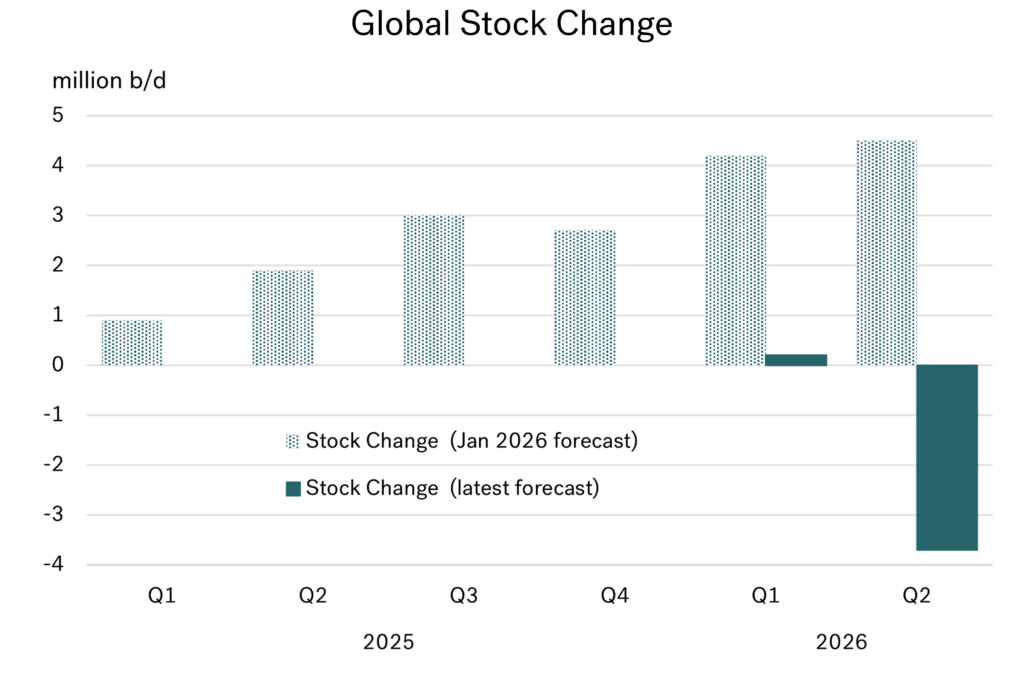
Focusing on global stock changes, there was a build throughout the whole of 2025. The perception was that this build would grow even further in 2026, exceeding 4 million b/d in both the first and second quarters of this year. That outlook was brought to an abrupt end when the war led to the closure of the Strait of Hormuz soon after attacks began on February 28.
As a result, what was expected to be a continued build has shifted dramatically: global stocks are now estimated to show only a minimal increase in Q1, followed by a draw of around 4 million b/d in Q2 (see figure below).
Even if the war ends soon and the Strait of Hormuz reopens, the market will remain fundamentally tighter. With ongoing political and war-risk tensions, oil prices are likely to stay supported.
 Source: Integr8 Fuels
What is the latest outlook for crude prices?
The status of a ceasefire, the blockade of the Strait of Hormuz, negotiations in Pakistan, and numerous other war-related developments will have a major bearing on day-to-day price movements. In fact, it is highly likely that something significant will have changed between the writing and publication of this report.
However, one thing is clear: we are now in a very different world, with current supply shortages and heightened geopolitical and war-related risks.
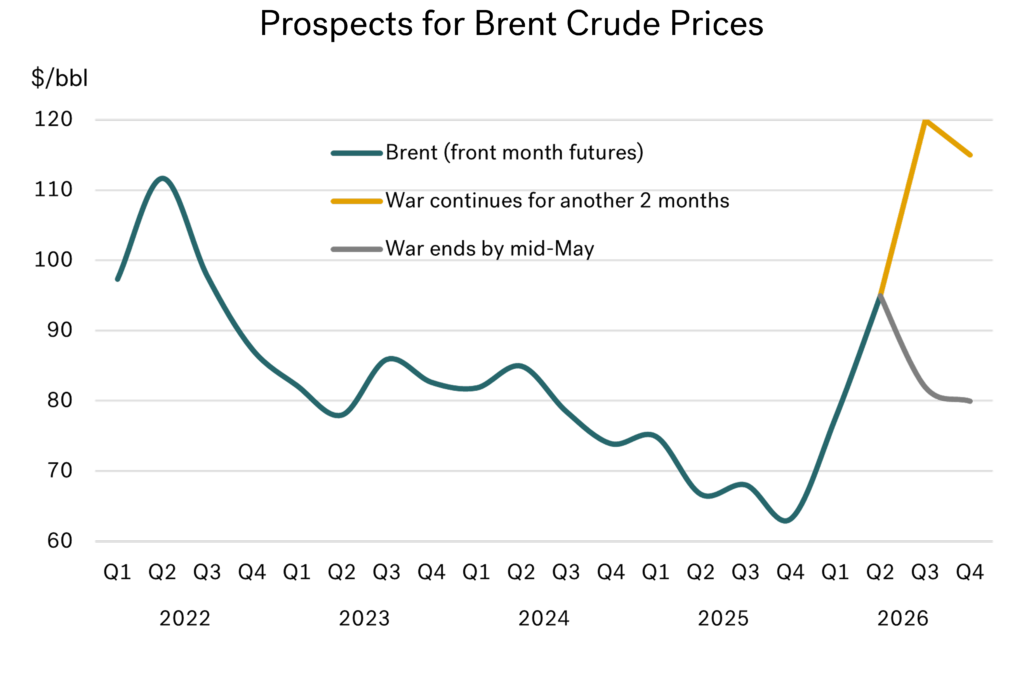
Goldman Sachs has its baseline average Brent forecast at $83/bbl for this year, and $80/bbl for the fourth quarter, assuming oil flows return to near-normal by mid-May. This compares with industry-wide forecasts of $52–60/bbl for 2026 made last October.
Goldman has also introduced an alternative scenario in its latest outlook, with Brent at $115–120/bbl in the second half of this year if there is an even later reopening of the Strait and a sustained 2 million b/d loss in oil supplies. Other analysts have suggested Brent prices could reach as high as $150/bbl if the blockade continues.
 Source: Integr8 Fuels
Where will bunker prices be for the rest of this year?
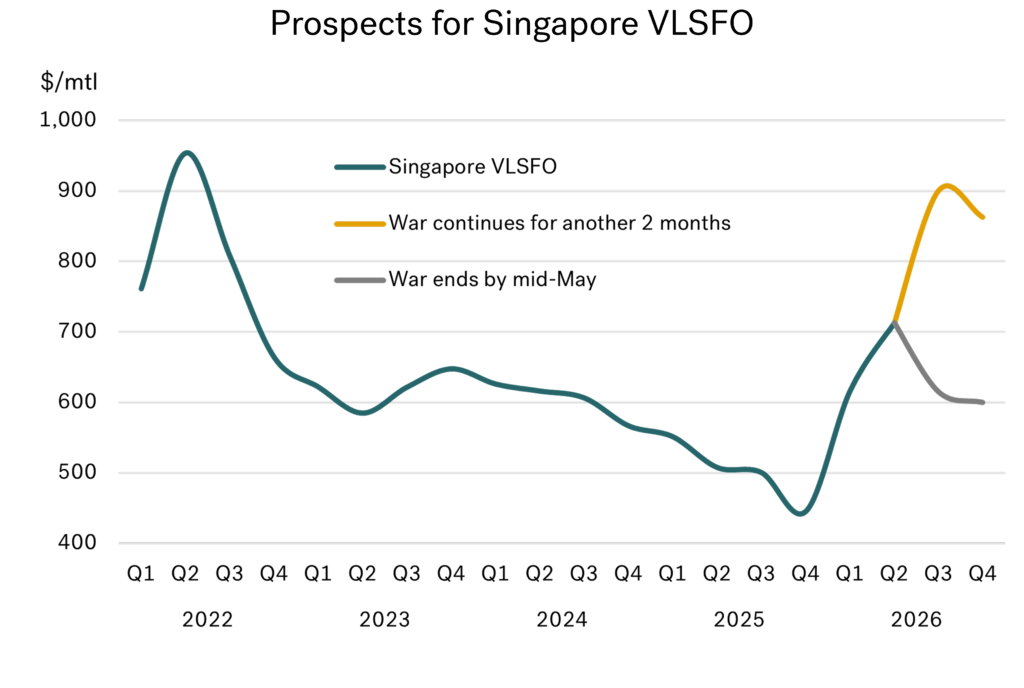
Superimposing the Goldman Sachs crude price forecasts onto the outlook for Singapore VLSFO indicates prices easing further from current level, down to around $600/mt in the fourth quarter in their base case (i.e. an end to the war and closure within the next 3 weeks). However, any further extension in the war and closure of the strait beyond this could push Singapore VLSFO prices closer to $900/mt in the second half of the year.
 Source: Integr8 Fuels
The bottom line
The nature of events so far means almost anything is possible. It does feel as though we may be entering a phase where the war could end soon, but even if that proves to be the case, prices are likely to remain significantly higher than previously anticipated.
The most pragmatic approach, therefore, is to watch, wait, and plan as best we can, given the uncertainty ahead.
Steve Christy
Research Contributor
E: steve.christy@integr8fuels.com

Bunker Quality Trends Report April 2026
April 6, 2026
Integr8 Fuels’ seventh edition of the bi-annual Bunker Quality Trends report reveals key trends relating to the quality and availability of both conventional and alternative marine fuels. Read More

Integr8 Fuels’ Bunker Quality Trends Report April 2026
Integr8 Fuels’ latest biannual Bunker Quality Trends Report explores how global availability, alternative fuels, and geopolitics are shaping an increasingly complex marine fuel market. The data assessment period for this report spans from July 2025 to January 2026.
Key findings include:
-
Global Availability: Stable at a macro level, but risk is increasingly localised. Availability is driven by supply chain complexity, port-specific variability, and operational factors rather than systemic quality decline.
-
Biofuels: Biofuel risk is operational rather than structural, with handling, compatibility, and feedstock variability now defining performance above specification limits.
-
Geopolitics & Regulations: The shift from price to value is accelerating, energy content and carbon exposure (EU ETS) are reshaping fuel economics, while regulatory and crude flow changes add new layers of complexity.
Trusted by thousands of operators, shipowners, bunker buyers and market analysts, this report is a go-to resource for mitigating risk and improving buying performance.
About the Author:
Chris Turner, Technical Manager
Chris joined Integr8 Fuels in 2017, spending several years in Singapore before relocating to Dubai. With over 35 years in oil and shipping, he has held roles in laboratory management, physical supply, broking, and trading. More recently, he has focused on technical supervision of exclusive buying and helped develop quality systems for biofuel purchasing, leading to Integr8’s ISCC certification.
An active IBIA Technical Working Group member, Chris is also a regular speaker and panellist at major bunkering conferences worldwide.

Have bunker prices outpaced the rest of the oil market?
March 19, 2026
View this article as a PDF » Last month we wrote about a floor to bunker prices: what next? Last month’s report on a floor to oil and bunker prices seemed an appropriate topic at the time, and the conclusion was Brent in the $40s and VLSFO in… Read More
Last month we wrote about a floor to bunker prices: what next?
Last month’s report on a floor to oil and bunker prices seemed an appropriate topic at the time, and the conclusion was Brent in the $40s and VLSFO in the $300s. Four weeks later, it looks like the report is already redundant and can be shelved for the foreseeable future.
Events and ‘Trump-led’ politics have caused chaos. From a commercial perspective, the closure of the Strait of Hormuz means oil is at the forefront of developments across global markets, and we are in the thick of it.
VLSFO up by more than crude, especially in Singapore
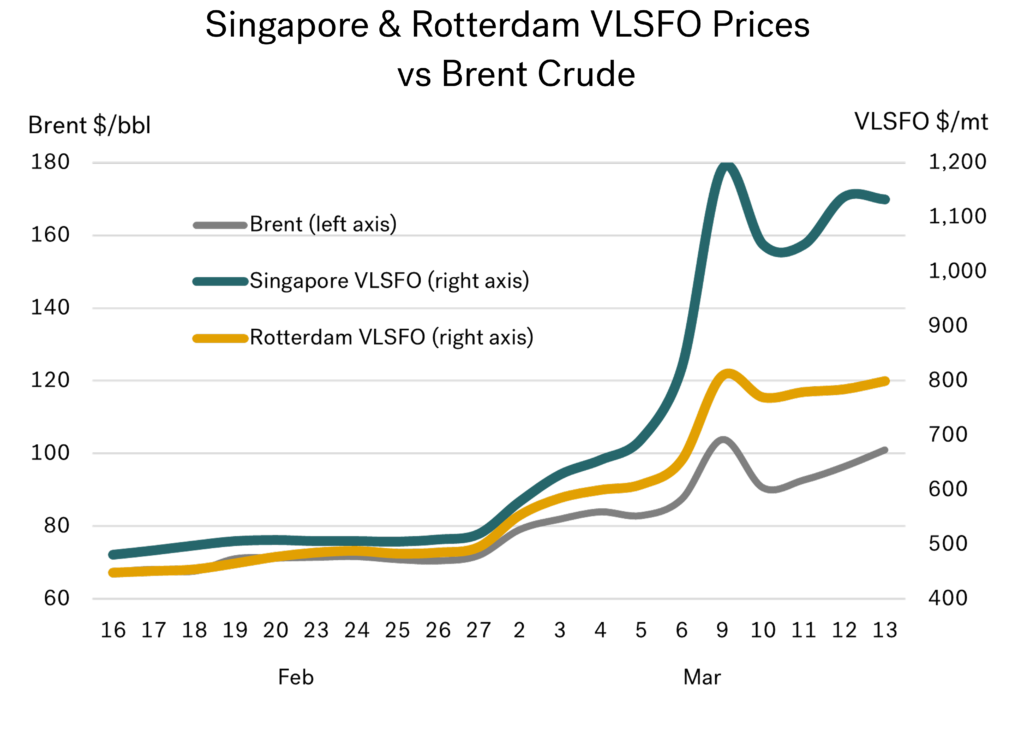
When it comes to headlines on oil pricing in the global media, it usually starts with crude, and then possibly gasoline. But behind the headlines, there is a lot more going on. The graph below (with left and right axes scaled the same) just about summarises everything for us in bunkers.
Headline Brent prices are just above $100/bbl, up by around $30/bbl (plus 45%) since the week before the war (although there was an intra-day high of $116/bbl on 9 March). However, bunker prices are up by significantly more than crude, with Rotterdam VLSFO prices up $340/mt and Singapore prices up a massive $635/mt, more than double their pre-war levels.
 Source: Integr8 Fuels
The outcome is clear, VLSFO prices have risen much higher than benchmark crude and the leap in Singapore VLSFO prices has been a lot more extreme than in Northwest Europe.
What has happened to VLSFO prices around the world?
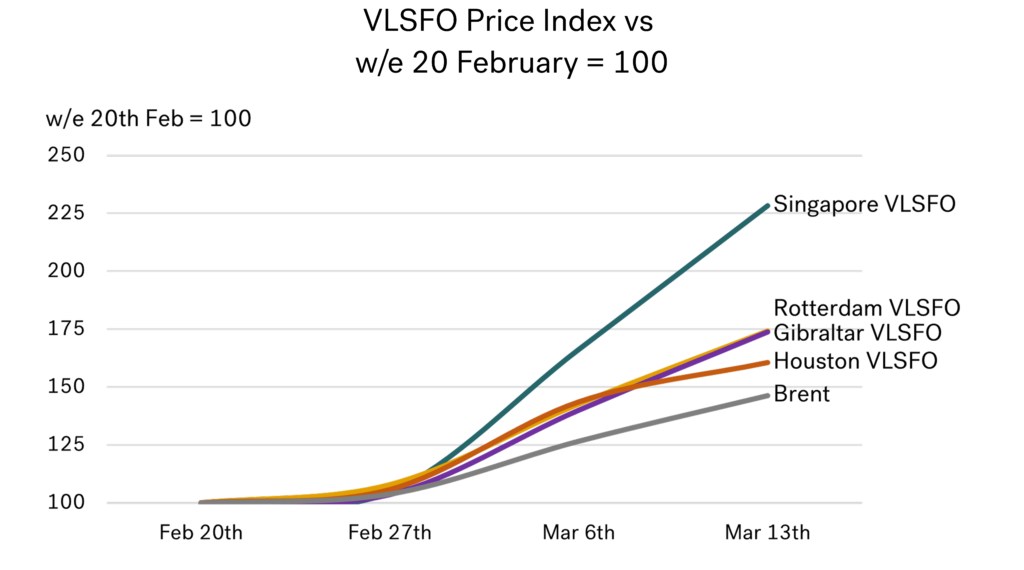
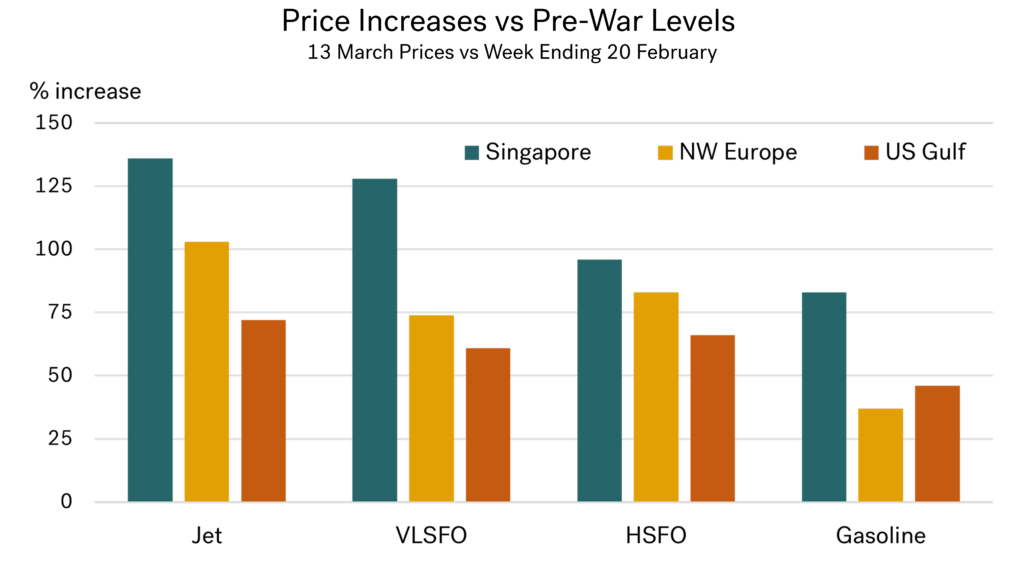
The graph below looks at key regional VLSFO prices, indexed against their weekly average for 16–20 February (i.e. before any significant expectations of the start of US/Israeli attacks on Iran on 28 February). We have deliberately left the Middle East out of this analysis.
 Source: Integr8 Fuels
This shows that the main regional VLSFO price rises have been greater than for Brent crude, but the increase in US Gulf prices was less than in Europe, which in turn was significantly less than in Asia.
Looking more closely at what has happened to VLSFO prices around the world, there is a clear case that pricing pressures become more intensive as you move from west to east.
It’s the same for HSFO: price hikes bigger than crude, with Singapore at an extreme
The trend is the same for HSFO. All price increases are greater than for crude, and the increases get bigger as you move from the US Gulf to Europe and then on to Asia. In the US Gulf, again, HSFO prices are ‘only’ 65% higher than pre-war levels (plus $250/mt), whereas European markets are some 85% higher (plus $350/mt) and Singapore 100% higher than in mid-February (plus $425/mt).
 Source: Integr8 Fuels
The brief explanation is straightforward, as the majority of Middle East crude and product exports go east, and so a closure of the Strait affects Asian markets more than others. However, there are always knock-on effects that exacerbate the situation. In this case, an obvious tightening in Asian markets has meant China and India have responded by shutting down their product export markets in defence of their own domestic requirements.
This has therefore tightened Asian markets even further and created greater uncertainty about availabilities and pricing in the near term. If that is not enough, the squeeze on European markets and extremely high freight costs have meant the ‘normal’ product flows from Europe to Asia have also come to a halt.
It does not look easy for anyone buying bunkers right now, but if you must rank them, Asian pricing is suffering more.
How does VLSFO compare with other products in Singapore?
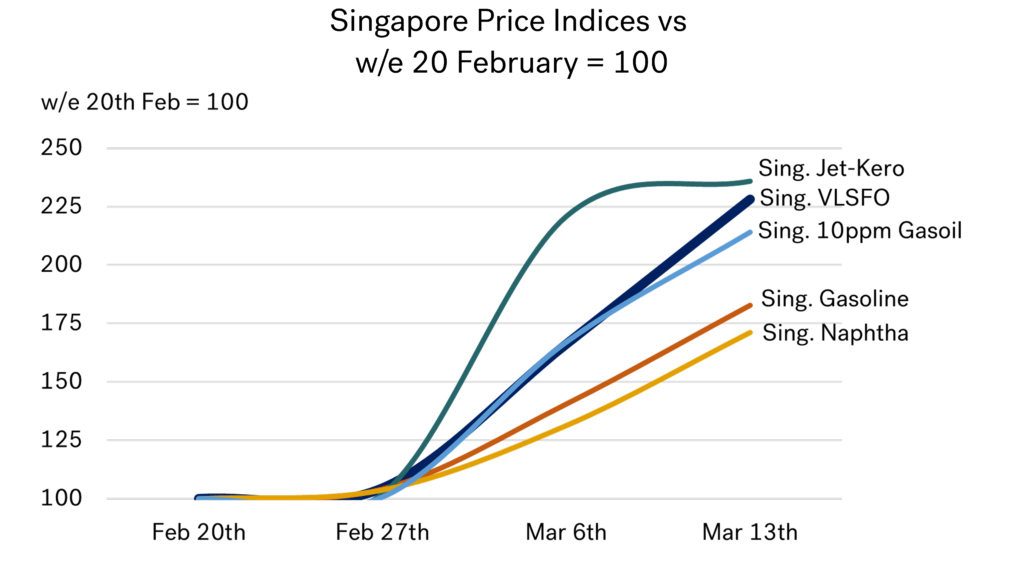
There is no doubt that the jet fuel market has come under huge pressure. Significant jet export volumes come out of the Middle East, and the ability to ramp up production elsewhere in the world is severely limited. Jet is almost entirely a straight-run product out of the refinery, and the vast majority of the world’s spare capacity is located in the Middle East.
Hence, when the war started, there was a near-instantaneous spike in jet prices, with Singapore jet-kero quotes more than doubling in the first week of the war. However, in the second week, prices then more or less stabilised. It was in the second week that we in bunkers began to feel the same extreme pricing pressures, and this is when our market ‘ran away’.
So now, the Singapore VLSFO market is in the same bracket as the Singapore jet market (and the 10ppm gasoil market), where prices have more than doubled in just two weeks. It’s difficult to say that Singapore gasoline and naphtha markets have fared better, with price rises of around 75% in two weeks, but it’s all relative!
 Source: Integr8 Fuels
How have bunker markets fared in other international markets?
If we compare percentage price increases for bunkers against jet and gasoline over the first two weeks of the war, then the graph below illustrates that the biggest gains across these products have been in Asia, followed typically by Europe, and finally the US. It also shows that bunker price increases have been close to what is happening in the jet market, and higher than gasoline in
each of the main markets; we in bunkers have seen some of the biggest percentage price hikes in each region.
 Source: Integr8 Fuels
What is being done to ease prices?
There have been attempts to ease market pressures. The IEA has announced its biggest ever release of strategic stocks, at 400 million barrels. However, this can only help to a limited extent over a brief period. Also, a greater proportion of the release is in the West, whereas the greatest need is in the East. This raises further questions, such as whether there is a willingness, or even the ability, to trade these stocks to other countries and regions.
There are also talks to establish an international naval presence to protect shipping going through the Strait of Hormuz, although at the time of writing nothing had been finalised. There are further questions here about the willingness, the rates, and the insurance cover of merchant ships transiting the area.
Ultimately, it is only the resumption of Middle East oil production and refining operations, and the safe reopening of the Strait of Hormuz, that will bring prices down to more settled levels.
Let’s hope this report becomes redundant as quickly as the last one!
The time between writing, publishing, and reading this report can be an age in these chaotic times. Let’s hope this month’s report becomes redundant just as quickly as last month’s report looking at a floor to VLSFO prices in the $300s!
Steve Christy
Research Contributor
E: steve.christy@integr8fuels.com

OPEC: How Far Must Prices Fall to Force a Move?
February 19, 2026
View this article as a PDF » We can learn a lot from looking at the past History is something we can always learn from, and in the bunker market, it is worth looking back to see where prices have previously found a floor. It may… Read More
We can learn a lot from looking at the past
History is something we can always learn from, and in the bunker market, it is worth looking back to see where prices have previously found a floor. It may not be a guarantee of what will happen, especially in extreme circumstances, though it does indicate where prices have hit a low and bounced back.
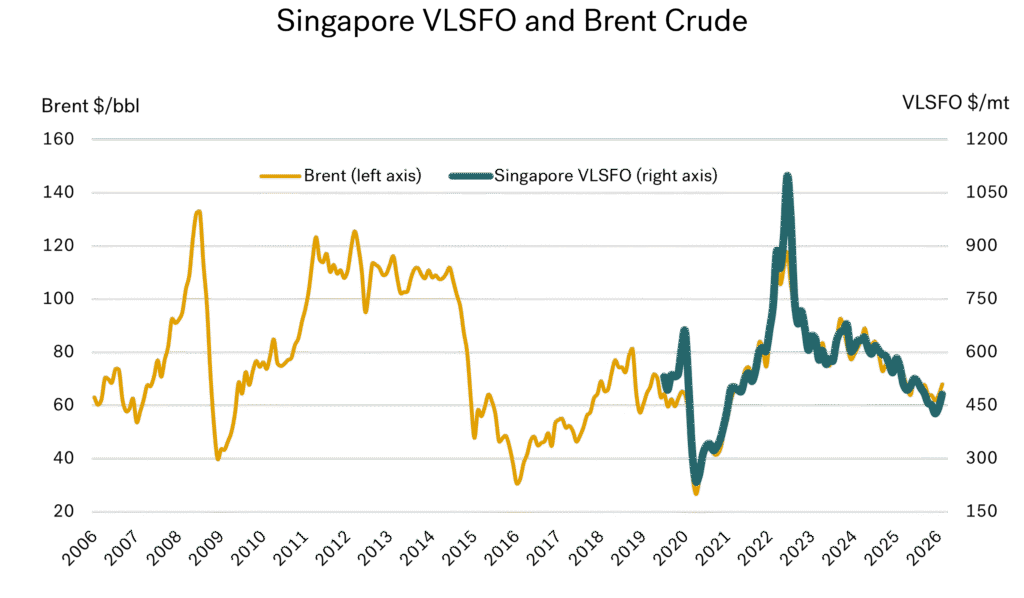
The graph below illustrates the long-run, 20-year history of average monthly Brent crude oil prices, along with prices for Singapore VLSFO as introduced in late 2019. As we have covered in many of our previous reports, VLSFO prices do ultimately track crude prices.
 Source: Integr8 Fuels
From the graph above, there have been three distinct periods over the past 20 years when we have seen ‘low’ oil prices, where Brent fell below $50/bbl. The first period was in 2008/09 with the global economic crisis; the second was in 2015/17 with an oil supply glut; and the third, most recent period, was in 2020 with the global COVID-19 pandemic.
The first and last of these periods were driven by extreme global events that affected all industries and markets, prompting major interventions from OPEC — unlike in 2015.
OPEC has the power to raise & cut production
OPEC is the marginal supplier of oil in the industry and has shown a strong ability to respond and manage prices within a reasonable range. This means raising output if oil prices are going sky-high and damaging the global economy. It also means cutting production if prices are too low, which would then damage economies of the OPEC producers.
The core OPEC decision-making process has often been between the strong alliance of Saudi Arabia, UAE, and Kuwait. More recently, other producing countries have aligned themselves to OPEC, forming the OPEC+ group. For simplicity, this report focuses on Saudi Arabia’s response — as the most influential member of OPEC — rather than on the collective group.
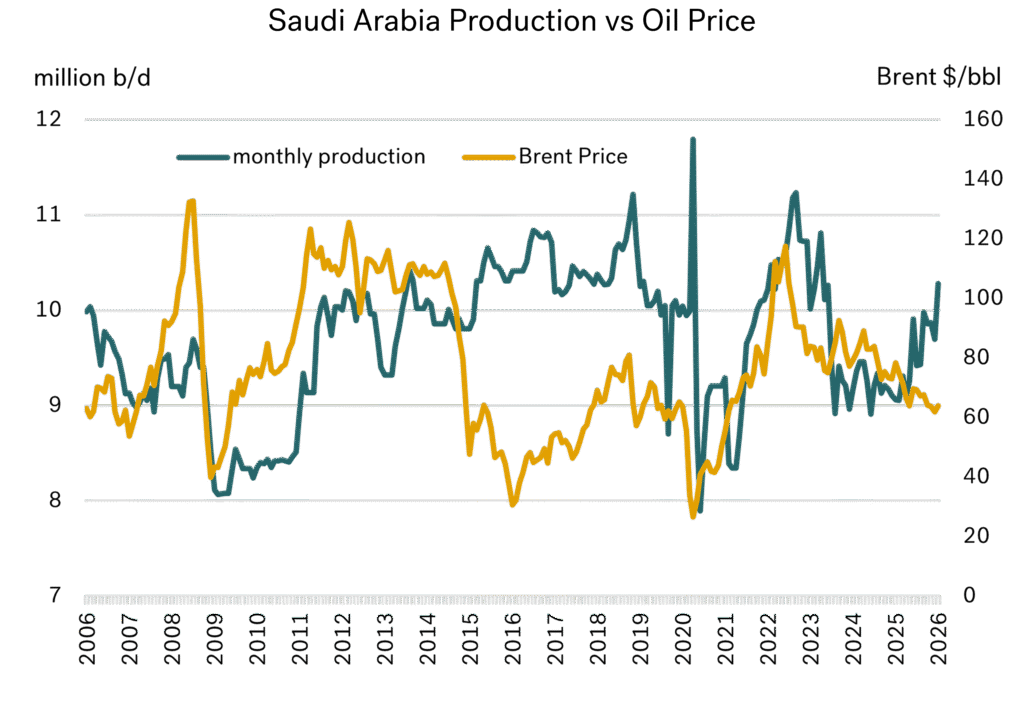
In the 2008 global economic crisis and the 2020 global COVID-19 pandemic, OPEC clearly demonstrated their ability and willingness to manage oil prices. In 2008/09 when oil prices fell, Saudi Arabia cut production from 9.6 million b/d to 8.1 million b/d (a 15% fall) and as a result, oil prices rebounded from a $40/bbl low.
When crude prices hit $80/bbl Saudi Arabia (and OPEC) responded again, increasing production to 10 million b/d to prevent prices going sky-high. The same occurred in 2020 with the COVID-19 pandemic, prices collapsed and production was cut. As prices rebounded, the production taps were opened.
 Source: Integr8 Fuels
However, there was a noticeable difference in the 2015/17 oil supply glut. During this period, Saudi Arabia maintained production in the 10-11 million b/d range and prices only picked up gradually over the following two years to around $70/bbl, as oil demand increased and ate into the surplus.
The 2015/17 market is similar to the conditions we face today
The reason we have looked so carefully at 2015/17 is because it closely matches the situation we are in today, although this time around the potential supply-glut is led by low growth in world oil demand rather than a sharp increase in oil supply.
Current prices haven’t fallen to the $30-40/bbl lows of 2015/17, but they have been under downwards pressure and despite this, Saudi Arabia has raised production from 9.1 to 10 million b/d over recent months. This is obviously good news for bunker buyers, though not for oil exporters!
What will OPEC do?
There is a lot that goes on behind the scenes to decide whether OPEC cut or raise production. Saudi Arabia and others want to defend market share, so are unlikely just to keep cutting production, but they also need to protect revenue. So, what is a minimum level of production and a minimum level of revenue that Saudi Arabia is likely to work with.
As shown in the graph below, for almost all the past 20 years Saudi Arabia has produced between 9 and 10.5 million b/d. It is currently towards the high end of this range and so if pricing were to go ‘too low’, it is conceivable that Saudi Arabia could cut output by around 1 million b/d.
 Source: Integr8 Fuels
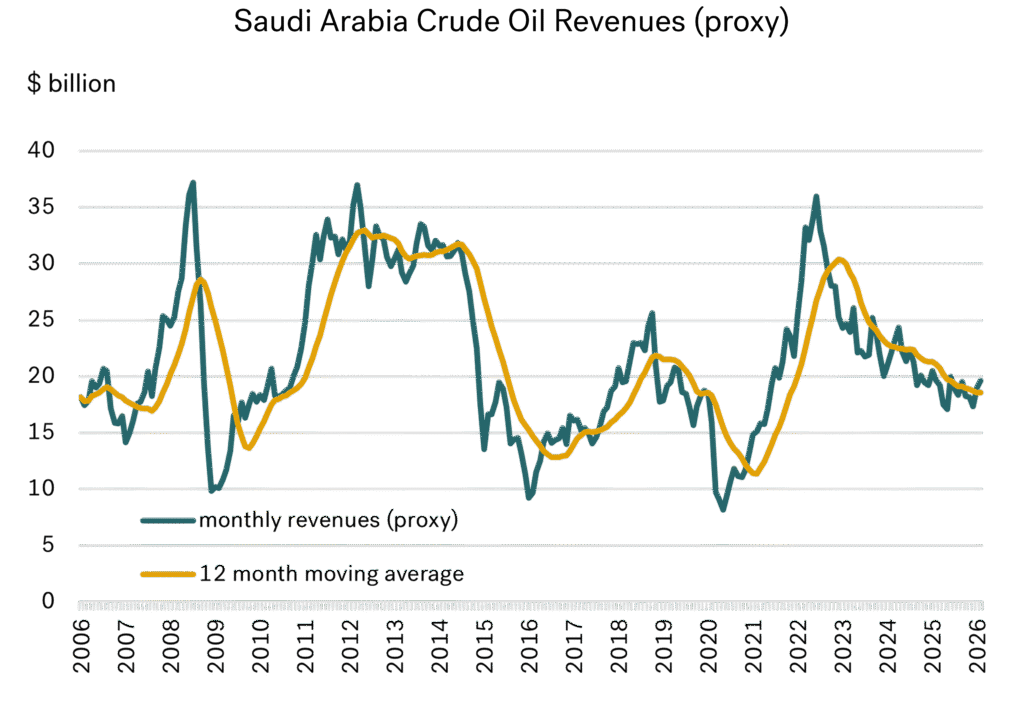
The following chart is a proxy to Saudi crude revenues, based on monthly production and an adjustment to monthly Brent prices (no adjustment for inflation is made). On this basis, it appears that $15 billion per month is the low end of the range. Over the past three years, revenues have fallen from a high of $30 billion per month however, they are still around $20 billion currently.
 Source: Integr8 Fuels
Given this, there is currently no pressing need for Saudi Arabia, or the rest of OPEC to push for production cuts and higher prices.
At what level could Saudi Arabia respond?
If Saudi Arabia continues to produce at around 10 million b/d and Brent prices are in the $60s or higher, then market share and revenues are unlikely to be an issue. If Saudi Arabia continues to produce at 10 million b/d and Brent prices fall to the mid $50s (as some analysts have forecast), estimated revenues would be at around $17 billion per month. This estimate sits towards the low end of the historic range, but may still be considered acceptable. It is only when Brent prices dip into the $40s that the revenue calculation is tested at the extreme lows of less than $15 billion per month. At this point, a change in strategy and production cuts could come about.
Based on this analysis, OPEC production at current levels and Brent prices in the $60s is unlikely to illicit an OPEC response to cut production and push prices higher. Even prices in the mid to high $50s could give OPEC an acceptable market share and an acceptable level of revenue. It is only when Brent prices fall to the low $50s that OPEC revenues would be squeezed. At prices in the $40s, revenues fall to historic lows (even before inflation is considered) and could trigger an OPEC response.
How low can bunker prices go before OPEC intervene
For those of us in bunkering, this could mean no OPEC response if Singapore VLSFO reaches $400/mt. If it reaches $350-375/mt on a sustained basis, then we should be wary of an OPEC response to cut production and raise oil prices. To summarise, at $300/mt prices we should expect OPEC to cut production and raise prices—until then, let’s monitor analyst theories and enjoy the current relatively low bunker prices.
Steve Christy
Research Contributor
E: steve.christy@integr8fuels.com

Geopolitical Risk is High, but Oil Prices Remain Contained
January 22, 2026
View this article as a PDF » Recent geopolitical events would normally send shockwaves through the market—but not this time. Going back to December 2025 – What predictions would you have made about oil prices if you knew the following events would take place over the… Read More
Recent geopolitical events would normally send shockwaves through the market—but not this time.
Going back to December 2025 – What predictions would you have made about oil prices if you knew the following events would take place over the next month:
- The US military will enter Caracas, Venezuela and capture President Maduro and his wife.
- Major and widespread protests breakout in Iran against the regime, with hundreds dead and thousands injured, plus the US threatening military strikes against Iran.
- President Trump looking to ‘takeover’ Greenland, potentially implicating the future of NATO.
- The US launch air attacks in Nigeria against militants linked to the Islamic State (IS).
- The US seize a number of sanctioned tankers linked to Venezuela.
Additionally, Russia’s intensifying attacks on Ukraine, Ukraine’s drone attacks on Russian oil infrastructure in the Black Sea, as well as President Trump’s tariff threats tied to Greenland, Iran, and the ongoing Gaza ceasefire efforts.
Having covered the oil markets for many years, my reaction to even just a few of these events would have been to say we would see a massive increase in oil prices, without necessarily quantifying how big ‘massive’ is—but things have changed.
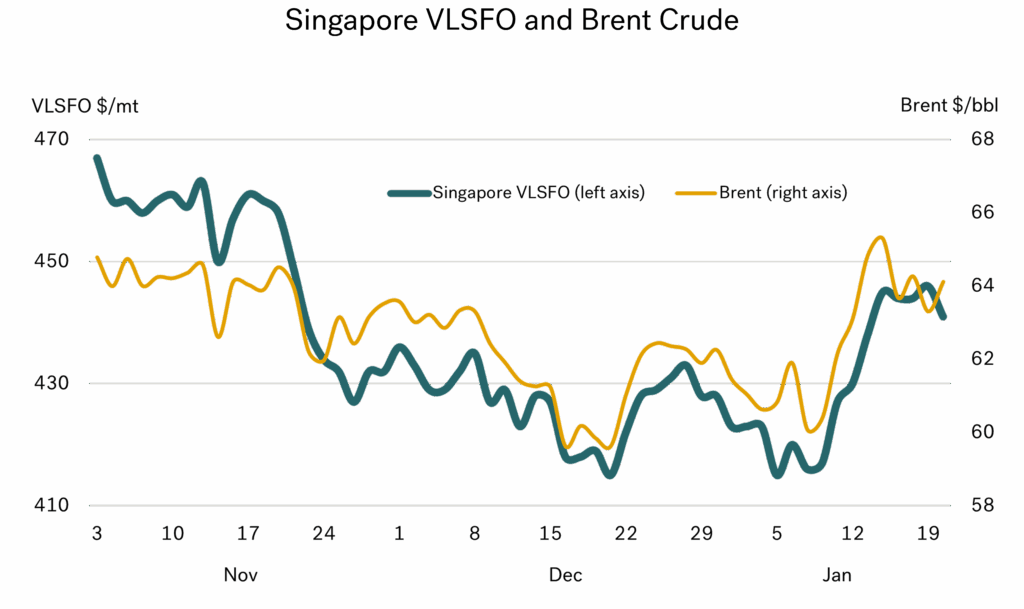
Crude is up by just $4/bbl (6%)
We have seen the above global events take place since our last report of 2025, and they all possess a potentially heavy bearing on the oil market. However, we have seen Brent crude prices rise from $60/bbl on the 19th of December, to only $64/bbl on the 22nd of January. So, the actual rise in oil price has just been $4/bbl, which is not ‘massive’ by anyone’s reckoning!
 Source: Integr8 Fuels
For those of us in bunkers, VLSFO prices have tracked crude prices and have only risen by $20-30/mt from their early January lows. Given the list of geopolitical events in the past month, this could be considered astonishing. To reinforce this, bunker prices are still lower than what we were paying in November!
We have to come to grips with a new world order
The global environment has clearly changed—have we become more immune to potentially very significant events and uncertainty on the world stage?
Looking at monthly average VLSFO prices being paid, the continual slide since mid-2025 has come to an end, but look at what it has taken to do this. In Singapore we are still paying $150/mt less and in Rotterdam, $125/mt less than what we paid last January, roughly a price cut of 25%.
 Source: Integr8 Fuels
This does not necessarily set a precedent where future geopolitical events will not have a major impact on oil and bunker prices, but it does illustrate vastly different price responses to those we may have seen in the past.
The forward curve has risen, but not by much
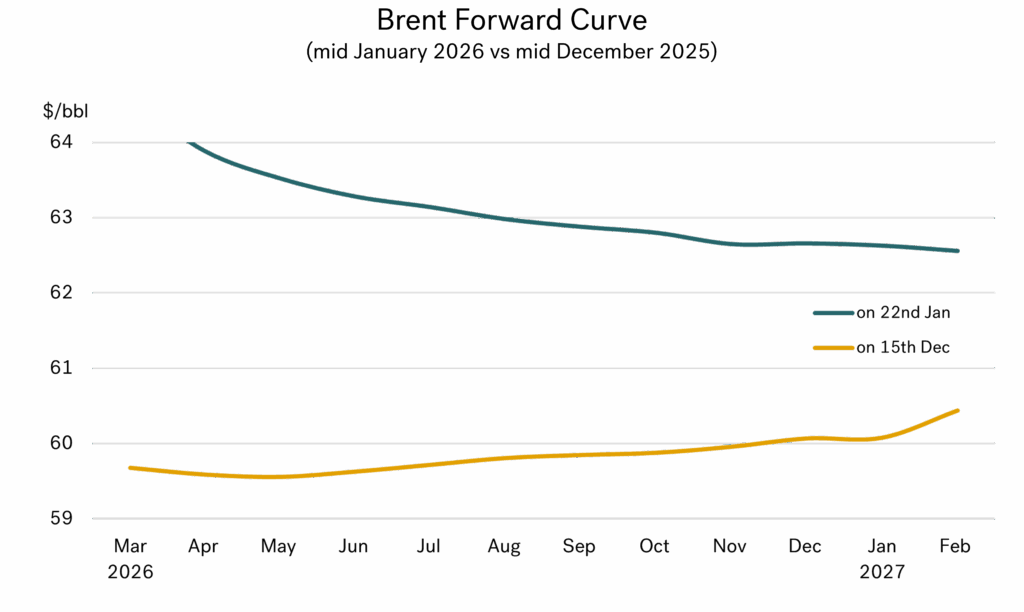
To illustrate what little impact the recent geopolitical events of the past month have had, the graph below shows the Brent forward curve from this week, versus the position in mid-December, prior to the events in Venezuela, Iran, Greenland, etc.
 Source: Integr8 Fuels
As outlined, March contracts have risen by just over $4/bbl and outer months in the second half of this year are only $2/bbl higher than a month ago. This is quite a muted response to what has happened and what could potentially happen in the coming months.
Latest forecasts still show low oil prices for this year and next
Goldman Sachs has reinforced their views of a ‘low oil price’ world for this year, with their Brent price averaging $56/bbl for 2026 and falling to a low of $54/bbl in the fourth quarter. In their forecast, Goldman recognise the geopolitical risks from Iran, Venezuela, and Russia but like most other analysts, they see these military and regime risks as ‘overpowered’ by the fundamental surplus in oil supply.
The group does see some recovery in oil prices in 2027, but still only puts the Brent average at $58/bbl. This is a downgrade of $5/bbl from the previous 2027 forecast, and shows just how little the current political risks and uncertainty are having on oil price views. So, Goldman Sachs’ forecast puts average 2026 Brent prices some $7/bbl lower than today, and their average 2027 price around $5/bbl less than current levels.
The US EIA have a similar Brent price forecast for this year at $56/bbl, but they put the 2027 price even lower, at $54/bbl—an encouraging price view for bunker buyers.
Goldman Sachs’ view for longer term prices is not extreme at all
It is not until later this decade that Goldman see prices much higher than today, with their 2030-35 Brent forecast at $75/bbl. However, this is still lower than the average Brent price paid in 2024.
For those of us in bunkers, it would suggest Singapore VLSFO prices averaging around $410/mt this year and $425/mt in 2027. Even in the 2030-35 period, Goldman Sachs implies Singapore VLSFO prices of around $550/mt and Rotterdam at around $525/mt, again less than we were paying in 2024.
The biggest events on the world stage are having the smallest of impact on prices
To summarise, if we had seen anything like the current events from the last four weeks in recent years, I am sure analysts would have put their oil and bunker price forecasts much higher. Never say “never”, but for now it seems that these big episodes have little impact on what we are paying for bunker fuel.
It shows just how interesting and challenging our industry is, and that we are always learning, even after all these years.
Steve Christy
Research Contributor
E: steve.christy@integr8fuels.com
2025 in Review: A Cheerful Outlook for Bunker Buyers
December 18, 2025
View this article as a PDF » 2025 proves to be a good year for bunker buyers As the year draws to a close, journals, newspapers, and online outlets reflect on the events of the past 12 months. We are adding our own review to that… Read More
2025 proves to be a good year for bunker buyers
As the year draws to a close, journals, newspapers, and online outlets reflect on the events of the past 12 months. We are adding our own review to that list—but with a difference. Ours is a good-news story for bunker buyers, highlighting a ‘cost saving’ of more than 25% over the past year.
VLSFO buyers in Singapore started the year paying around $585/mt, now they are paying around $430/mt! It’s the same story in Rotterdam and Fujairah (among other ports); VLSFO prices are down by some $150/mt since January.
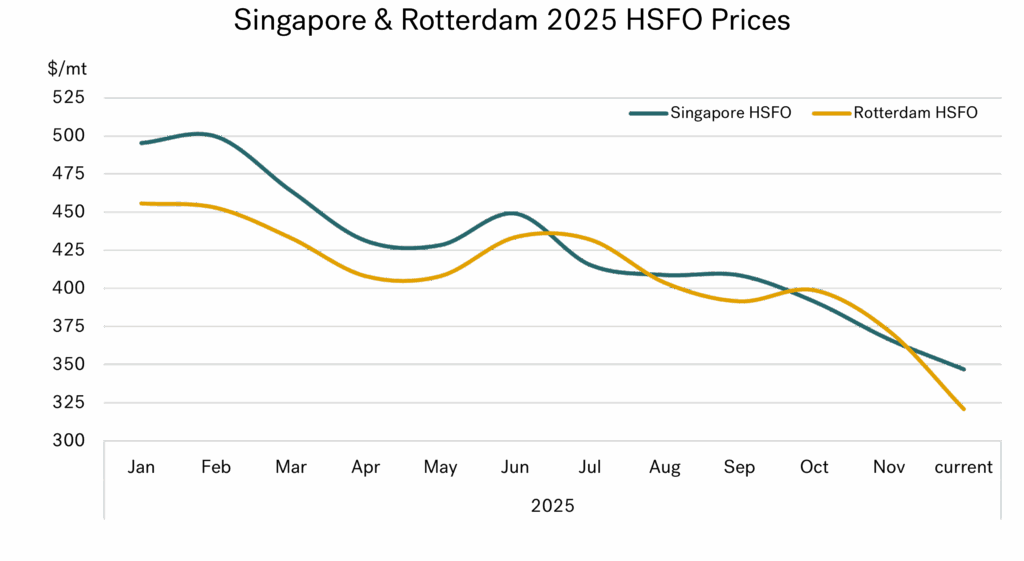
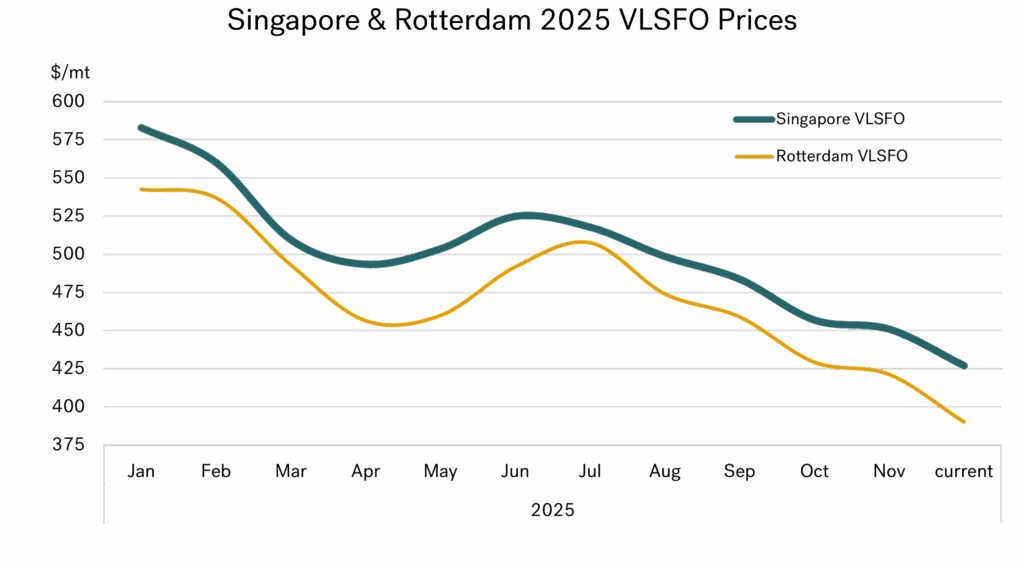 Source: Integr8 Fuels
We can also repeat the same story for HSFO buyers, with a bit more added! Prices here are down by 30%. Singapore buyers have seen prices fall from $500/mt to 350/mt, and for the past seven months they have paid more-or-less the same as buyers in Rotterdam.
 Source: Integr8 Fuels
HSFO prices in Fujairah also fell by a similar amount. This means that since the start of the year there has been a price fall of some $150/mt for Singapore VLSFO and HSFO, Fujairah VLSFO and HSFO and Rotterdam VLSFO. The only price to ‘fall short’ was for Rotterdam HSFO, but this still fell by $135/mt, and in percentage terms this drop was close to other main international bunker markets.
It’s usually fundamentals versus geopolitics, and fundamentals are winning
Throughout the year we have highlighted and analysed the two main (and conflicting) issues for our business, weakening oil fundamentals versus wars/heightened geopolitical risks. Whether the peace process in Gaza can be finalised, and an end to the war in Ukraine can be achieved, the perceived geopolitical risks today are far lower than they were earlier in the year. This means the fundamentals have taken over as the main industry price driver; and the fundamentals are weak.
The drift down in prices over the past six months (as shown in both graphs) represents these shifts in market sentiment towards the more bearish view.
Where we are today
This bearish overhang is even more pronounced at the moment. Products markets have eased as the seasonal refinery maintenance programs come to an end, and crude markets have been weakened by increasing volumes of OPEC+ production and reports of a significant increase in the volumes of crude oil onboard tankers at sea. Despite tightening sanctions against Russia and US actions against Venezuela, there are no real concerns about oil supply today.
The general view is that we are still looking at an even bigger oil surplus next year. As evidence of this, Brent front month futures prices have fallen by $3/bbl in less than two weeks, to just $60/bbl.
Where will we be next year?
Many analysts still see relatively strong supply gains next year. This is despite OPEC+ recently announcing they would continue to unwind the previous production cutbacks and raise output in December, but then hold-off any increases during the first quarter of next year.
The analysts’ view of a supply-side boost next year is based on planned increases in crude output from Brazil and Guyana, along with the further gains in OPEC+ production. Assuming these supply increases are achieved, the focus then becomes ‘how much will oil demand grow by next year, and where will the balance lie?’.
It is here there are some divergent views. OPEC is looking at a reasonably strong level of demand growth in 2026 (at plus 1.4 million b/d), and so is projecting a relatively balanced market outlook. On this basis prices would be supported, and OPEC+ could continue to unwind cutbacks and increase production from the second quarter onwards. Some of the oil majors appear to be tending towards this view as well.
However, the IEA, EIA and many analysts are not as positive on oil demand growth and the overall oil balance. In this case oil prices are likely to remain close to current levels, or even fall. This is the view we have highlighted over a number of our reports this year.
A picture to conclude
To summarise, a few analysts are towards the bullish side, but most see a growing oil surplus running into next year and Brent prices typically in the $55-62/bbl range.
The graph below illustrates some of these key findings. Brent has already fallen from $78/bbl to $60/bbl this year, and the current forward curve is extremely flat at close to $60/bbl. Although the forward curve is not a forecast, it does show the level at which people are prepared to trade; and Brent trading positions over the next 12 months are not very far away from current levels.
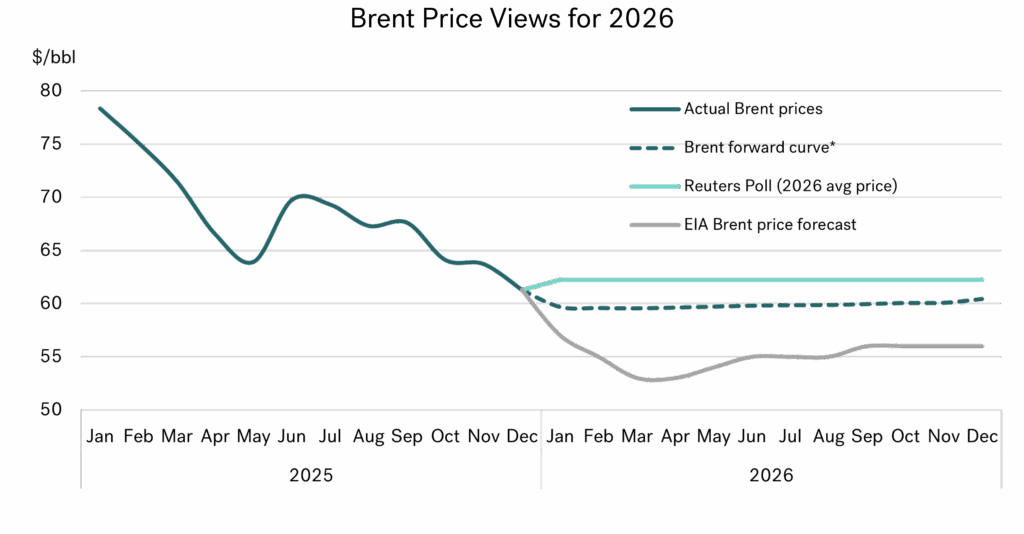
*the January 2026 forward curve price represents the ICE Brent contract for March, etc.
Source: Integr8 Fuels
Many of the published Brent price forecast for next year are in the $55-60/bbl range, and we have highlighted the US EIA’s forecast here, as one of the lower ones. The other line highlighted is the result of Reuters poll of 35 economists and analysts, giving an annual average Brent price of $62/bbl for next year. Clearly as an average, some participants will be higher than $62/bbl, and some lower, but the headline news story is one of low oil prices in 2026.
Taking the simplified view
From all the analysis, it looks like oil (and bunker) prices will be ‘low’ next year unless there we see something dramatic, like far greater geopolitical risks or a change in OPEC+ strategy to cut production and drive prices (and revenues) higher.
All we can do is reflect on the price drop this year and look out for any deflection away from a potential growing oil surplus and low prices next year.
Steve Christy
Research Contributor
E: steve.christy@integr8fuels.com
IEA Outlook: Shipping oil demand steady, but alt fuels take the upside
November 25, 2025
View this article as a PDF » The end of oil may be exaggerated It’s that time of year when the International Energy Agency (IEA) publishes its longer-term energy outlook to 2050. This extensive, 500-page report is always worth looking at, to gain insights into what… Read More
The end of oil may be exaggerated
It’s that time of year when the International Energy Agency (IEA) publishes its longer-term energy outlook to 2050. This extensive, 500-page report is always worth looking at, to gain insights into what could happen in the energy sector, where the oil industry is potentially going, and what this could mean for us in the bunker market.
In their previous reports the IEA (along with many other analysts) has highlighted a clear move away from oil and other fossil fuels over the next 25 years. In this latest report there is a new, compelling case to say that oil demand could continue rising through to 2050!
A new scenario showing oil demand continuing to grow to 2050
The IEA has again gone with three scenarios in their outlook to 2050. As in previous years, one is categorised as ‘Stated Policies’, which assumes a broad range of policies all being successfully implemented, including those put forward but not yet adopted.
The ‘Net Zero by 2050’ scenario is also one used previously. This is a theoretical case and shows a pathway that would achieve net zero CO2 emissions by 2050. We have not shown this case in the following analysis.
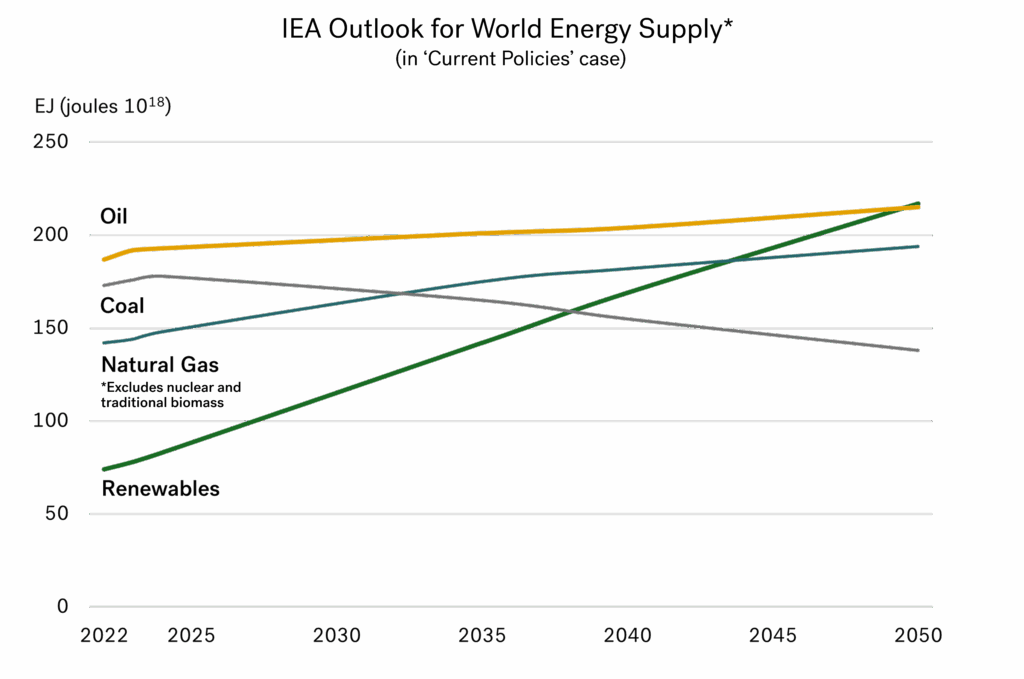
Finally, the new scenario is labelled ‘Current Policies’, based on policies and regulations already in place, plus a “cautious approach” regarding the pace at which new energy technologies are implemented. It is this latest scenario that shows oil demand continuing to rise all the way through to 2050.
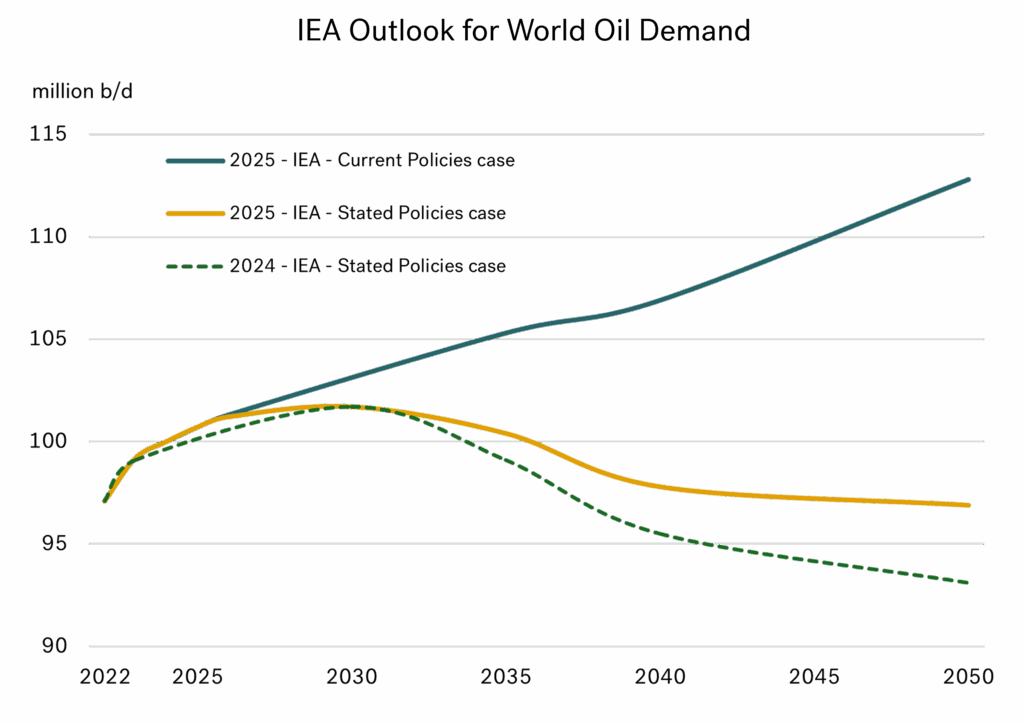
The graph below illustrates the ‘Stated Policies’ outlook for world oil demand as shown in last year’s report (2024 IEA Stated Policies case). This was the highest level of oil demand of their three cases back in 2024, and showed a world where ‘peak oil’ was reached in the early 2030s.
 Source: Integr8 Fuels
The other two lines show oil demand profiles in this year’s report. The first is the latest ‘Stated Policies’ scenario and is around 3 million b/d higher than the same case in the 2024 report. Although it still shows ‘peak oil’ demand in the 2030s, the decline is very shallow and demand in 2050 is only some 4 4 million b/d (4%) lower than current levels.
The final, and highest line, is the new, ‘Current Policies’ case. Here oil growth is driven by demand for road transport, petrochemicals, air travel, and shipping in the emerging and developing economies (oil demand in the advanced economies is falling). In this case, oil demand in 2050 is some 12 million b/d (+12%) higher than today.
Neither of the two latest cases hint at a massive demise of the oil industry over the next 25 years. There are clearly practical and psychological nuances between a rising and a falling market, but both still imply a massive oil industry, with one continuing to grow (albeit at modest levels), and the other where demand only falls back to 2016 levels by 2050.
Not the same government enthusiasm to make rapid changes
It’s not surprising the IEA has developed this new scenario. Anecdotally, we know the pace of environmental change has slowed considerably, even though last year was the hottest on record and climate risks appear to be rising. The environmental headline is that last year we reached global temperatures of 1.5oC more than pre-industrial levels, and we could be looking at gains of 2-3oC. However, the reality is that a number of countries are easing, or even reversing their efforts to reduce emissions.
The headline story here is in the US, where President Trump’s ‘One Big Beautiful Bill Act’ has renewed support for the domestic oil, natural gas and coal sectors and at the same time aims to quickly phase out tax credits for electric vehicles (EVs), along with wind and solar energy projects. The US is not the only country on this path, there are also other nations looking to slow down the move away from fossil fuels. This has been demonstrated by the attendees at the recent COP30 in Brazil, and the challenges they faced in getting an acceptable agreement together, without the US even attending.
Renewables are still the biggest feature in terms of growth
Against all these environmental issues, there is still a strong drive for more energy consumption, especially in India, SE Asia, the Middle East, Latin America, and Africa. Between the two scenarios, the IEA shows a 14% and a 28% growth in global energy demand between 2024-50.
Even though the IEA has developed a scenario where oil (and natural gas) demand continues to grow, these increases are very modest in terms of the energy demand projections. So, although the pace of growth in renewables is not as fast as in last year’s scenarios, they still account for the vast majority of incremental energy demand through to 2050.
 Source: Integr8 Fuels
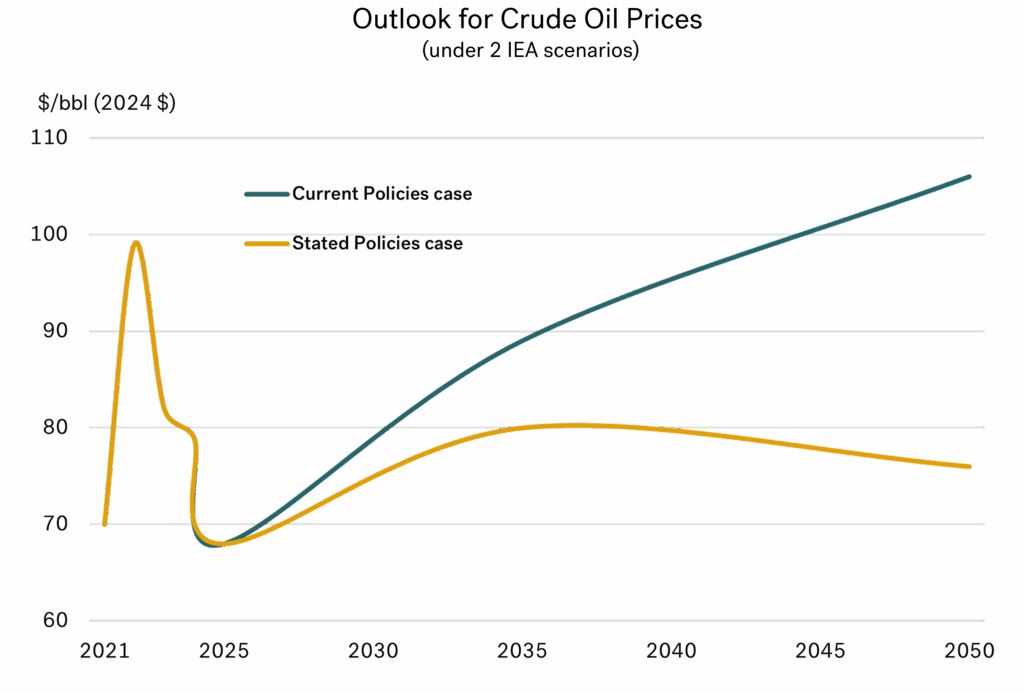
Higher oil (& bunker) prices; but not too high
Focusing back on oil. If oil demand does continue to grow, then upstream investment in the industry will be required to keep pace, and prices are likely to rise with these investment needs. The graph below illustrates the IEA scenario outlook for crude prices to 2050 in real terms, with one case showing prices not much higher than current levels, and the other to levels just above $100/bbl.
 Source: Integr8 Fuels
What it all means for the bunker market
The IEA does reference the shipping industry in its report, outlining changes in tonne-km demand and changes in the fuel mix for ship engines. The first pointer is they see a significant rise in demand for shipping in both scenarios, up by 40-50% over the next 25 years (in terms of tonne-km). However, they also see a significant increase in energy efficiency in the shipping sector.
As an overview, they see shipping’s dependency on oil falling from 90% in today’s market, to around 80% in 2035 and then to 70% by 2050. By 2050 the scenario is that natural gas and bioenergy will make up around 25% of the market, with a further 5% coming from methanol, hydrogen, ammonia, and other sources.
However, the overall shipping sector itself is growing throughout this period. So, under the ‘Stated Policies’ case, demand for oil bunkers would remain more-or-less at today’s levels over the next 25 years, and there could be a very modest increase in oil bunkers under the ‘Current Policies’ case. It means that in volume terms the size of the oil bunker market could continue at close to today’s levels for the next 25 years! At the same time, we would see a growing alternative fuels bunker market that could be equivalent to around 40% the size of the oil bunker market.
Looking at the two IEA scenarios, the growth in powering ships in the future will be taken up by alternative fuels and efficiency gains, but it doesn’t look like the size of the oil bunker market will fall. On this basis, we could see an overall industry strategy of carrying on with the oil bunker market as it is, and look towards the growing markets of alternative fuels as the area of expansion.
Steve Christy
Research Contributor
E: steve.christy@integr8fuels.com