News May 11, 2020
We are off recent price lows, but that doesn’t mean we are in a continually rising market
Just over a month ago we put out a note on the collapse in oil prices and the pressures in the market from the significant loss in global oil demand because of ‘lockdowns’ against Covid-19.
Overview
Since then, estimates of demand losses have been even greater, and oil prices took another tumble at end April (only a couple of weeks ago). At the time of the last note the biggest estimates of demand loss were around 20 million b/d for April, more recent estimates are closer to 30 million b/d.
Over the past 2 weeks prices have moved off their lows and general sentiment now seems to be a bit more optimistic. OPEC+ did come to a ‘necessary’ agreement and formally settled on a 9.7 million b/d cut in production starting this month.
However, physical oil prices still remain in very steep contango and have hit such lows there will also be significant production losses from counties outside this agreement. The key focus here will be the US, with the high-profile shale production heavily exposed. US rig counts and spending are down massively, and the net result will be a reduction in output; the question is how much, with different analysts predicting anything between 1.5-3.0 million b/d losses.
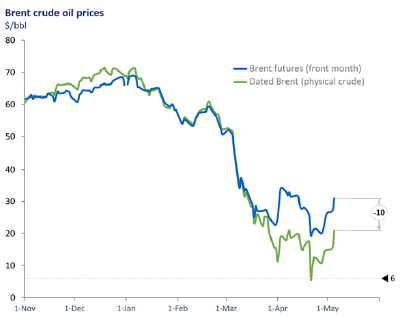
So, we are now entering the next phase in developments, with production coming down and at the same time countries coming out, or planning to come out of lock down; most visibly in growing pressures within the US to ‘open up’. These are clearly more bullish signals than we have seen, and Brent front month futures prices are around $10/bbl above their lows (from $20 to $30).
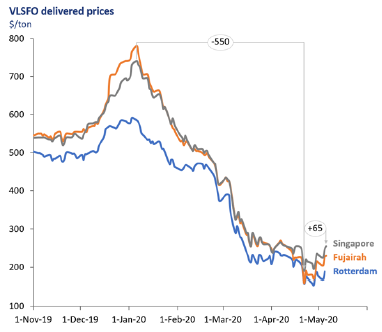
These price moves have been mirrored in the bunker market, with VLSFO down by more than $500/ton since the start of the year, but up around $65/ton in the past couple of weeks (in-line with a $10/bbl rise in crude prices).
Despite this, it is still far too early to say we are on a definite upwards trend. Oil stocks are still increasing, and this is expected to continue for at least another 1-2 months. The cuts in crude oil production are chasing the losses in oil demand, but are still not big enough to bal-ance the market today and we still have more surplus oil to come. Averaging a number of analysts’ expec-tations, they indicate oil demand was down by around 22 million b/d in April, but the highest ana-lysts were around a 29 mil-lion b/d loss.
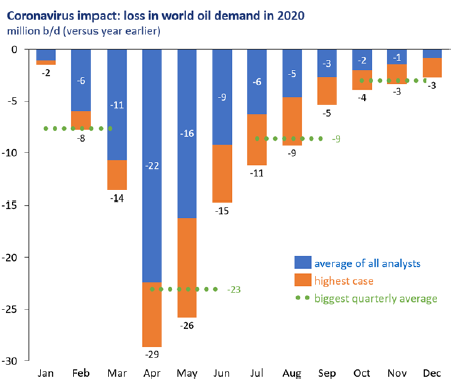
All analysts expect the losses to diminish over the year, but the pace varies; the blue columns in the graph represent an average view of monthly losses in demand versus year earlier and the incremental orange columns show the biggest estimated demand losses. Either way, the losses in April/May are bigger than any anticipated production cuts and it is only from around June/July that we are likely to see stock levels start to fall, and then from exceptionally high levels. Consequently, the price contango in the oil market may have eased slightly over the past 10 days, but it is still far bigger than we have seen historically, with physical Brent crude still at extreme levels of $10/bbl below the front month futures price. Both the absolute price and the price contango are key features we must focus on .
It is the extent of the demand loss and then how quickly demand returns, plus how big the production cuts actually are, including OPEC+ adherence and the ‘economic shut-ins’ (not only in the US, but Canada, Norway, Brazil and elsewhere). In addition, market sentiment and expectations will also play a significant role in determining the timing and extent of price recovery.
The speed at which we come out of this demand shock is still a big uncertainty. The main impacts on demand have clearly been in the jet fuel, gasoline and diesel/gas oil markets (not so much in fuel oil). Expectations are that gasoline demand will start to recover first, then diesel/gas oil and finally jet, but this may be some way down the line. In terms of OPEC+ production cuts, analysts using AIS ship tracking can get a very good and immediate handle on exports, which will go a long way to identifying adherence.
Finally, one of the more visible and used signs in the market are oil stock levels (crude and products), and although official figures for most countries are too long after the event to cause a price response, in the US there are the API and then the EIA both publishing weekly data. Significantly, these figures are still building, and price moves often reflect whether the gains are bigger or smaller than expectations. Hence oil prices are currently stuttering either side of $30/bbl for front month Brent, with gains in stock levels either bigger or smaller than predicted.
The graph below illustrates four cases to look out to see which track we are likely to be on, ranging from an extended period through 2020, 2021 and into 2022 if the demand losses are ‘bigger’ and the production responses more muted.
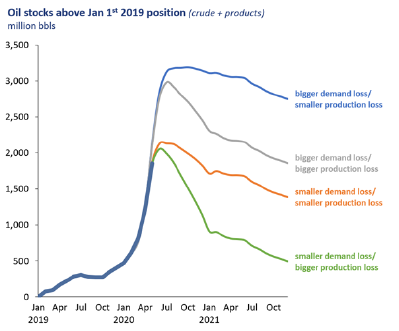
At the other end of the spectrum, if demand losses are smaller (this is still around 20 million b/d in April!) and the production impact in the likes of the US is severe, then we could be in a rapid tightening in oil markets and a rapid return to higher prices over the course of the second half of this year. The truth is we are more likely to be some-where between these two extremes, and the current Brent forward curve (which is not a forecast) is tracking closer to the orange line, at around $33/bbl at end 2020 and $38/bbl at end 2021. This would imply VLSFO prices below $300/ton for the next 12 months.
However, as more data, analysis and insights emerge we will have a greater idea of what track we are really on and how long low oil prices are likely to be with us. One thing is that in all cases oil stocks remain well above recent levels at least through to end 2021. Keep watching the stocks numbers, the price and price contango, OPEC+ and US production and finally the true pattern of oil demand.
Steve Christy Strategic Communications Director
P: +44 207 4675 860
E: Steve.C@integr8fuels.com
Posted by
Elaina Cameron
Latest articles


Contact our Experts
With 50+ traders in 12 offices around the world, our team is available 24/7 to support you in your energy procurement needs.