The oil market is bullish and crude prices are now higher than just before the pandemic started; what’s driving this and what about bunkers?
Around this time each month we tend to take a step back and look at the ‘bigger picture’ developments in the oil market. What happens here clearly underpins the price of bunkers.
The recent headline news in the oil market has been very bullish. In this report we look at why this is happening, draw some pointers for the future and see how bunker prices relate to this.
Brent now close to $76 and higher than just before the pandemic.
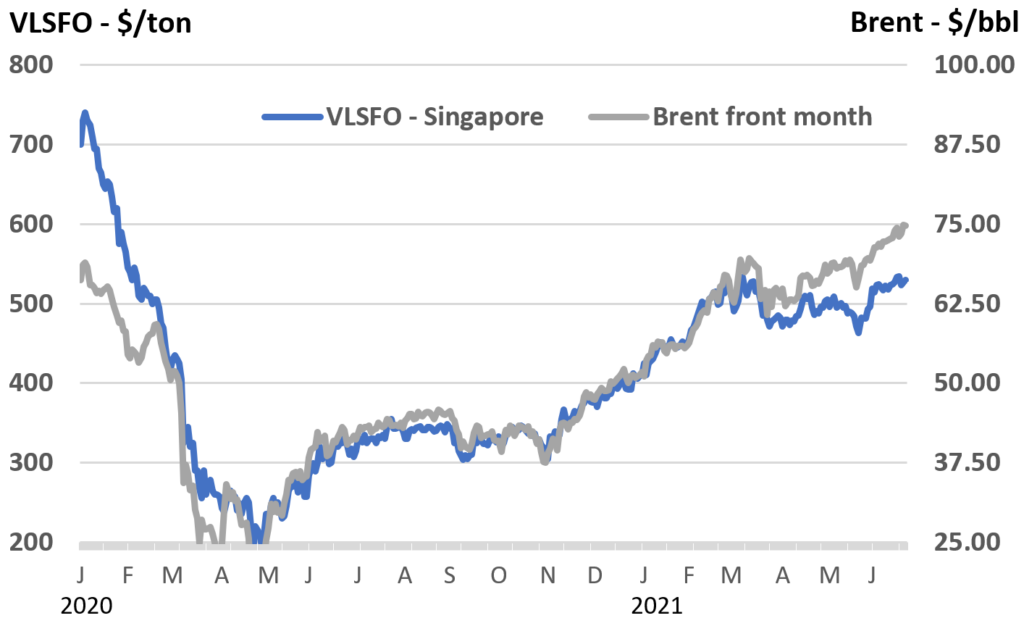
The recent hike in crude oil prices has pushed Brent front month futures close to $76/bbl, which is $6/bbl more than the January 2020 highs, just before the pandemic hit. The main drivers to this latest price rise are that oil demand is rising and expected to continue to recover, (especially in the US) and that headline stock levels are falling.
The graph below illustrates the phases where Brent crude prices have increased from their extreme lows in April last year (and how VLSFO prices have generally tracked this):
- Firstly, Brent up to and then remaining in the low $40s through
to November; - Then rising almost continuously to a peak of $70/bbl in early
March; - Followed by and easing and stuttering around $65/bbl for 2
months; - And now Brent moving well into the $70s in June.
Demand expectations in the big economies is pushing prices higher
In the report last month, we highlighted how the COVID impact on bunker demand has been far less than almost all other
As always, the market is responding a number of fundamental supply and demand factors, along with expectations and
sentiment. The current headlines centre on successful vaccination programs in the big economies, the easing in restrictions and the accompanying boost to oil demand (New York and California have both recently lifted restrictions).
These expectations are backed up by a number of analysts looking at a very positive view for oil demand increasing over the rest of this year (and into 2022). The chart below shows forecast growth in demand by country or main region from Q2 to Q4 this year and clearly emphasises the anticipated rises in the big economies of the US, India, Europe and China. The regions in this graph account for more 3 million b/d growth out of a World total just over 4 million b/d over this period; hence the significance and focus on these countries.
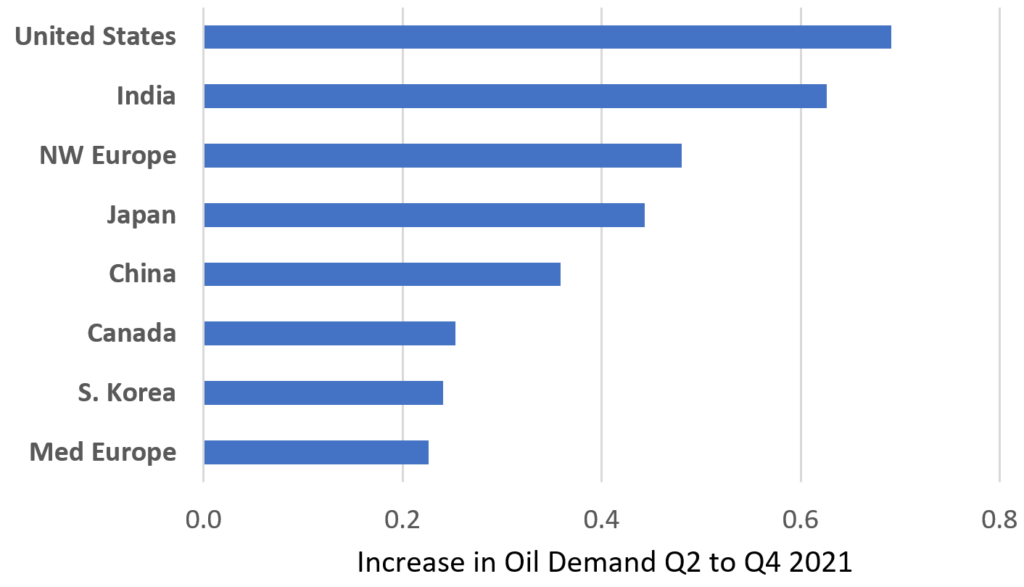
News on vaccination programs, easing in restrictions and Covid infections in these big economies will strongly influence market sentiment on prices.
US weekly stocks data add to the bullish sentiment
The recent very positive sentiment can be further backed up by looking at product stock levels. The problem here is that almost all data is at least 1-2 months delayed. The exception is in the US, where weekly data is published and does ‘grab’ the headline news. Although this is typically later revised with monthly data, the weekly stocks release (API on Tuesdays and EIA on Wednesdays) can have a huge influence on futures prices.
The graph below shows the published development in US gasoline, distillate and jet fuel stocks combined, covering 2019, 2020 and 2021 so far. Using 2019 as a reference position, it is clear the 2020 collapse in oil demand related to the pandemic meant oil stocks surged (not only in the US, but also globally).
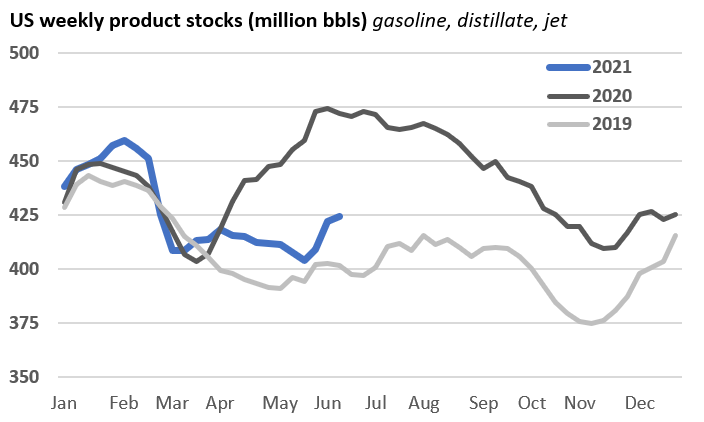
However, more recently US product stocks have been running relatively close to 2019 levels, and way below the peaks seen this time last year. If the strong demand expectations in the US play out, then published stocks data is likely to remain ‘more balanced’ and so be price supportive; of course, the converse is also true. The weekly US stocks data is very often a contributing factor to price sentiment.
Crude prices have risen, but what about bunkers?
Combining these more recent bullish sentiments has pushed crude prices to above pre-pandemic levels and the following graph is a closer focus on what has happened over the past 8 weeks. There has been a near continuous rise in Brent crude prices towards $75/bbl over this period. However, although VLSFO prices generally moved with crude in May, this has not happened in June; VLSFO prices in Singapore have remained relatively flat whilst Brent has climbed another $4.50/bbl
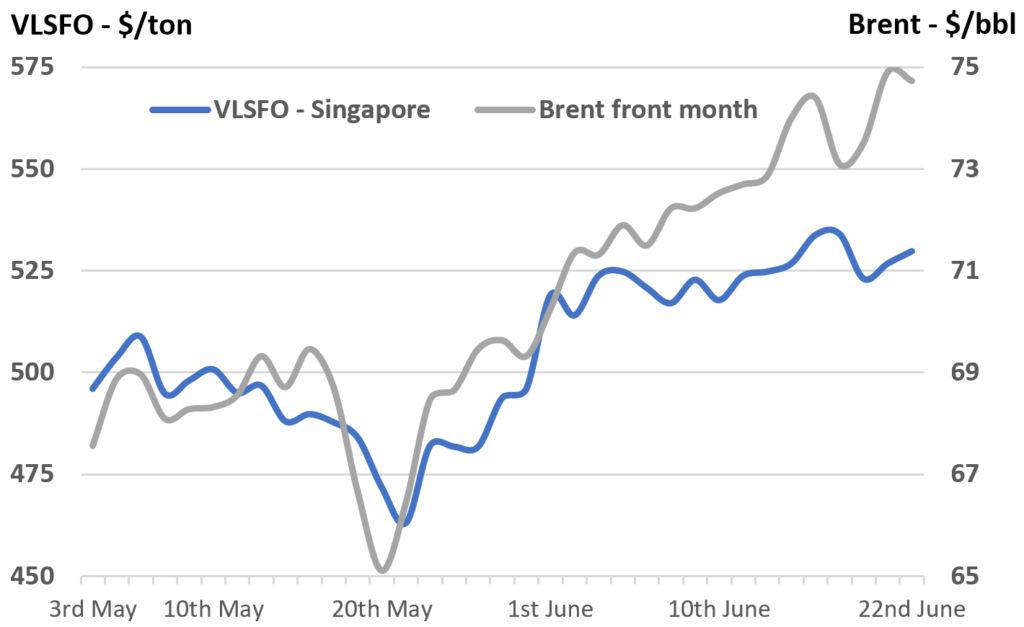
In our report from late May we highlighted the possibilities that VLSFO prices are likely to weaken relative to crude as demand for other products rise. This could be the case here, with further increases in product demand in the big economies. However, these are subtleties, and crude prices will continue to generally underpin prices in our sector.
Demand has been the story, but supply will also become a feature
Looking ahead, market sentiment will be driven by the confidence in oil demand increases in the US, India, China, other Asian economies and also Europe; headline stories on infections, lockdowns and vaccinations are key to watch.
This report is a focus on the demand side issues that have led to the latest increase in crude prices, but in the outlook we also have to take oil supply into account. With crude prices getting back to above pre-pandemic levels, it can be argued that the OPEC+ agreement to cut production has worked well. At its height, this group removed around 5 million b/d supply from the market.
At their June 1st meeting, OPEC maintained the existing plan to raise production through to July, and a focus will now be on what decisions are taken at their July or possibly August meetings to raise output.
Apart from demand, the other factor for the group to consider is non-OPEC production and here only limited gains in output are expected over the remainder of this year. In fact, despite the recent sharp rise in oil prices, US production increases will take some time to come through.
Indications are that increases in cash flows are going more towards debt reduction rather than any big rise in drilling activity. As a result, total oil output in the US is forecast to remain fairly flat for most of the rest of this year. Also, the US/Iran negotiations on a nuclear agreement and the lifting of sanctions are expected to go on for longer, pushing back any immediate large-scale increase in Iranian crude exports to the market.
Looking at the demand and supply fundamentals, there is significant room for OPEC+ to implement increases in production over the rest of this year, as long as demand increases are in line with general expectations.
Also, OPEC has traditionally managed prices not going ‘too high’, so as not to kill off economic growth and subsequent increases in oil demand. Hence, the internal pressures to raise output and the political direction not to let oil prices escalate too ‘excessively’, gives the OPEC+ group the perfect platform to continue raising output.
Demand could hit record highs next year, but prices….
Many forecasters are raising their price expectations for this year, with a general target of Brent in the $70s. Some people are even talking about $100 crude oil prices, and these comments often grab the headlines. Never say “never”, but if prices remain around current levels, the OPEC+ group will raise output and supplies will increase over the rest of this year. On a final note, behind all of this, demand for oil is still rising, and global consumption is forecast to exceed 100 million b/d later next year and even reach record highs by the end of the year. Concluding, almost everything here is relatively bullish; we keep watching the demand factors, what OPEC+ does and Iran to see how things actually pan out.
Steve Christy
E: steve.christy@integr8fuels.com

Contact our Experts
With 50+ traders in 12 offices around the world, our team is available 24/7 to support you in your energy procurement needs.

