News June 25, 2020
Oil Fundamentals are tightening and prices rising, but if and when will we see $400 or even $500 VLSFO Prices
We are now around 4 months into this global pandemic, and in the analysts’ world ideas about oil demand and how it may rebound are converging. In mid-April we did a webinar reflecting the wide range in expectations of the collapse in global oil demand and how quickly it may recover. At that time views varied from a ‘minimal’ loss of 15 million b/d in April (versus April 2019) up to an extreme case of a 28 million b/d loss. Also, the perception back then was that oil demand would recover back to 2019 levels by the end of this year.
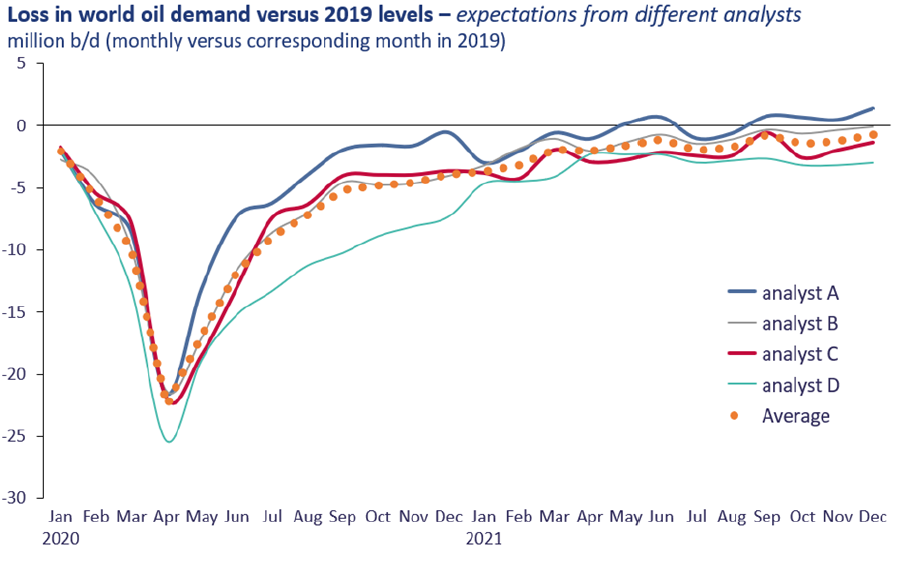
Now, ten weeks later, a number of analysts are more aligned on a demand loss of around 21 million b/d (mid-way between the early indicators), but the impact is now expected to last much longer. Most analysts are now suggesting oil demand will not return to 2019 levels until early 2022. So, the impact is not as deep as some first feared, but it is expected to go on for longer.
The graph below illustrates this, showing the latest views from a number of analysts on how they see the loss in oil demand developing after the extreme position in April (each month represents the loss versus the corresponding month in 2019). Three of the four analysts’ forecasts are relatively similar, with one more extreme on the downside. Averaging the four gives a pattern where demand is rebounding, but still slightly below 2019 levels even by end 2021.
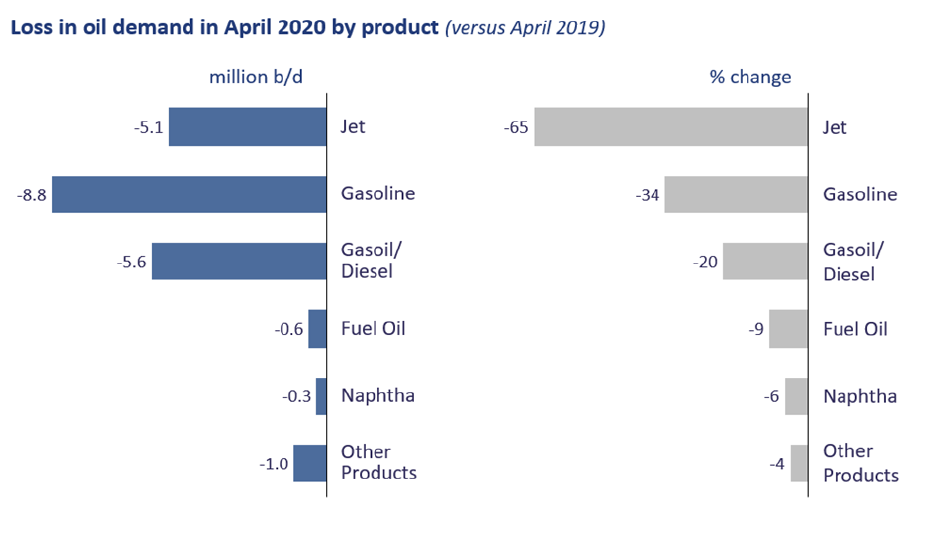
When we look at the bunker business, the demand impact on us been relatively minor, at around 9% loss in fuel oil demand. It has been the other transportation sectors that have taken the big hit, and especially the jet market, where two-thirds of the demand has been lost. However, it is not the bunker market that determines bunker prices, it is the overall oil fundamental backdrop that largely determines the absolute price and we are going through one of the most extreme oil markets ever seen.
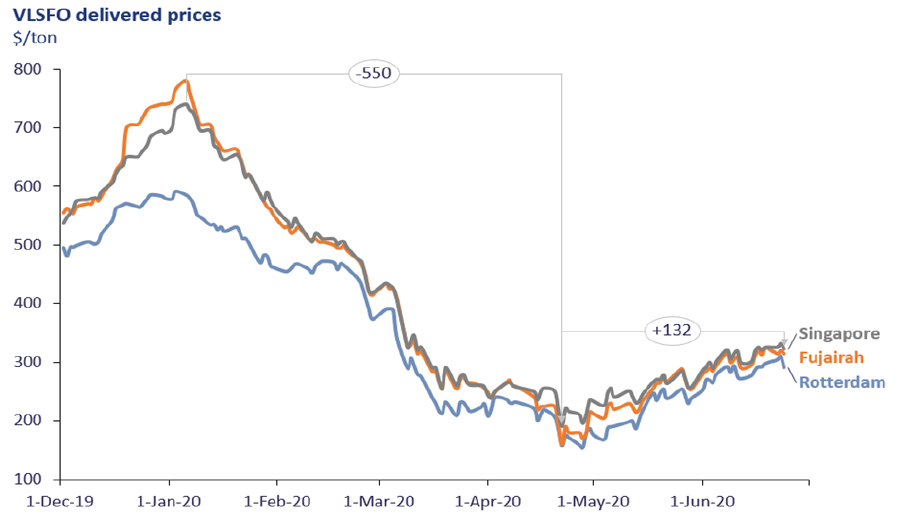
Price does tell us a lot, and we have seen VLSFO in Singapore fall from $740/ton at the start of the year to a low of $190 in late April and back up to around $320 today. The shape of this curve mirrors the oil fundamentals; collapse as demand falls much faster than supply and rebound as demand picks up and supply is cut.
The ‘worst’ is over and oil fundamentals are now tightening; demand is rebounding fast as countries come out of lockdowns, and production has fallen with the OPEC+ cuts along with loses in output from low oil prices (most notably in the US). The question is, where do prices go from here?
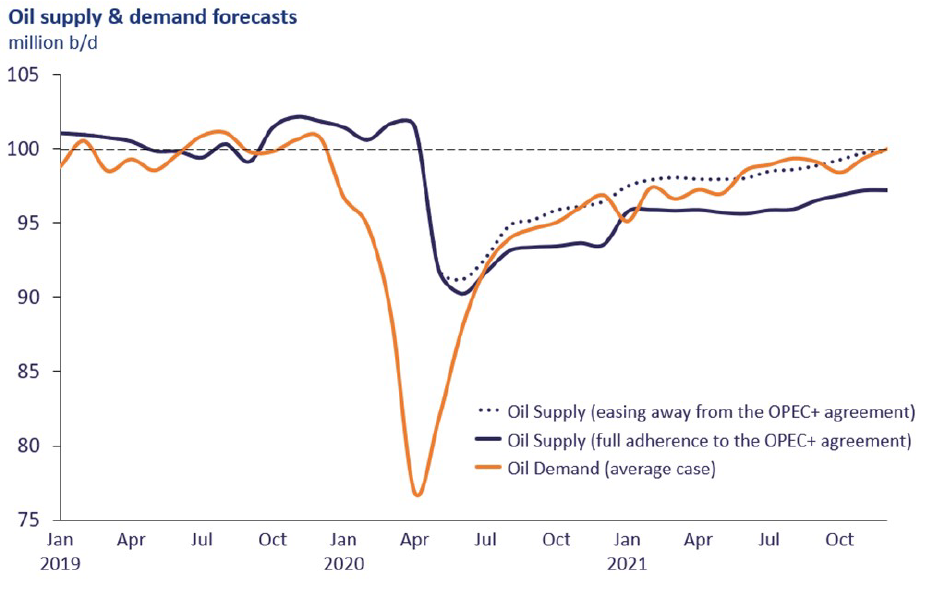
The chart below illustrates the massive supply and demand shifts we have already gone through, and also shows a fundamental case going forward. This is based on the average demand view discussed above and two supply cases, one where OPEC+ fully adhere to the current agreement and the other where ties to the agreement slip. Any slippage could be for a number of reasons, but the two main ones are likely to be either a breakdown between Russia and Saudi Arabia (which underpins the agreement), or that at some stage the oil price becomes ‘acceptable’ to the OPEC+ group and they feel comfortable easing the cuts. Looking at analysts’ current views, full adherence would appear to result in supply running considerably below demand for the rest of this year and throughout 2021. This would be highly price supportive and we could expect bunker prices on an upwards trajectory. Any slippage in the OPEC+ agreement would lower the price prospects, and in the case shown here the supply and demand outlook is relatively balanced; i.e. stocks would remain close to current levels and we would not expect a significant price rise.
OPEC has typically been a very good organisation at responding to crises, and along with other key countries the initial agreement in mid-April and the extension in early June has turned the market around.
There is the framework for this OPEC+ agreement to run through to April 2022, and IF the analysts are right on oil demand AND OPEC+ stick to the current plan, then we could see oil stocks fall rapidly from now onwards. The graph below shows how global oil stocks have increased relative to the position at January 1st 2019 (the blue line) and that we are currently close to 2 billion barrels above this level. It also shows a continual decline from now on.
It will still take until late Q4 2021 / Q1 2022 until we get back close to the 2019 stock levels, when Brent crude prices averaged $65/bbl and indications for Singapore VLSFO were around $550/ton. Nonetheless, this is a clear road to this point and could see Brent well above $50/bbl by the end of this year and around $60/bbl later next year.
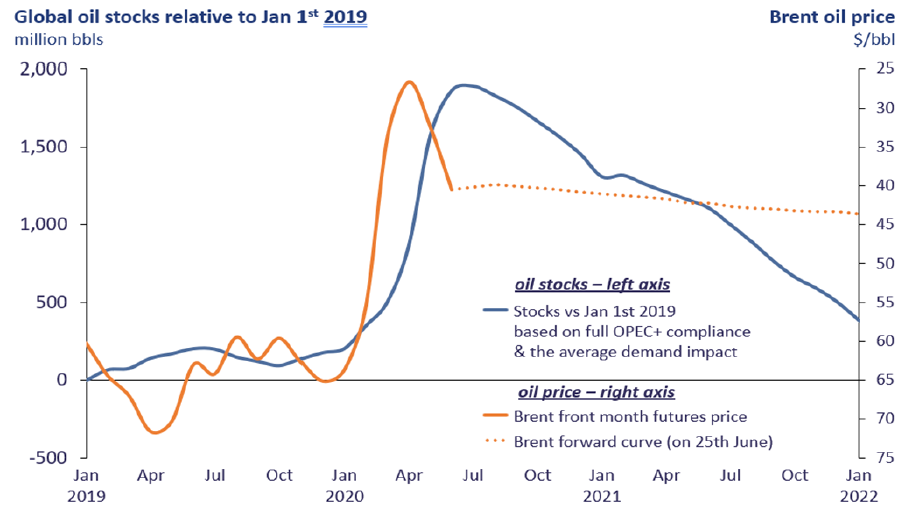
Full OPEC+ adherence does imply much stronger prices than the current crude forward curve indicates and would signal Singapore VLSFO knocking on the door of $400 at the end of this year and moving towards $500 in late 2021.
There is of course a lot of conjecture here, and this obviously depends on the key factors of how we come out of lockdowns and the state of the economy, plus what OPEC+ actually does, but we do have to keep watching these developments to see where pricing in our sector is going. This approach gives an idea on what track we are on and if, or how far we may be deviating from this $400/ton and $500/ton VLSFO price trajectory. Let’s keep tracking and we will continue to post regular updates.
Steve Christy Strategic Communications Director
P: +44 7803 201 149
E: stevechristy@navig8group.com
Posted by
Elaina Cameron
Latest articles


Contact our Experts
With 50+ traders in 12 offices around the world, our team is available 24/7 to support you in your energy procurement needs.