Bunker Buyers Haven’t Seen Prices This Good for Almost Five Years
October 22, 2025
View this article as a PDF » VLSFO prices slide to their lowest levels since early 2021 – and could go even lower. Thankfully, the short-term oil market analysis looks easier than unravelling the current challenges within the International Maritime Organisation (IMO). So, sticking to the… Read More
VLSFO prices slide to their lowest levels since early 2021 – and could go even lower.
Thankfully, the short-term oil market analysis looks easier than unravelling the current challenges within the International Maritime Organisation (IMO). So, sticking to the market analysis, we continue to look towards lower bunker prices, and are picking up from the themes of last month’s report, which were:
- September bunker prices had fallen sharply, despite crude prices remaining near flat.
- All the pointers were for crude prices to fall in Q4, which would lead to even lower VLSFO prices.
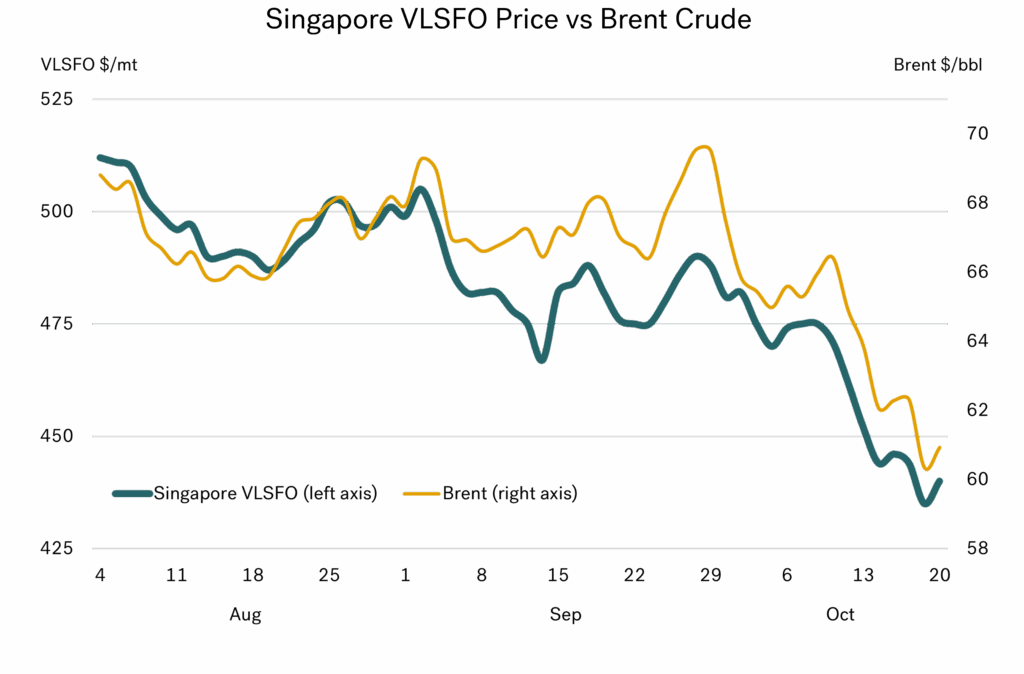
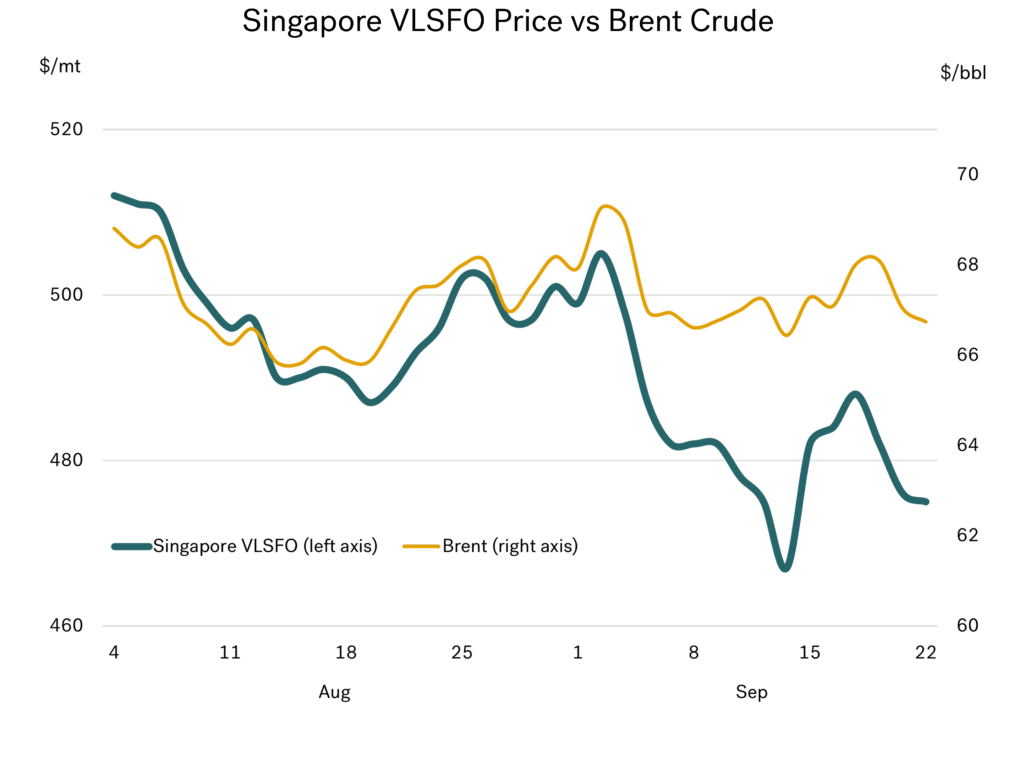
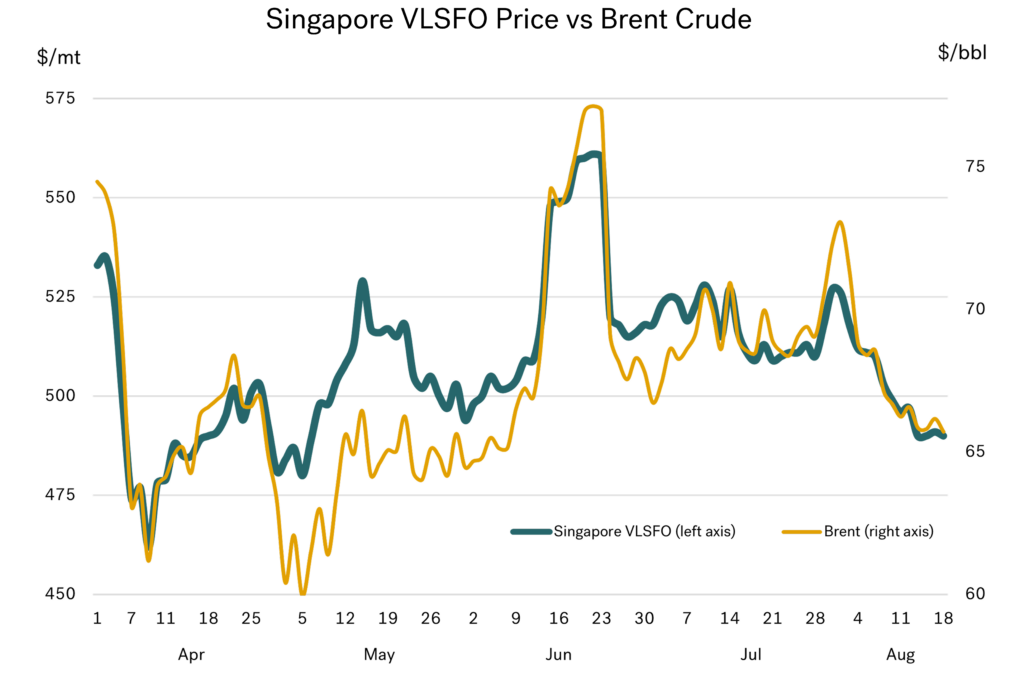
The Q4 pointers have already started to play out, with crude and VLSFO prices falling sharply over the first three weeks of October. As a result, Brent front month futures are now just above $60/bbl, compared with close to $70/bbl at end September, and Singapore VLSFO is around $440/mt, compared with a high of $490/mt towards the end of September.
The graph below illustrates these Brent and Singapore VLSFO price movements since August, and the significant drop that has taken place in October.
 Source: Integr8 Fuels
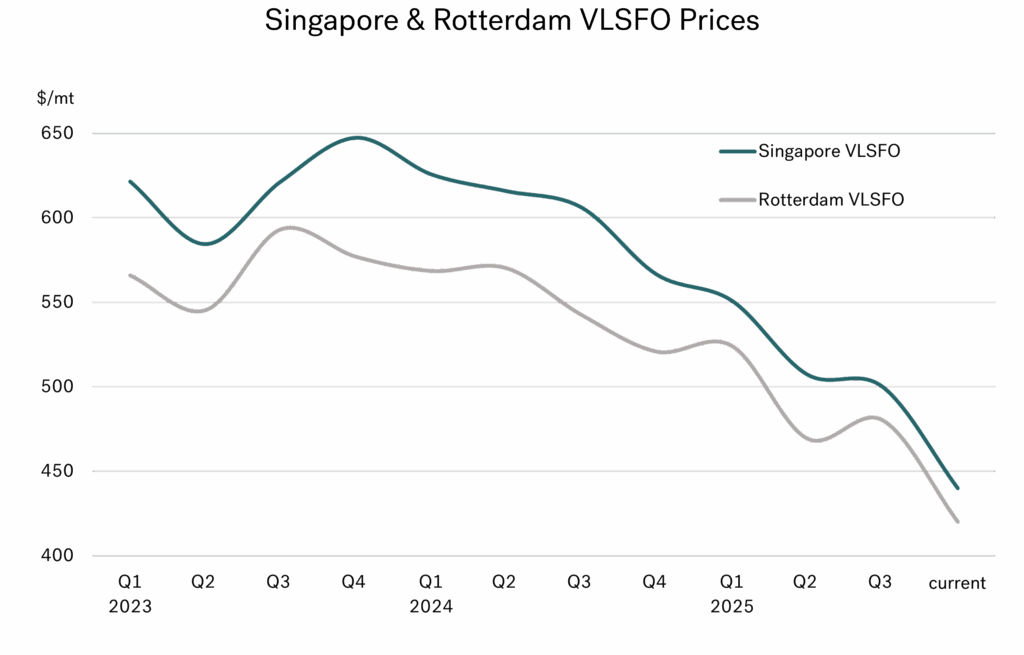
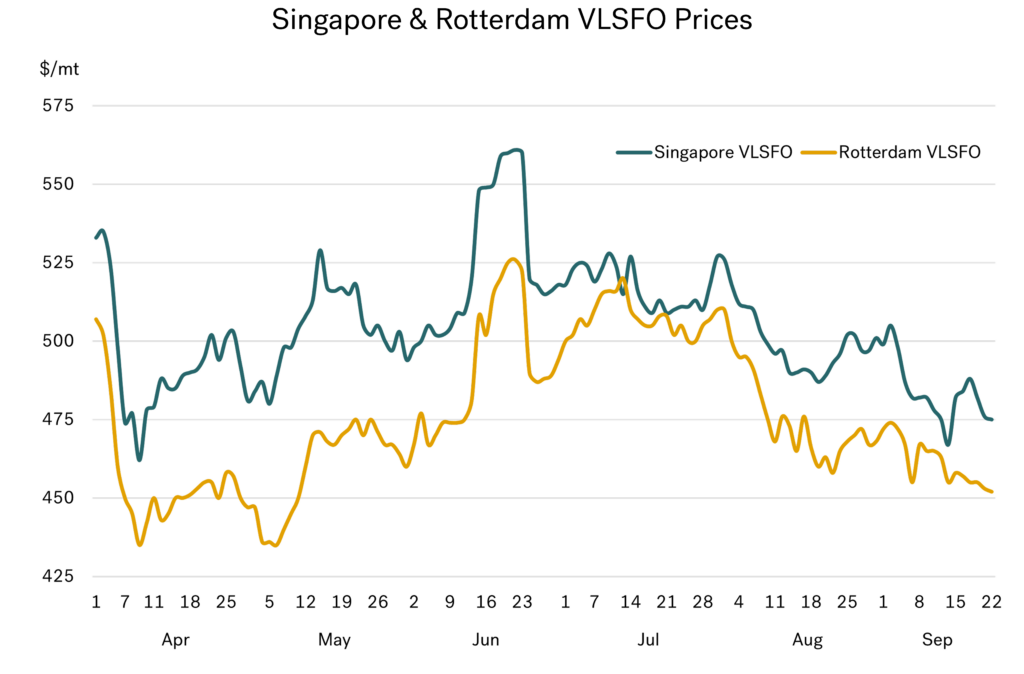
As a note, Rotterdam VLSFO prices have generally tracked Singapore prices, but been around $25-30/mt below Singapore.
Bunker buyers haven’t had it this good for almost 5 years
In a number of this year’s monthly market reports we have highlighted the weakening fundamentals in the oil sector, and that these would drive prices lower. At times this ‘fundamentals story’ has been outweighed by heightened geopolitical tensions and US trade strategies. Consequently, we have seen periods where prices have risen against what looks like a growing surplus of oil emerging.
However, the general price trend this year has been downwards, and in October the price fall has been even more extreme. We are currently in a phase where analysts and industry reports are all focusing on the growing oil surplus; the fundamentals are driving the market.
So, based on bunker buyers’ preferences for lower prices, the graph below must be a pleasing one. It illustrates quarterly average VLSFO prices and the slide that has taken place seen since the start of 2024, along with the more recent sharp decline that we have seen this month.
 Source: Integr8 Fuels
It’s a good story if you like low prices
Current VLSFO prices are around $100/mt lower than the average for Q1 this year, and some $175-200/mt lower than the quarterly highs seen in 2023. That’s a 30% drop in two years! In fact, we are at the lowest price levels for almost 5 years (since Jan 2021). Bunker buyers are in the ‘best of times’.
A repeat of the basic oil fundamentals for next year?
Without going into the detail outlined in our recent reports, the market is still looking at limited increases in oil demand next year, against substantial increases in oil supply. A general view is that the oil surplus (supply higher than demand) was running at around 1.5 million b/d over the first half of this year, but could rise to 3 million b/d over the second half of this year, and then to a massive 4.5 million b/d in the first half of 2026. Based on this, and a perceived easing in geopolitical risks, it is not surprising that most analysts are forecasting oil prices to fall even further from what are current ‘low’ levels.
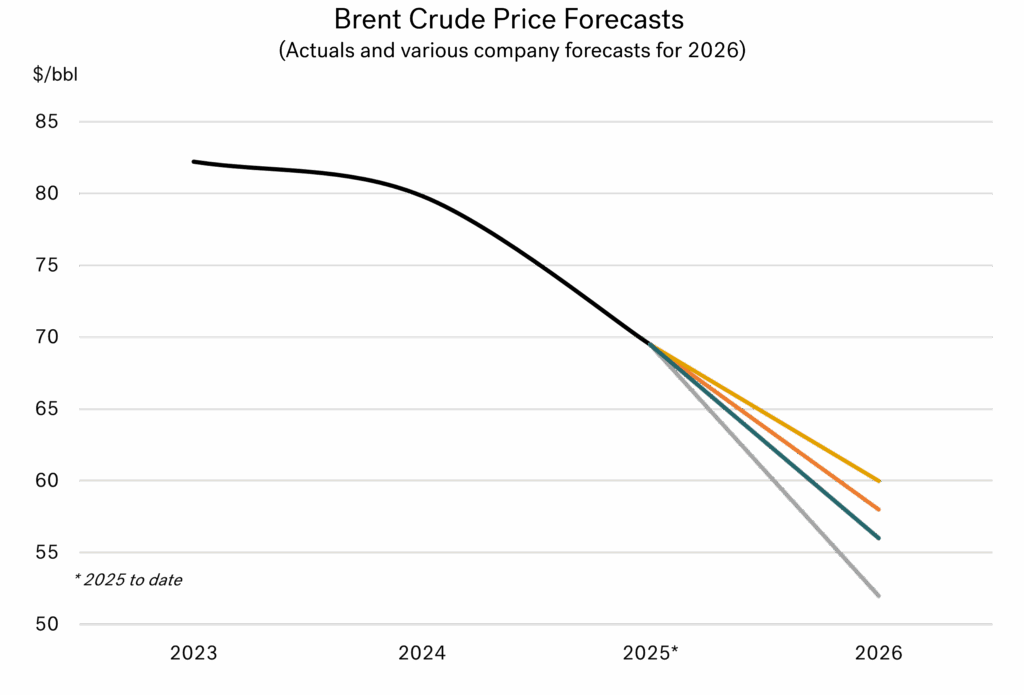
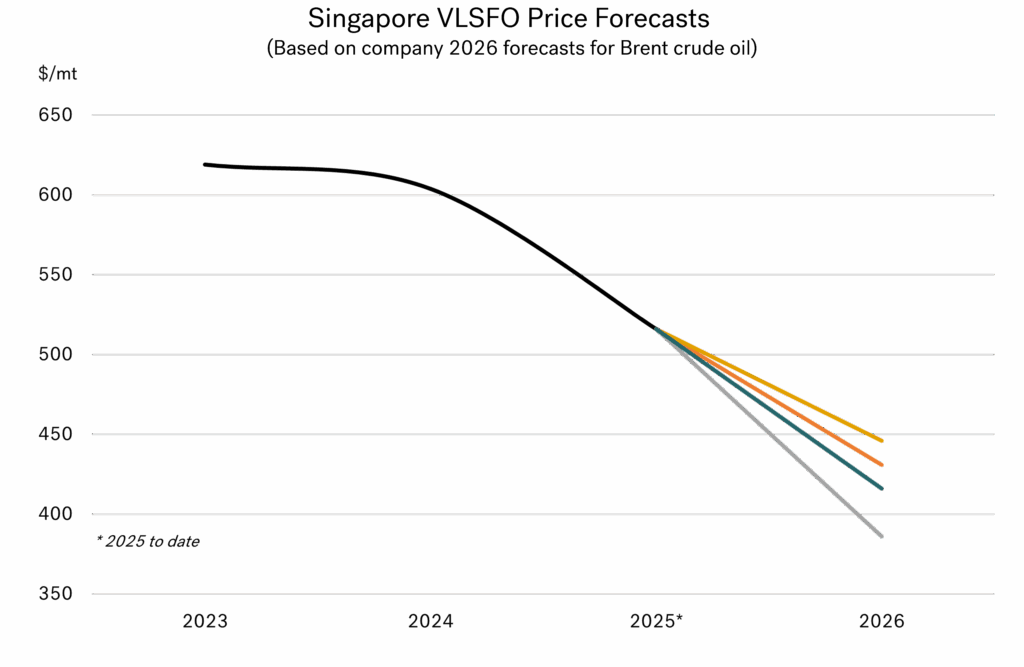
Almost all forecasters put 2026 Brent prices below current levels
The graph below illustrates annual average Brent crude prices since 2023 (when prices stabilised post-Covid), together with a selection of recent, independent forecasts for 2026. Of these forecasts, only one is equal to the current Brent price of $60/bbl, all the rest are lower than today’s price. Out of interest, the US Energy Information Administration (EIA) is at the lowest of all these, putting a $52/bbl average price for Brent next year.
 Source: Integr8 Fuels
All this means more good news for bunker buyers
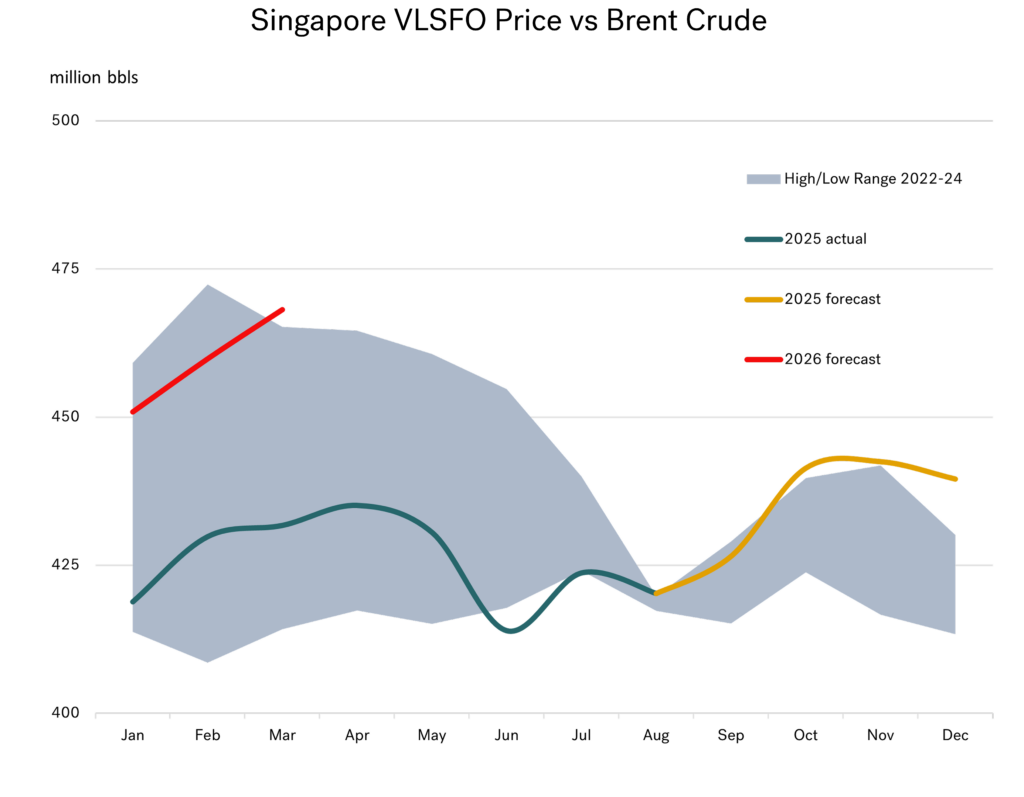
Taking all the above into account, we have extrapolated the analysis to look at Singapore VLSFO pricing for 2026. This is based on the crude price forecasts, and suggests an average Singapore VLSFO price in the range of $400-450/mt for next year.
 Source: Integr8 Fuels
On this basis, Singapore VLSFO bunker buyers will pay around $100/mt less this year than in 2023 and 2024, and a further $50-100/mt less next year than this year.
Declining prices are a rarity in any industry
There are not many markets where prices have fallen this year, and are forecast to fall again next year, but we are potentially in that position in the bunker market.
What can upset us?
As always, there is a word of warning. Many things can happen to upset a forecast, and in our case there are two obvious areas which could push prices higher. Firstly, the highly uncertain geopolitical risks, and secondly, if OPEC+ respond to what they see as ‘too low prices’ and make another round of production cutbacks. However, if there is peace in Ukraine and Russia is allowed back into the international oil market, then there will be even more downwards pressure on oil prices.
It is easy to keep an eye on all these factors, but it is still the case that we could be looking at even lower VLSFO prices next year, with Singapore in the $400-450/mt range, and Rotterdam at around $375-425/mt.
Steve Christy
Research Contributor
E: steve.christy@integr8fuels.com
VLSFO Prices Hit 5-Month Low Despite Flat Crude
September 24, 2025
View this article as a PDF » Bunker prices are down, but crude remains flat Over the past month we have seen crude prices remain flat, with Brent futures at around $67/bbl, but VLSFO prices have fallen by some $20-25/mt (and HSFO is down by… Read More
Bunker prices are down, but crude remains flat
Over the past month we have seen crude prices remain flat, with Brent futures at around $67/bbl, but VLSFO prices have fallen by some $20-25/mt (and HSFO is down by almost $10/mt).
Source: Integr8 Fuels
Crude prices have been ‘held up’ by low stock levels in OECD countries, and concerns about possible limitations on supplies from Russia, Iran, and Venezuela. At the same time, VLSFO prices have eased, with more low sulphur straight run fuel oil availabilities, especially out of Nigeria and Malaysia. Hence, throughout September VLSFO prices have fallen relative to crude.
VLSFO prices are at their lowest for 5 months
So, even without crude prices moving, we still have VLSFO prices at their lowest since early May. This is a very encouraging sign for bunker buyers, especially as the overall oil market is looking bearish.
Source: Integr8 Fuels
China has mopped up the global oil surplus – so far
Published data on oil stocks is largely centred on the OECD countries, and these stocks have been running at very low levels since May, especially for crude oil. When the weekly oil stocks data come out of the US these usually report low stock levels, and so are price supportive.
On the face of it, this OECD stocks data goes against the overarching global fundamentals, which have implied a significant stock build this year. The answer could lie with China. Although Chinese stocks data is not published, a lot of effort goes into assessing all elements of the Chinese market (imports, exports, refinery throughputs, demand and stocks), and the strong view is that Chinese oil stocks have increased significantly since the start of the year, and largely ‘mopped up’ the global surplus in supply. There are indications that stocks in China have grown by an average of 1 million b/d for more than a year.
However, we are now at a stage where any growth in Chinese oil stocks could be minimal, and we could even start to see stock draws. This means that the forecast continuing surplus of oil (supply running at much higher levels than demand) is now more likely to show up in published OECD oil stocks data.
OPEC+ pushing more crude into the market in coming months
Earlier in September, OPEC+ surprised the market by announcing a ‘round 2’ in unwinding another 1.65 million b/d of production cuts. This follows the completion of unwinding 2.2 million b/d of cuts by September (although the actual increase in output has been lower than the headline figure, with some countries already hitting maximum output).
In this second phase, the group of eight participants (including Saudi Arabia, Iraq, Kuwait, and the UAE) did not put an exact timeline on when production will be ‘reintroduced’, but the plan is to raise output by 137,000 b/d in October.
Although the actual increases may be lower than stated, the writing is on the wall for more OPEC+ crude. Beyond October, the group said it will monitor the market before any decision to raise output is taken, which appears a pragmatic approach based on analysts’ views of weakening oil fundamentals on the horizon.
Stock builds likely to switch to OECD countries; and the US publishes the most timely data
This latest move by OPEC+ only compounds the bearish fundamentals for the oil industry over the next 12 months or so, and that surplus oil has to go somewhere.
The most timely of all stocks data comes from the US, where weekly data is keenly watched by the market, and oil prices often move in response to the API (American Petroleum Institute) report out on Tuesdays, and the more detailed EIA (Energy Information Administration) report out on Wednesdays. These weekly releases will be watched closely, to see if the theory that there is no more Chinese stock building and the world’s surplus oil starts funneling its way into more visible locations (e.g. the US).
This is certainly a key feature of the analysis carried out by the US EIA. The graph on the following page illustrates their forecast of US crude stocks over the next six month, with a rapid change from current ‘low of the range’ levels, to high of the range in October, and even higher levels through the first quarter of next year.
Source: Integr8 Fuels
The US stocks data could be the barometer for a weaker oil market
If the published figures by the API and EIA do follow this forecast from around 420 towards 470 million bbls, then we are likely to see lower oil prices (and potential moves towards contango in the price structure for later in 2026). To highlight this, the latest EIA monthly price forecast for the first half of next year puts Brent crude at $49-51/bbl in each month, compared with around $67/bbl currently! Other forecasters also put Brent prices in the $50s for next year.
Products stocks may not increase by as much; but crude sets the scene!
We are now entering a period of seasonal refinery maintenance programmes, with refinery throughput expected to fall by more than 3 million b/d in October. This is at a time when OPEC+ are unwinding more crude production cutbacks, and non-OPEC+ output continues to rise. Therefore, the global oil surplus is likely to be seen more in a bulge in crude oil stocks, than in oil products.
Expectations are that product stocks could remain at relatively low levels during the northern hemisphere winter months. If the forecasts are right, this would mean that oil prices would move down sharply, but that we could see greater product premiums to crude, and so improved refinery margins. Nonetheless, such a crude stock build would see crude and product prices much lower than today. If Brent prices are in the $50s, then bunker prices will be much lower than today, even if product stocks are relatively low.
Conclusions towards further falls in bunker prices
Analysts’ projections for the rest of this year are looking at a seasonal fall off in oil demand, further increases in OPEC+ and non-OPEC+ crude oil production, and rising oil stocks. So, despite recent flat crude prices, expectations are still for a drop in oil prices as we go through the fourth quarter.
Concluding, although there has been a 4% fall in VLSFO prices over the past month, it seems that we are holding out for the further reductions in oil and bunker prices in the fourth quarter and into next year. Let’s see if the much weaker oil fundaments and a visible rise in crude oil stocks can ‘Trump’ any political and war-related bullish actions.
Steve Christy
Research Contributor
E: steve.christy@integr8fuels.com
Bunker Quality Trends Report September 2025
September 10, 2025
Integr8 Fuels’ sixth edition of the bi-annual Bunker Quality Trends report reveals key trends relating to the quality and availability of both conventional and alternative marine fuels. Read More

Integr8 Fuels’ Bunker Quality Trends Report H1 2025
Integr8 Fuels’ latest biannual Bunker Quality Trends Report explores how sanctions, new regulations, and alternative fuels are reshaping marine fuel markets in 2025.
Key findings include:
-
Sanctions: U.S. measures have reshaped global fuel flows, leading to quality issues in key hubs where Russian stock has been replaced by barrels from the Middle East.
-
Mediterranean ECA: The 0.1% sulphur cap has transformed the regional fuel mix, with VLSFO use halving and distillate demand surging. Early ULSFO quality issues are now easing.
-
Biofuels: While niche, biofuels are becoming cost-competitive under EU and ECA rules if savvy-buying strategies are followed. Risks include pour point challenges, but strategic buying can unlock regulatory and financial advantages.
Trusted by thousands of operators, owners, bunker buyers and market analysts, this report is a go-to resource for mitigating risk and improving buying performance.
A word from the author, Chris Turner, Bunker Quality & Claims Manager:
“Sanctions, new ECAs and alternative fuels are all reshaping the bunker landscape at the same time. Our latest whitepaper shows how these changes are not only affecting fuel availability and compliance but also creating new risks and opportunities in quality and cost. Shipowners need to stay on top of these shifts to avoid exposure and unlock the benefits where they exist.”


Cheaper Bunkers Ahead? Supply Surge Signals More Downside
August 21, 2025
View this article as a PDF » Falling prices in August Singapore VLSFO prices have continued to track Brent crude, and the good news for bunker buyers is that Brent prices have fallen. VLSFO prices in the main bunker centres are now at their lowest levels… Read More
Falling prices in August
Singapore VLSFO prices have continued to track Brent crude, and the good news for bunker buyers is that Brent prices have fallen. VLSFO prices in the main bunker centres are now at their lowest levels for around three months.
Source: Integr8 Fuels
The challenge is always to gauge where prices are going from here. Of course, politics, war and sentiment are going to have a huge bearing, and who knows where the ongoing discussions between President Trump and President Putin will take us. Stating the obvious, an end to the war in Ukraine (and the removal of sanctions on Russia) would see oil prices fall; an escalation in the war, or heightened tensions, or further direct and indirect sanctions on Russian oil exports could see prices rise. But even political experts will struggle to tell us which way it is going to go!
All we can do here is to take onboard the dynamics in international relations, and then separate and focus on the main drivers within the oil market.
OPEC+ unwinding production cuts is pushing prices lower
On the supply side, in April, OPEC+ members started to unwind the 2.2 million b/d of voluntary production cutbacks (these cutbacks were agreed in November 2023 and started in the first quarter of 2024). At the same time as the OPEC+ increase, UAE’s production quota is being raised by 0.3 million b/d.
The increase in OPEC+ production since April has not been linear. There are also other complications, in that some countries are unlikely to be able to raise production back to their quota levels. However, in early August, OPEC+ agreed to increase September production by 0.55 million b/d, which will fully unwind the cuts. This means Saudi Arabian output is likely to be close to 10 million b/d (versus 9 million b/d earlier in the year) and UAE production is forecast to rise as its agreed higher quota is introduced. As a result, by September/October, OPEC+ output is likely to be around 2 million b/d higher than it was in March.
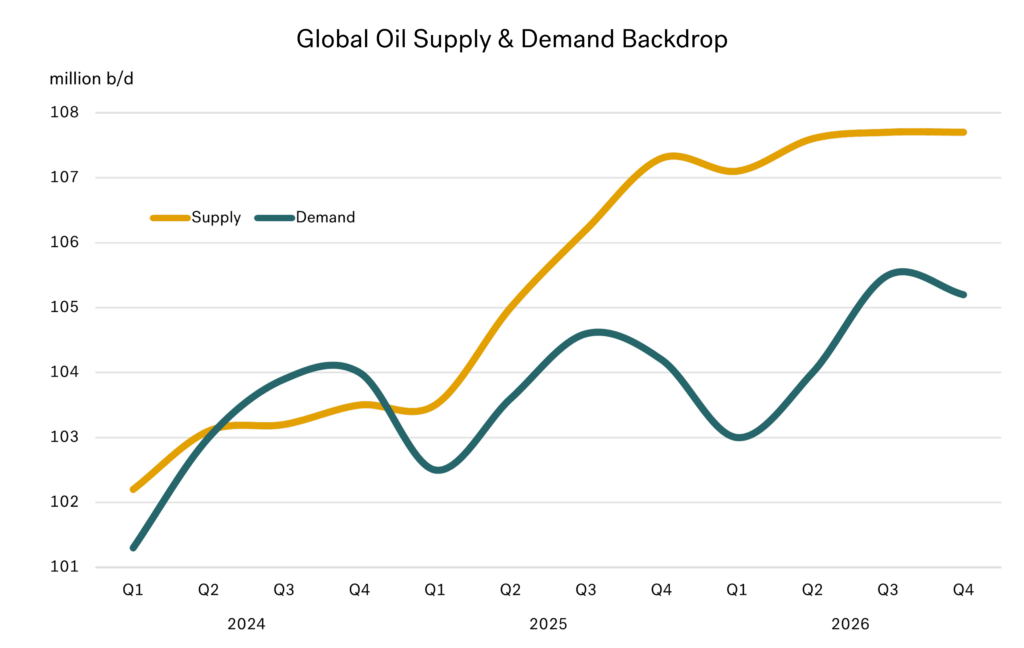
On top of this, non-OPEC+ production is forecast to rise by around 1 million b/d over the same period. Hence supply is forecast to rise very steeply this year, with the graph below illustrating the hike from 104 million b/d in Q1 to 107 million b/d in Q4.
Source: Integr8 Fuels
However, the same cannot be said for oil demand. Relatively weak underlying economies, huge economic uncertainty surrounding proposed hikes in US tariffs and the continual shift towards more electric vehicles (EVs) has undermined growth in global oil demand. There have been continual downwards revisions to forecast demand for this year and next, with the IEA currently indicating growth of 0.7 million b/d for 2025 and another 0.7 million b/d in 2026 (equivalent to 0.7%).
Global oil stocks set to rise sharply?
With OPEC+ restricting output in 2024, oil supply and demand were more-or-less in balance. But this balance is literally unwinding as OPEC+ remove their voluntary production cutbacks over the second and third quarters of this year.
We have already seen slight global stock-builds so far this year. Now we are expecting OPEC+ production to ramp up at the same time as world oil demand goes into a seasonal decline from the third to the fourth quarter. Nowadays peak oil demand is in the northern hemisphere summer months, with a seasonal fall of around 1.5 million b/d from Q3 to Q1 the next year.
The pointers are very clear on this basis; we are looking at potentially very big oil stock-builds over the remainder of this year and going into next year. This bearish view is compounded when looking at the demand fundamentals for next year. Even if OPEC+ keep to their plans and maintain their other 3.65 million b/d of cuts in place through 2026, there is still too much oil in the market!
In the case outlined here, stock builds would start to balloon to around 3 million b/d in the fourth quarter this year and then continue at 3-4 million b/d through the first half of next year.
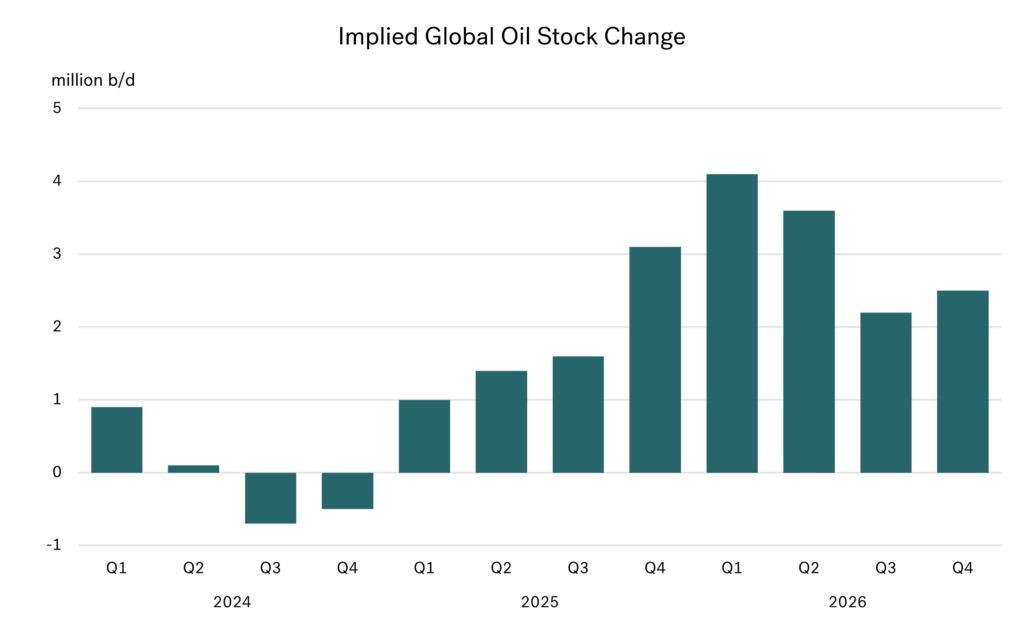
Source: Integr8 Fuels
The issue for OPEC+ is these bearish fundamentals don’t go away, with potential stock-builds going through the second half of next year as well.
War and politics will cloud the outlook and drive oil prices at certain key periods. But we can’t get away from the fact that OPEC+ unwinding their voluntary production cutbacks at this time has placed a massive bearish fundamental position on the oil market. War, Trump, Putin, and sanctions aside, it would look like bunker prices should go much lower over the rest of this year and into 2026.
Given this, what can change?
Any escalation in wars, or the threat of wider involvement will push oil prices high. As will any tightening of sanctions on Russia (or Iran). These developments would ‘cover’ the increases in OPEC+ output and likely support oil prices at higher levels.
Alternatively, any end to the war in Ukraine and ‘reinstatement’ of Russia back into the international arena will only add to the bearish fundamentals outlined here, and push prices even lower. This second option looks good for ‘world order’ and for bunker buyers!
If prices go ‘too low’ then expect an OPEC+ response
However, if prices fall to very low levels because of very weak fundamentals, or a solution to the Russia/Ukraine war, or a combination of both, then OPEC+ is likely to respond. The big players in these OPEC+ decisions are still hugely reliant on oil incomes for their economies and development programs. They are also very good, and ultimately successful, at responding to extreme price falls, with production cuts to re-balance the market. A 10% cut in oil production by these players would result in a much bigger than 10% rise in oil prices, i.e. a cut would raise their revenues.
So, perhaps we want lower prices, but not too low to provoke an OPEC+ response!
Steve Christy
Research Contributor
E: steve.christy@integr8fuels.com
Widening Spreads: VLSFO Steady While HSFO Hits Two-Year Low
July 30, 2025
View this article as a PDF » Relative strength in Singapore VLSFO has disappeared Two months ago, we wrote about how Singapore VLSFO prices had moved to a strong premium versus Brent crude. This took place in late April/early May, as crude prices fell sharply and… Read More
Relative strength in Singapore VLSFO has disappeared
Two months ago, we wrote about how Singapore VLSFO prices had moved to a strong premium versus Brent crude. This took place in late April/early May, as crude prices fell sharply and bunker prices failed to follow. At the time Singapore VLSFO was about $40/mt ‘more expensive’ than if we had continued at a parity with crude.
Around mid-June there was a spike in all prices, in response to US, Israeli and Iranian attacks in the Middle East region. Since then, there has been a significant rebalancing of VLSFO supplies in Asia, with a big leap of supplies and components arriving in the region. Arbitrage volumes coming in so far this month are some 40% higher than in June, and also running well above the average year-to-date figure. The net result is that, after a period of relative strength, the past two weeks have seen Singapore VLSFO come back into line with Brent crude; a similar position to three months ago.
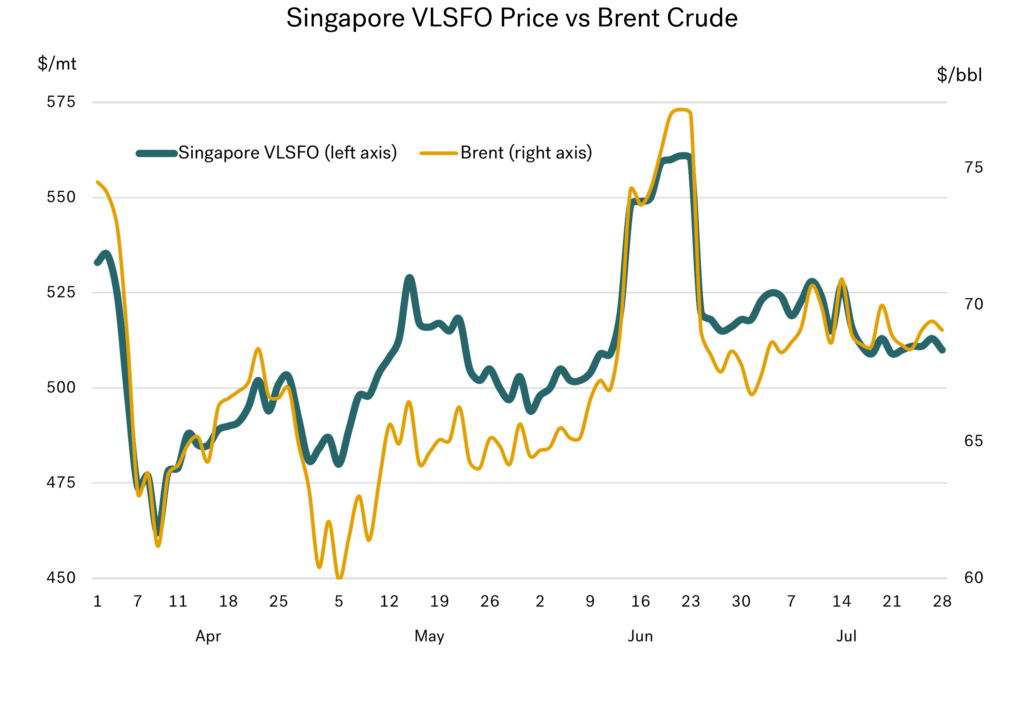 Source: Integr8 Fuels
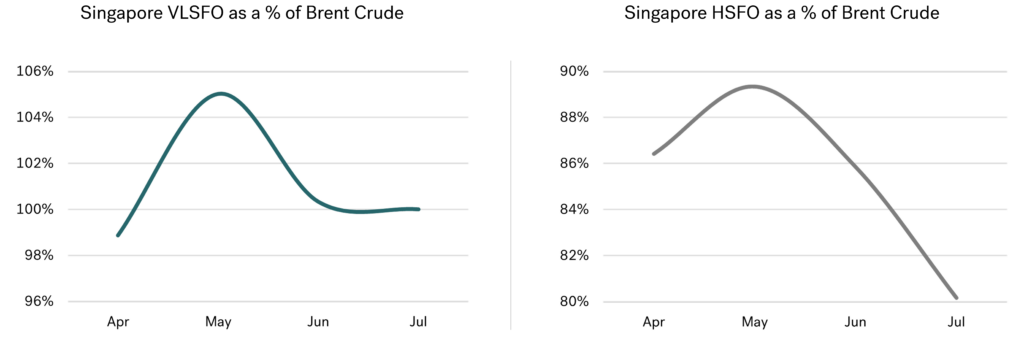
Hence, over the past four months we have seen Singapore VLSFO prices move up from around 99% to 105% of Brent crude, and now back down and stabilised at around 100%.
Singapore HSFO also strengthened April/May, but since then it’s been down and down
In April/May, Singapore HSFO prices similarly strengthened relative to Brent crude, up from around 86% to close to 90%. Like VLSFO, there was also a turning point in the Singapore HSFO market in May to June, but since then the Singapore HSFO market has just kept falling relative to Brent crude!
Source: Integr8 Fuels
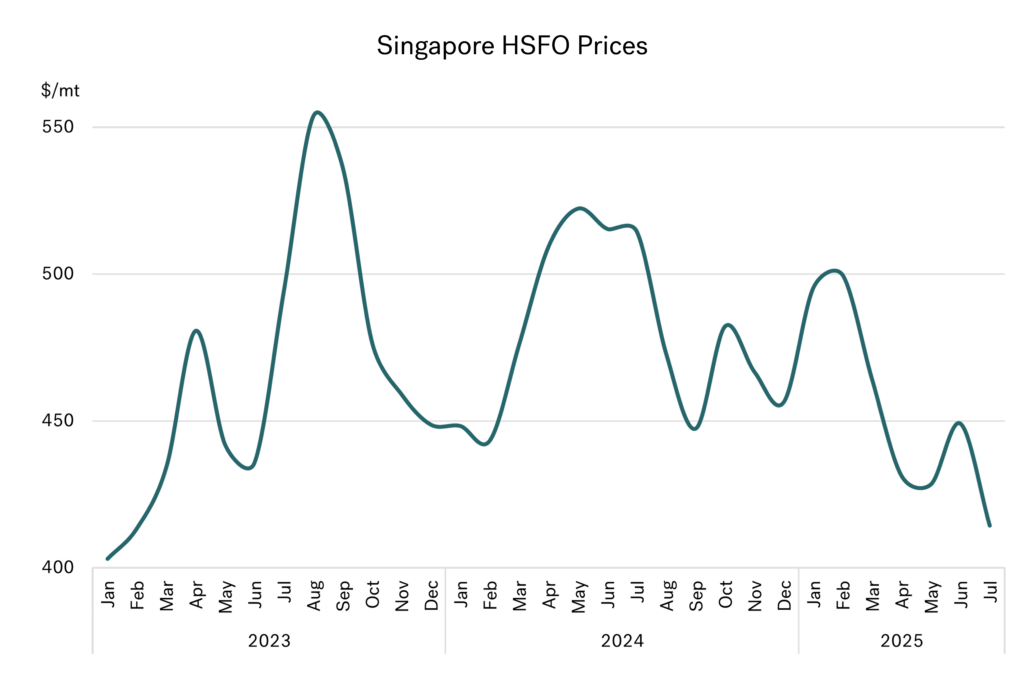
These market movements have led Singapore HSFO prices down to around $415/mt, which is the lowest level for more than two years.
The extent of the current weakness is reflected in the fact that Singapore HSFO prices have moved from backwardation into contango. The July/August contango is now at $6/mt, its most extreme for almost five years. This is not something that typically happens at this time of year when demand for HSFO in the Middle East power sector for air conditioning is usually high.
 Source: Integr8 Fuels
Why have Singapore prompt HSFO prices fallen so much?
In mid-June, the Israel/Iran conflict had raised concerns about natural gas supplies in the region, and this had bolstered HSFO prices as a replacement into power generation. However, the subsequent ceasefire then removed these worries and prices started to fall, and then fall sharply.
This unseasonably sharp drop in HSFO prices came about after stock levels had increased in June and then a significant number of cargoes came onto the market in July. There were several cargoes from at least four refiners in India that were made available, and on top of this volumes from Bahrain and Iraq were also put on the market in July. This is a rare occurrence.
At the same time, Saudi Arabia is on a strategy to burn less fuel oil in its power sector. It looks like Saudi Arabia imported around 70,000 b/d less fuel oil in June 2025 than in June 2024, and exported around 90,000 b/d more than the previous year. This alone is a net swing of 160,000 b/d in ‘available’ volumes in the HSFO market.
To compound these weaker developments, during this period OPEC+ has been unwinding its voluntary crude production cuts. As part of this, Saudi Arabia increased its June production by a massive 700,000 b/d. This is mostly heavier and more sour grades, and so will ultimately have a positive impact on the amount of HSFO coming out of the refining system.
Lower demand, higher availabilities, and more trading; a recipe for lower prices
All these developments have led to a big increase in HSFO volumes in the market and a big increase in the amount of trading taking place. Given this, it clearly explains the current weakness in Singapore and Fujairah HSFO bunker prices. As this Saudi strategy to burn less fuel oil continues, and Saudi Arabia continues to increase (heavier and more sour) crude production as the OPEC+ cuts are unwound, then we are likely to see more HSFO cargoes in the market.
Slightly lower VLSFO prices & much lower HSFO prices
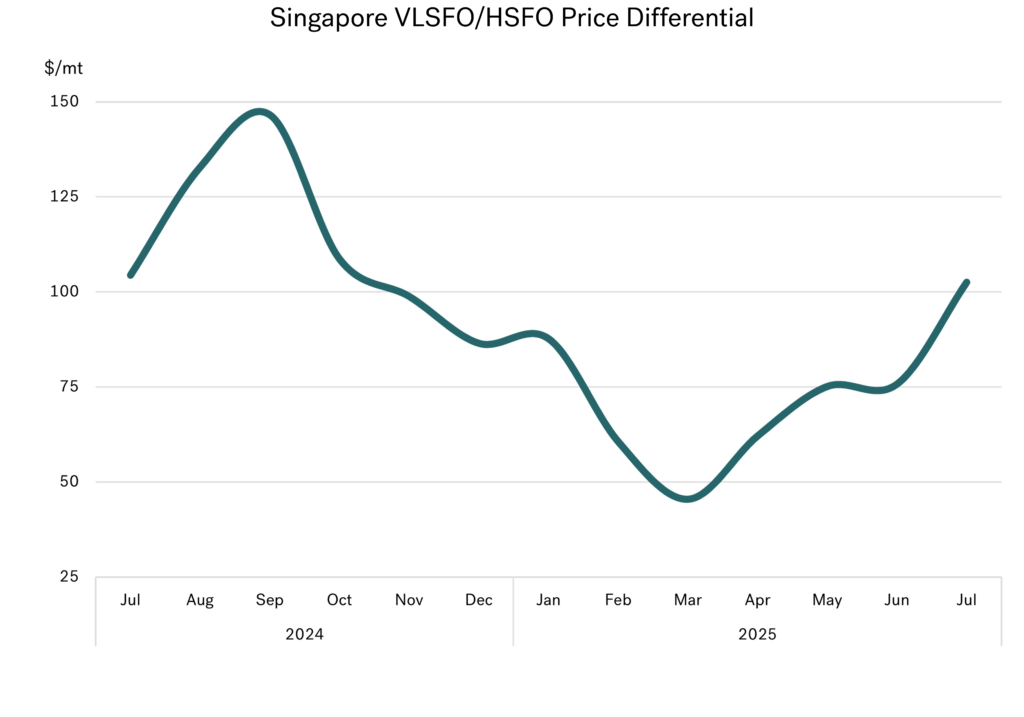
So, although Singapore VLSFO prices have moved down and back into line with Brent crude, the even bigger drop in HSFO bunker prices has led the VLSFO/HSFO differential to much wider levels. So far in July this spread has averaged more than $100/mt, it’s biggest for 8 months.
Source: Integr8 Fuels
Now to look at the future!
Looking ahead in the short to medium term, the oil supply/demand balance does look bearish, with increasing OPEC+ and non-OPEC+ production, against a backdrop of more limited increase in global oil demand. However, global conflicts and a more unpredictable political scene make this a far from a ‘done deal’ towards lower bunker prices. One subject now on everyone’s lips is Russia. The planned EU sanctions on banning imports of oil products derived from Russian crude starting in 2026 is one issue. But possible US sanctions against Russia in light of the President Trump/President Putin ‘relationship’ could be a far bigger deal.
Summing up what we all know, but what we can’t predict is: the fundamentals look bearish, the political risks look bullish and any solutions to the wars in Ukraine and Gaza could bring prices down. Not very helpful, but at least we know what we are looking at!
Steve Christy
Research Contributor
E: steve.christy@integr8fuels.com

Med ECA: Immediate Operational and Commercial Impact of Implementation
July 7, 2025
This article offers a preview of insights from our next bi-annual Bunker Quality Trends Report, coming September 2025. Sign up here to receive the full report when it’s published. View this article as a PDF » An early look… Read More
This article offers a preview of insights from our next bi-annual Bunker Quality Trends Report, coming September 2025. Sign up here to receive the full report when it’s published.
An early look at how the new sulphur limit is reshaping bunker demand, fuel availability and quality, and operational strategies across the Mediterranean.

Figure 1: Map of IMO ECAs in 2025
Source: Integr8 Fuels
Focus on the Mediterranean ECA
The Mediterranean Emission Control Area (Med ECA) came into force on 1 May 2025, requiring every ship in the Mediterranean Sea to burn fuel with no more than 0.10% m/m sulphur. Adopted under MARPOL Annex VI (MEPC.361(79)), it became the first ECA to cover an entire enclosed sea, marking a unified effort by all bordering states to curb regional shipping emissions. The rule applied immediately, with no grace period, to both international and domestic voyages, placing new demands on fuel procurement, supply infrastructure and quality assurance in ports that had not previously handled significant volumes of 0.10% fuel.
This paper’s role is to assess the immediate operational and commercial impacts of the Med ECA’s implementation, by:
- Evaluating shifts in regional fuel availability and quality statistics
- Identifying emerging non-conformance trends (e.g. total sediment potential (TSP), sulphur, water, ash) and their root causes
- Highlighting supply chain and storage practices that may exacerbate blend instability
- Offering practical guidance for buyers and ship operators on quality assurance, certificate scrutiny and risk mitigation in a post-ECA environment
Through data-driven analysis and targeted recommendations, the paper equips stakeholders to navigate the new low-sulphur landscape with greater confidence.
Availability and Fuel Mix
Fuel mix proportions have shifted markedly in the lead-up to and immediate aftermath of the ECA’s enforcement. Very Low Sulphur Fuel Oil (VLSFO) has declined from over 60% of Mediterranean supply in December to just 37.5% by May 2025. In contrast, Low Sulphur Marine Gas Oil (LSMGO) has risen steadily, making up nearly 30% of supply by May, representing proportional growth of over 120%, even if its absolute volume is still much lower than VLSFO. High Sulphur Fuel Oil (HSFO) has remained relatively stable given the continued demand from scrubber equipped tonnage across the basin.
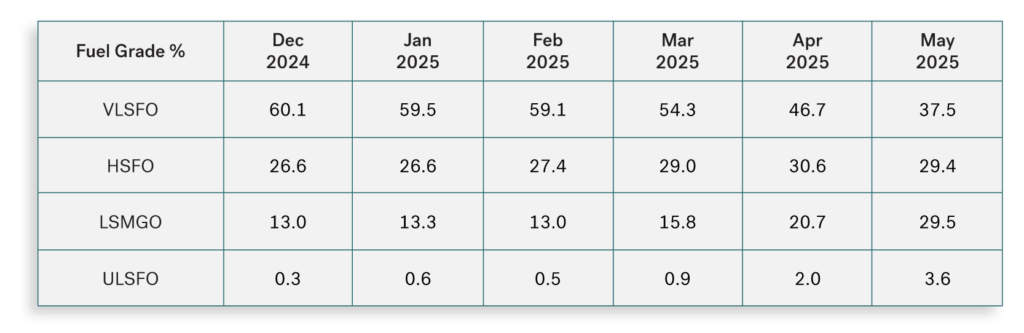
Figure 2: Fuel Supply Share by Grade % – Med ECA
Source: Integr8 Fuels
The number of ports supplying LSMGO has also steadily increased across the Mediterranean, rising from 105 in December to 131 by May 2025, an overall gain of 24% over six months. In contrast, VLSFO availability has contracted sharply, with the number of active supply ports falling from 68 to just 36, a net decline of 47% over six months. The steepest monthly decline occurred in May, at 30.8%, highlighting the pivot away from 0.50% fuels toward 0.10% compliant distillates in a post-ECA environment.
Ultra Low Sulphur Fuel Oil (ULSFO) has historically been a niche product, with supply concentrated in Algeciras and limited operational uptake. However, recent data shows its share of the Mediterranean fuel mix has climbed from 0.3% in December to 3.6% by May 2025—a twelvefold relative increase. While volumes remain modest, this shift confirms a material resurgence in ULSFO liftings within the region. The extent to which this reflects structural change or opportunistic lifting remains to be seen, but the trend is now clearly established.
Those trends, long anticipated by industry analysts, are now materialising and will inevitably reshape the Mediterranean fuel-supply landscape over time.
Impacts on Quality
With any change in legislation comes a shift in supply chains, often resulting in unintended consequences for delivered quality. The introduction of the Med ECA on 1 May 2025 marked a clear step change to 0.10% sulphur fuels across the region. HSFO aside, quality data from Q1 through the changeover shows a familiar pattern: early volatility, tightening product tolerances, and operational strain around storage, segregation, and blend consistency. In the run-up to enforcement, there were rising cases of sulphur exceedance, elevated water content, and signs of instability in both VLSFO and ULSFO deliveries—reflecting the typical bedding-in period that follows major regulatory shifts.
The following sections provide a breakdown of developments by fuel grade, covering the period December 2024 to May 2025, with a focus on risk areas, supply patterns, and buyer impact under the new ECA framework.
VLSFO
VLSFO off specification prevalence in the Mediterranean rose from 1.5% in December 2024 to 3.8% in May 2025, indicating a general deterioration in delivered quality following the implementation of the Med ECA.

Figure 3: VLSFO Off Specification % by Parameter – Med ECA
Source: Integr8 Fuels
Sulphur non-compliance has remained broadly stable in recent months, holding between 0.7% and 0.8% from March to May. This relative consistency may reflect steady HSFO demand, which has limited the need for frequent barge switching and reduced the risk of sulphur cross-contamination between grades.
Reports of elevated water reached 1.1% in May, indicating a higher frequency of non-homogeneous fuels. This may coincide with a decline in VLSFO demand, which has slowed tank turnover and led to consolidation of residual stocks across the supply chain, increasing the risk of instability at the point of delivery.
TSP infractions began to rise from February 2025 onwards, with no reported cases in either December or January. By May 2025, TSP accounted for 25% of all VLSFO notifications, highlighting the early possibility of a deteriorating trend in blend stability.
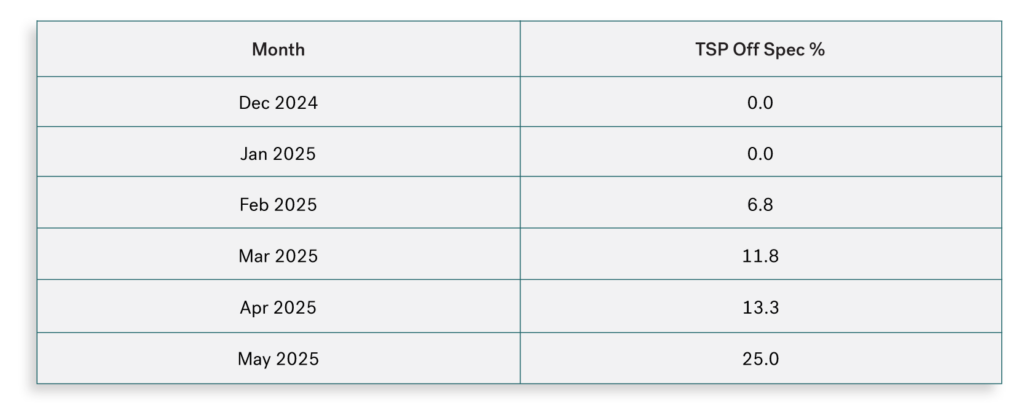 Figure 4: Total Sediment Potential Off Spec % – Med ECA
Source: Integr8 Fuels
TSP, or total sediment potential, is a measure of how likely a fuel is to form sludge due to unstable blending. When TSP levels rise, it signals that heavier components in the fuel, such as asphaltenes, are starting to separate—posing a risk of clogging filters and damaging engines.
Whether this is a temporary bump or a lasting shift remains to be seen. However, the increase may be attributed to several factors.
First, hydrodesulfurisation (HDS) in Mediterranean refineries has ramped up significantly since IMO 2020 to meet low sulphur targets. While highly effective at removing sulphur, HDS also reduces the fuel’s natural ability to keep asphaltenes suspended, making them more likely to manifest as sediment—leading to higher TSP readings and the possibility of handling issues on board the vessel.
Other quality strains were likely driven by extended in-tank storage, the consolidation of residual volumes during the VLSFO wind-down and temporary multi-grade barge operations—all of which increased the risk of instability at the point of delivery.
Although data on this trend is still limited it warrants caution, and buyers should scrutinise Certificates of Quality, particularly those issued well before lifting that show TSP values of 0.05 % Wt or higher (indicating moderate thermal instability and a risk that the fuel’s true properties may differ at delivery).
LSMGO
LSMGO off spec prevalence fluctuated between 2.8% and 3.5% from December 2024 through April 2025, before falling sharply to 1.2% in May. This recent reduction may reflect improved operational control or greater stability in post-ECA fuel streams, but further data is required to confirm whether this marks a sustained trend.
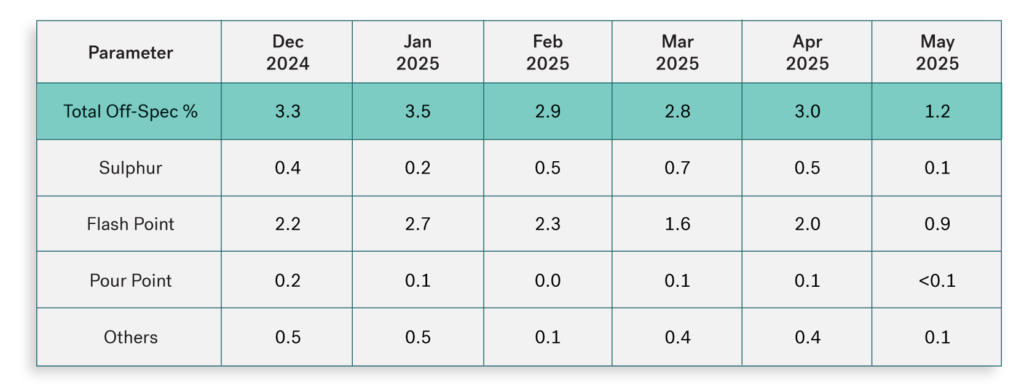
Figure 5: LSMGO Off Spec % by Parameter – Med ECA
Source: Integr8 Fuels
Flash point continues to be the dominant cause of quality non-conformance in LSMGO across the Mediterranean, responsible for more than two-thirds of all cases in most months. While sulphur, pour point, and other parameters remain largely stable, the consistently high incidence of flash point issues highlights the need for increased oversight—particularly in markets where EN590 automotive diesel may still be present in the marine distribution system. Fuels with a flash point below the SOLAS minimum of 60°C present both safety and regulatory risk and require urgent attention from buyers and operators.
These issues are not limited to minor or irregular supply points. Spain, Turkey, and Italy together account for over three-quarters of all flash point-related quality incidents across the region. Spain alone contributed nearly 30% of total recorded cases, while Turkey’s issue rate was disproportionately high relative to its supply volume. Italy followed closely, showing similar alignment between case count and fuel availability. Although France and Libya saw fewer liftings, both registered significantly higher non-conformance rates, indicating localised risk zones.
The recurrence of potential SOLAS infractions at key supply locations reflects the continued presence of low flash fuels with high kerosene content and low viscosity, often associated with inland or automotive grades. This reinforces the need to use quality data to pinpoint pools of lower flash fuels, to allow buyers to plan bunkering accordingly.
ULSFO
Test data remains limited for ULSFO, making it difficult to establish meaningful trends at this stage. However, when examining individual supply locations, more established ports such as Algeciras are performing markedly better, with a non-conformance rate of just 0.9%, compared to significantly higher rates in newer or more marginal ULSFO supply locations. This supports the recurring pattern seen throughout bunker supply history, where early implementation phases under new regulatory regimes often bring a degree of volatility and quality uncertainty.
Among the 10 reported ULSFO quality cases from January to May 2025, the breakdown is as follows: sulphur exceedance accounted for 50.0% of cases, total sediment potential for 30.0%, with the remainder split between water content (10.0%) and viscosity (10.0%). The majority of issues relate to sulphur slippage and signs of instability.
ULSFO is well known for its compatibility challenges, particularly when mixed with residual onboard product. As a result, sediment is formed which can trigger major operational difficulties on board the vessel, potentially rendering the fuel unusable. This risk makes segregation and pre-transfer checks critical to avoiding sediment-related issues in the early stages of ECA deployment.
Conclusion
The first months of the Med ECA have confirmed what many in the industry anticipated: that step changes in regulation bring operational friction.
- While supply availability has broadly kept pace with demand, the quality picture is more uneven.
- VLSFO has shown early signs of instability as tank turnover slows and residual inventories are cleared.
- LSMGO remains widely available but continues to carry flash point exposure in several key markets, raising the risk of potential SOLAS non-conformities.
- ULSFO volumes are rising but remain operationally complex, with sulphur and sediment issues emerging in early data.
These developments follow a familiar pattern seen in past regulatory transitions: early volatility, reduced product tolerance, and greater exposure at the point of delivery.
Buyers operating under the new ECA regime will need to remain vigilant—not only in terms of compliance, but in ensuring that the fuels they lift are operationally sound, physically segregated, and backed by robust documentation. The Med ECA may be a regional regulation, but the shift it has triggered will continue to influence sourcing practices, operational safeguards, and quality risk management across the broader marine fuel supply chain.
Chris Turner
Manager, Bunker Quality & Claims
chris.t@integr8fuels.com
From Growth to Decline: The IEA’s 2030 Outlook and What It Means for Bunker Markets
June 26, 2025
View this article as a PDF » The ‘Oil World’ will start to decline within the next 5 years With oil prices in turmoil, moving much higher because of US, Israeli and Iranian attacks, and then much lower on what looks like a fragile ceasefire, it… Read More
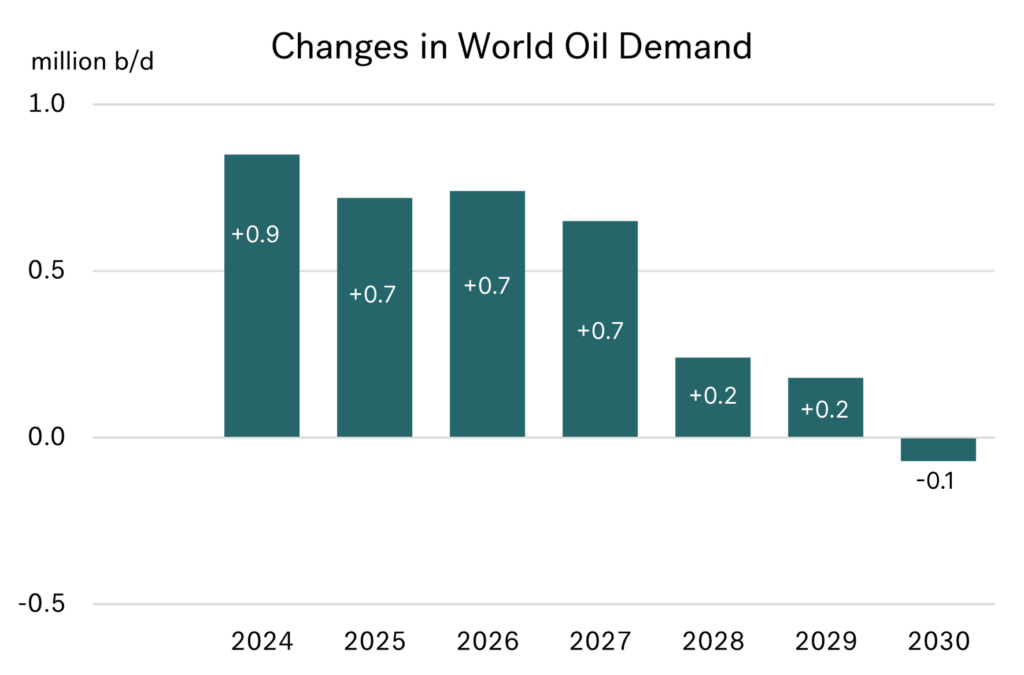
The ‘Oil World’ will start to decline within the next 5 years
With oil prices in turmoil, moving much higher because of US, Israeli and Iranian attacks, and then much lower on what looks like a fragile ceasefire, it is perhaps a good time to take a ‘bigger picture’ look at the direction of the oil industry over the next 5 years. The IEA has just published its oil market outlook to 2030, and there is a lot within this analysis that will shape the bunker market over the rest of this decade.
Importantly, we are moving from an industry that has been growing, to one that will soon be in decline. In the IEA outlook, world oil demand is forecast to show only modest gains over the next 2 years, with minimal gains in 2028/29 and then go into decline in 2030.
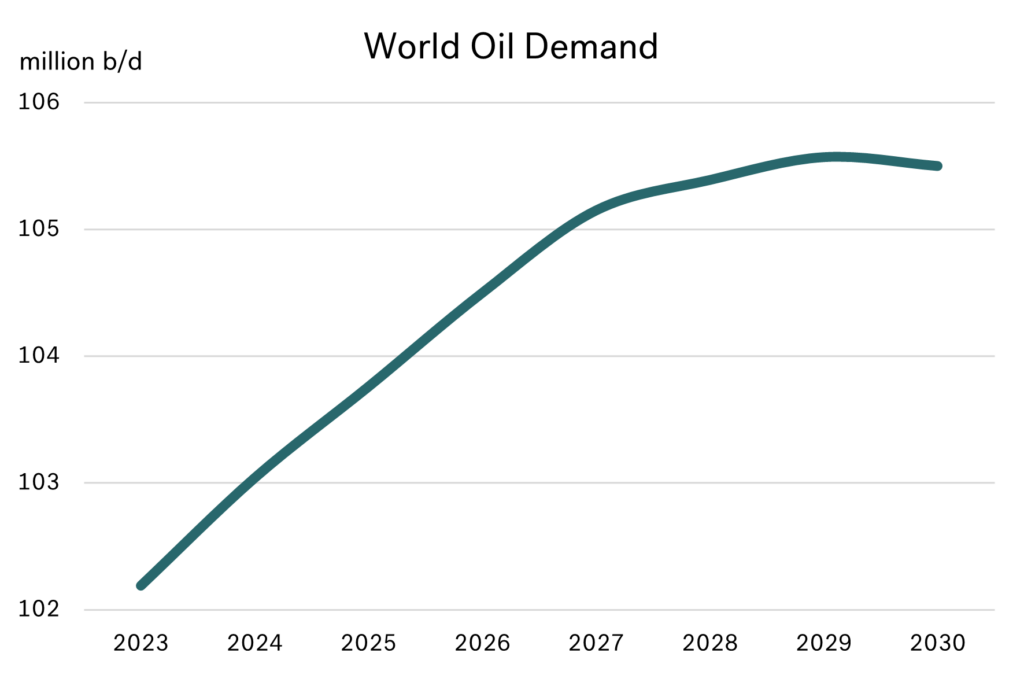 Source: Integr8 Fuels
 Source: Integr8 Fuels
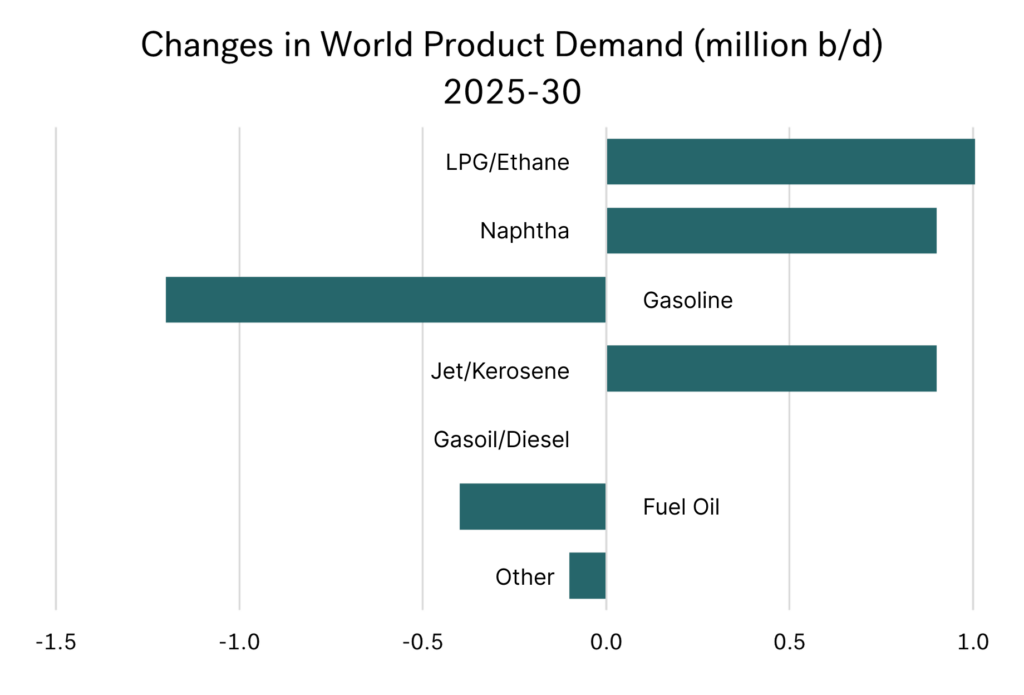
Petrochemicals and aviation is where the growth is
Looking at the key aspects of the oil products markets over the next 5 years, there are a few high-profile developments taking place. Firstly, there is significant growth in the petrochemical sector, and this will drive higher demand for LPG, ethane, and naphtha.
Secondly, there is also growth in jet demand. This follows the continued increases air travel and transport, and that jet fuel still essentially can only come from an oil refinery.
 Source: Integr8 Fuels
Bunker demand is expected to remain flat
Within their analysis, the IEA expects demand for bunkers to remain stable at around 5 million b/d over the outlook period. Their basis is that a 2% p.a. growth in tonne-kilometres demand will be offset by efficiency gains in the shipping industry and IMO regulations supporting some switching to lower emissions fuels, such as biofuels and ammonia.
Oil demand is falling as EVs are increasing
Gasoline and diesel have accounted for around 40% of total world oil demand. The main reason for oil demand starting to decline at the end of the decade is the expansion of electric vehicles (EVs) and the accompanying loss of gasoline and diesel demand in the transport sector.
For us in bunkers, it is the gasoil/diesel and fuel oil sectors that will be most influential.
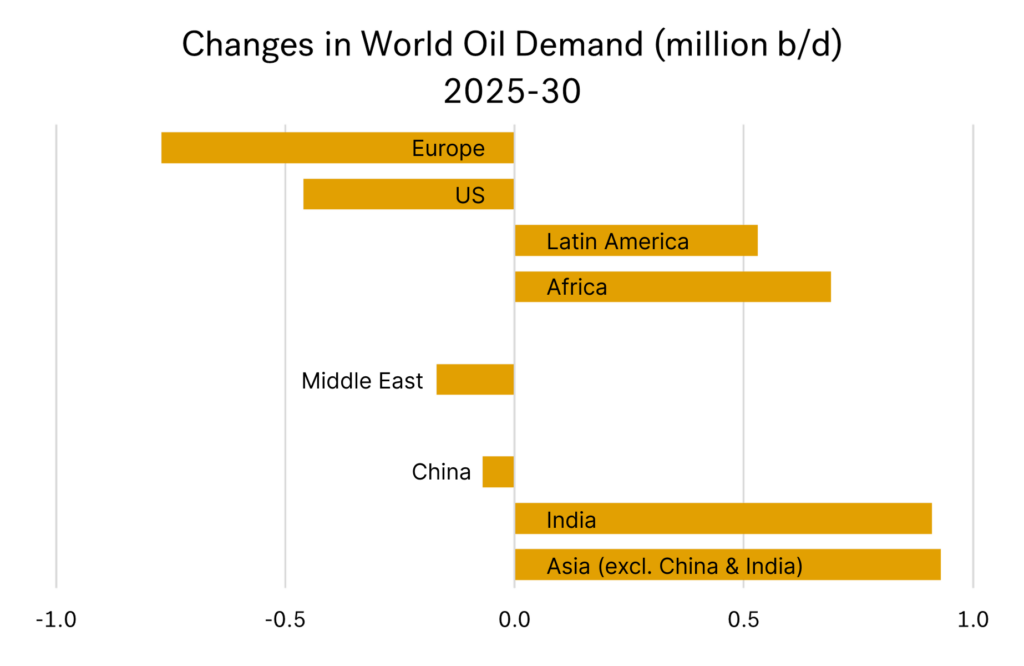
Substantial changes in the outlook for US & China
- Two major changes from last year’s IEA report are that:
US oil demand is still forecast to fall, but at a much slower pace (which is not surprising under President Trump’s policies). - Oil demand in China will fall much earlier than previously anticipated.
China is now the world leader in EVs in terms of manufacturing and sales. This, along with massive investments in the high-speed rail network and structural shifts in the economy, mean the IEA is now expecting China’s oil demand to start falling within the next 4 years! This is a radical change, with China being the powerhouse behind increases in world oil demand in recent years.
In contrast, before President Trump was elected, the forecast was for US oil demand to fall by 1.5 million b/d between 2025 and 2030. Now, with Trump in power, the IEA has ‘downgraded’ this forecast decline to just 0.45 million b/d
Europe shows the biggest drop in oil demand
The agency has kept its previous expectation for a 0.8 million b/d drop in European oil demand between now and 2030. This means Europe is now at the forefront of changes in oil demand over the next 5 years.
There are no planned refinery closures in Europe after this year, but lower demand in the region will lead to lower refinery throughputs and product availabilities. It is how product balances unfold between cuts in refinery output versus the drop in oil demand; this will impact trade, pricing and how bunker markets are supplied in the region.
Limited changes in the US; but no market can stand alone
The situation in the US may be more balanced given the slower pace at which oil is removed from the energy mix. But we know how markets are ‘interwoven’, and no international bunker market is immune to what is happening elsewhere in the world.
Source: Integr8 Fuels
Latin America & African demand continues to rise
It is by coincidence that forecast declines in demand in Europe and the US are exactly matched by increases in oil demand in the growing economies of Latin America and Africa. This means that oil demand in the Atlantic Basin is expected to be close to current levels in 5 years time. However, with very few new refinery projects in the growth regions, it does stress the need for additional trade volumes to move between areas to achieve regional balances across different product groups. We in bunkers will be affected by these additional trade flows and price implications.
The Middle East not as it seems; its rising
On the face of it, there is a slight decline in Middle East oil demand over the next 5 years. However, once you dig into this, Saudi Arabia’s strategy to stop burning domestic oil for power generation and desalination plants* more than explains the cut. If this is taken out of the equation, Middle East product demand is forecast to increase by around 0.4-0.5 million b/d by 2030.
* part of this is a reduction is in fuel oil use, which could push more of this into the international market.
Nonetheless, the Middle East is one of the key areas where new refining capacity, upgrading and desulphurisation is taking place. Therefore, long haul product exports from the region are likely to continue to increase. This will cover some of the imbalances elsewhere in the world, but will also have price implications.
Asia & China could see the biggest changes for us
Finally, some of the biggest issues hitting the oil and bunker markets are likely to be seen in Asia As outlined, oil demand in China is expected to start falling by the end of the decade. But this is in contrast to what is happening in India and other Asian countries, where a combined growth of almost 2 million b/d is seen between now and 2030.
This is where trade flows, pricing and market influence could be interesting. Despite no growth in Chinese oil demand, there are still a number of refinery capacity additions in the pipeline. There are of course a number of scenarios surrounding these dynamics, but one obvious one is that China becomes an even bigger products exporter over the next 5 years. Again, this will have implications for all the major products, including what happens to us in bunkers.
This report poses more questions than answers
Clearly these are prominent issues for us in the bunker market. Longer term planners in our business will be assessing the potential surpluses and shortfalls by region for VLSFO, blending components and HSFO based on these demand and refining forecasts. It will be interesting to see how trade flows, bunker pricing and China influence our business over the next 5 years.
Steve Christy
Research Contributor
E: steve.christy@integr8fuels.com
Why Bunker Prices Aren’t Dropping — Even as Oil Sinks Below $65
May 29, 2025
View this article as a PDF » Brent prices even lower than a month ago Brent prices are some $4/bbl lower than their peak at end April, and in the interim we have seen another dive back down towards $60/bbl. Its like the crude price chart… Read More
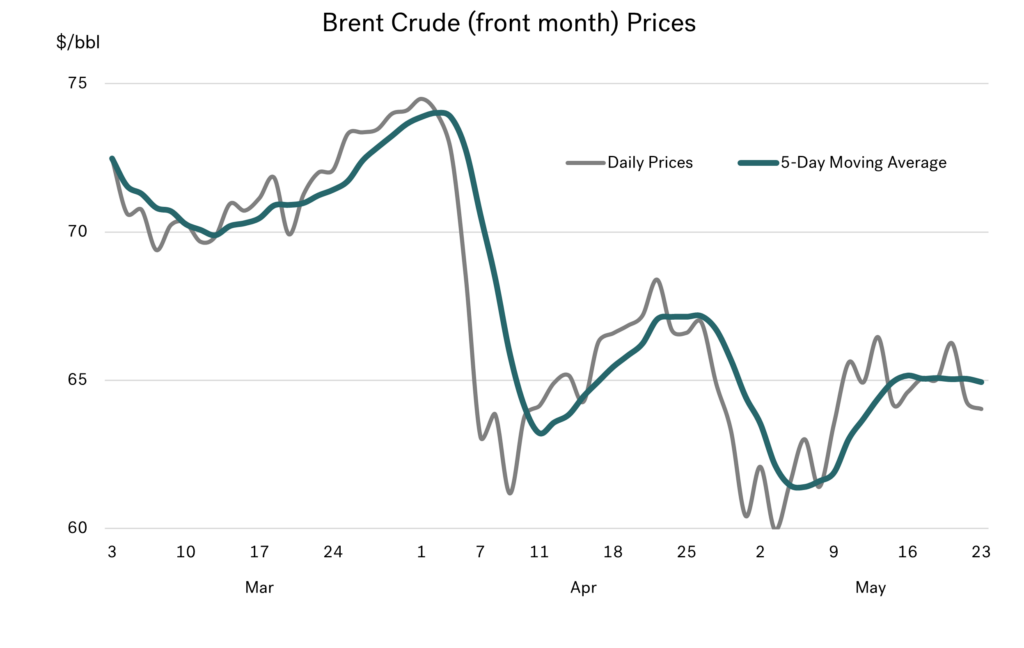
Brent prices even lower than a month ago
Brent prices are some $4/bbl lower than their peak at end April, and in the interim we have seen another dive back down towards $60/bbl. Its like the crude price chart reflects a ‘friendship rating’ between the US and China, with Brent $15/bbl lower than when Trump came to power. Instead of prices around $80/bbl at the start of the year, we are now generally trading in the $60-65/bbl range, and have been for almost two months.
 Source: Integr8 Fuels
We speculated last month that if President Trump and President Xi became ‘good friends’ it would trigger a return to confidence in global markets and higher oil and bunker prices. This clearly is not happening at the moment!
Much bigger increases in OPEC+ than previously planned
Brent crude prices have moved off their $60 lows, to around $65/bbl. Although there has been another delay in imposing the full US tariffs on China, the pickup in price is more a reflection of the latest round of tighter EU sanctions on Russia.
However, the good news for bunker buyers is that any rise in oil prices is being limited by OPEC+, as they start to unwind their voluntary production cutbacks. The process started in April, and the increases are much bigger than previously planned, rising by around 0.4 million b/d in April and another 0.4 million b/d anticipated in May (as opposed to an earlier planned rise of only some 0.15 million b/d each month).
So, although more EU sanctions on Russia is a bullish element to the market, this has been overshadowed by no political solution to the proposed US tariffs on China, and much bigger than expected increases in OPEC+ production. Hence, Brent is even lower than a month ago, and trading in the $60-65/bbl range.
But in bunkers, we are still not seeing the full effect of lower crude prices
In last month’s report we highlighted the fact that the fall VLSFO prices was nowhere near as big as the fall in crude. If we had seen the same drop in bunkers as we saw in crude, then VLSFO in Singapore would have been another $25/mt lower in April.
This trend has not only continued into May, but has actually got even worse for us. Instead of using the crude headline of “even lower prices”, we must use “VLSFO prices are slightly higher than a month ago”. In fact, Singapore VLSFO prices have been above $500/mt for most of May, and higher than all but the first few days of April; something that can’t be said for the crude market. The graph below illustrates this recent divergence in prices between Brent and Singapore VLSFO, with both axes scaled the same.
 Source: Integr8 Fuels
Whereas last month we said that Singapore VLSFO would have been $25/mt lower if it had tracked crude; now we are saying Singapore VLSFO would be $50/mt lower if it had tracked crude!
There is relative strength in product prices
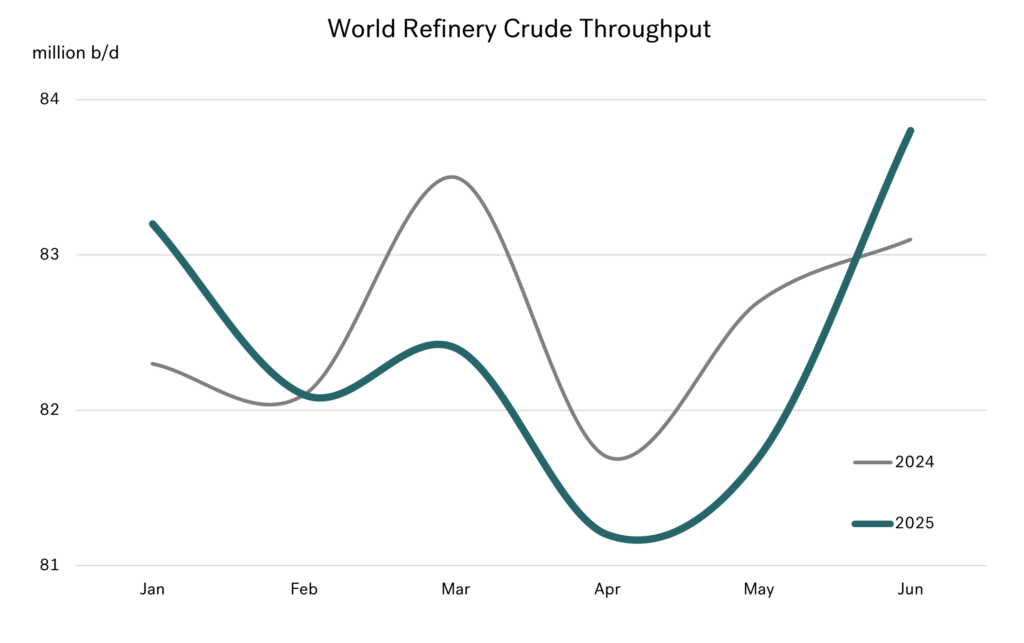
Planned refinery maintenance, plus some unplanned shutdowns, have hit refinery crude throughputs over April/May extremely hard. As a result, global throughputs are much lower than in the same period last year, and also lower than in April/May 2023.
Source: Integr8 Fuels
There is no adjustment to crude production during these periods of much lower crude processing. This year the situation is even more extreme, with a bigger drop in throughputs taking place at the same time as significant increases in OPEC+ production. Naturally, this has led to a relative weakness in crude prices.
The bottom line is lower crude throughputs mean tighter product availabilities and more ‘spare’ crude. Hence, we have seen crack spreads widen over April/May across most products and in most regions. For us, VLSFO crack spreads in Singapore and NW Europe both rose by some $6/bbl, which is equivalent to around $40/mt.
It’s therefore not surprising that recent VLSFO prices have not tracked crude prices to their lows.
When will VLSFO pricing fall back in line with crude?
There are early signs that things are changing. After a cutback in trade in April and May, the arb on light/sweet West African crudes moving to Asia is opening up, and cargoes are likely to load and go east, but this is for the June loading program. There are also expectations of more VLSFO arrivals into Singapore, but again not until later in June and July.
This ties in with the expectations of a strong rebound in refinery throughputs in June, to levels higher than last year, resulting in increasing product availabilities coming later in June and into July.
It’s a fix, but not a quick fix, with these pointers suggesting we still have a number of weeks where VLSFO will remain at a relative strength to crude, but this should start to ease back later June and into July.
The question then is: What are the pointers for VLSFO prices?
Bullish signs on oil prices could be if there is a quick end to the war in Ukraine, which isn’t looking likely at the moment. An even bigger bullish factor would be signs that President Xi and President Trump have become ‘good friends’ and end the planned use of high tariffs; again, not seen as a high probability in the very near term.
In the immediate short term, there are more bearish signals for VLSFO prices.
If the crude market is unchanged by the end of June, with Brent trading in the $60-65/bbl range, then we would expect Singapore VLSFO prices to fall from just above $500/mt, to the $450-475/mt level. If crude oil prices fall from current levels, to below $60/bbl, the fall in VLSFO prices will be even greater.
If crude prices remain the same, this means lower bunker prices; if crude prices fall this means even lower bunker prices!
Steve Christy
Research Contributor
E: steve.christy@integr8fuels.com
Tariffs, Tensions, and Tumbling Oil: The Market Reacts
April 24, 2025
View this article as a PDF » Another big drop in crude oil prices In these monthly reports we take a ‘bigger picture’ look at oil industry developments. We try to vary the aspects we focus on, but in recent months the only subject to talk… Read More
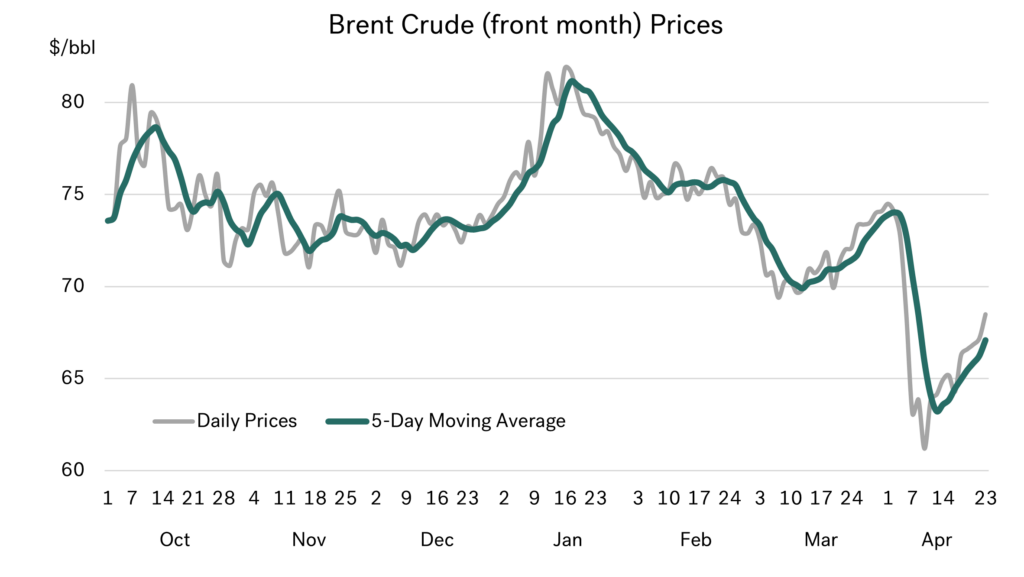
Another big drop in crude oil prices
In these monthly reports we take a ‘bigger picture’ look at oil industry developments. We try to vary the aspects we focus on, but in recent months the only subject to talk about is price. In our end March report, we said that oil prices were likely to continue falling, but I am not sure we anticipated a drop of more than $13/bbl (18%) in front month Brent over just 9 days at the start of this month!
 Source: Integr8 Fuels
New US trade tariffs announced in early April, with reprisals from China and even greater fears of recession, all led prices down. If this wasn’t enough, some OPEC+ members also decided to start unwinding voluntary production cuts in April/May. The consequence was for Brent to fall to a 4-year low (back to COVID-19 times), and at one point drop below $59/bbl.
As it is under the Trump regime, there were further announcements and some delays/backtracking, and prices have moved back up off their lows. But prices are still low by recent standards. Everyone is acutely aware of the uncertainty surrounding President Trump’s announcements on tariffs, China’s responses, and high-profile institutions such as the International Monetary Fund (IMF) revising down their economic forecasts.
Of course, bunker prices have fallen
Given all these factors, it has been impossible to put a bullish slant on the market and of course bunker prices have also fallen. Across the main international markets, VLSFO prices dropped by around $70/mt (14%) in the first 9 days of April. There has been a rebound since then, but we are still $40/mt lower than at the start of the month.
Source: Integr8 Fuels
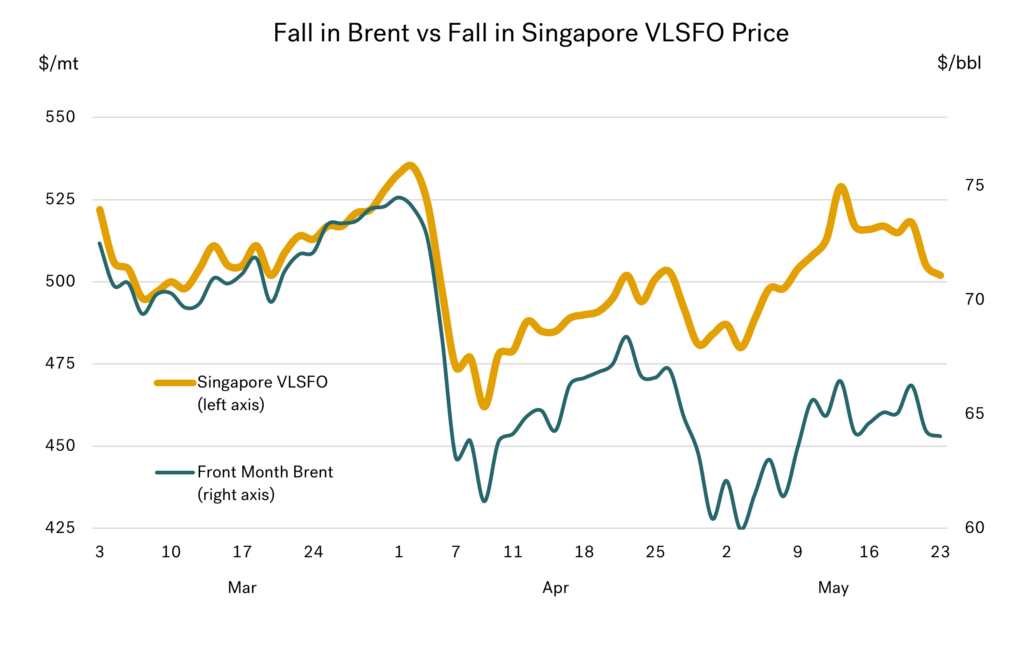
But bunker buyers have not benefitted as much as they might have
There are always nuances across crude and product prices, and in the VLSFO market the price drop has not been as big as for crude. The graph on the following page illustrates a disparity in the price drop between Singapore VLSFO and Brent crude – both axes are scaled the same, showing the bigger drop in crude. If all things were equal (they never are!), we would have seen Singapore VLSFO at lows of around $430/mt, and even now at prices close to $475/mt.
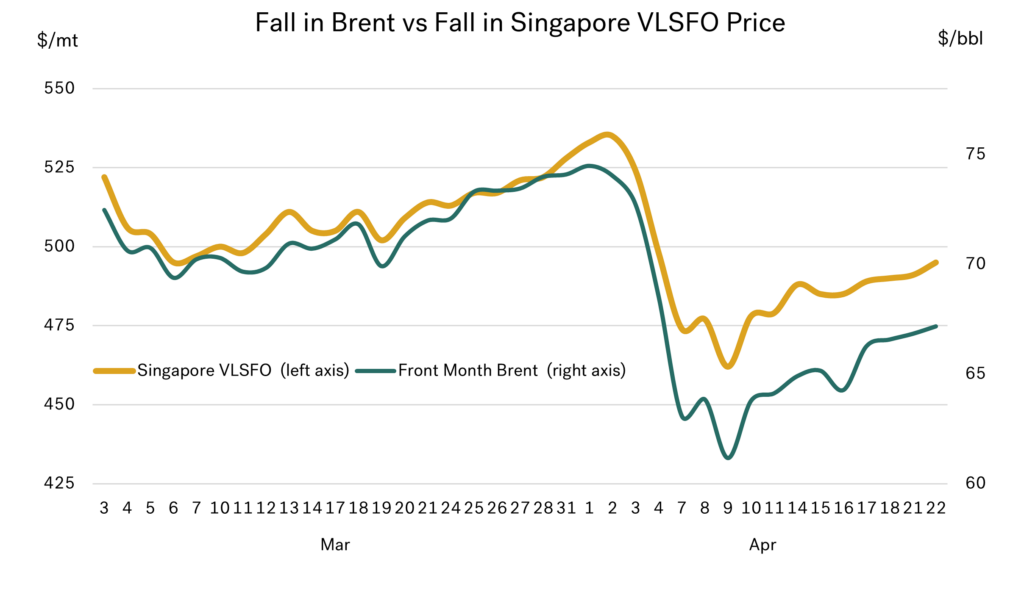 Source: Integr8 Fuels
VLSFO prices in Asia are strengthening relative to crude. This is based on lower volumes of low sulphur material moving from west to east, potentially tightening supplies once again. The market pointers are also there, with increased backwardation and rising crack spreads. Speculation of increased bunker demand ahead of the 90-delay in US tariffs being implemented (except for China) has added another positive talking point. However, these are all nuances to VLSFO prices; the big story still surrounds tariffs and what President Trump does next.
Analysts are revising down everything
In the current market it is very difficult for us to write about anything other than Trump and oil/bunker prices. The precarious nature of political decisions, and the threats of recession mean the market is focusing on bearish sentiments and low oil prices. Oil industry forecasters have already revised down their outlook for oil demand for this year and next. In mid-April, the IEA lowered its forecast for oil demand in 2025 by 0.3 million b/d, whilst the US EIA reduced its 2025 forecast by 0.4 million b/d.
In the same context, oil price forecasts are also being revised down. The EIA has just lowered its 2025 and 2026 Brent price forecasts by $6-7/bbl, to average $68 this year and $61 next year. Morgan Stanley has reduced its 2025 Brent price by $5/bbl (to $62.50/bbl), and Goldman Sachs are down by $2/bbl (to $63/bbl). The general trend (at the moment) is for even lower prices next year, with Goldman Sachs at the low end of the range, at $55/bbl.
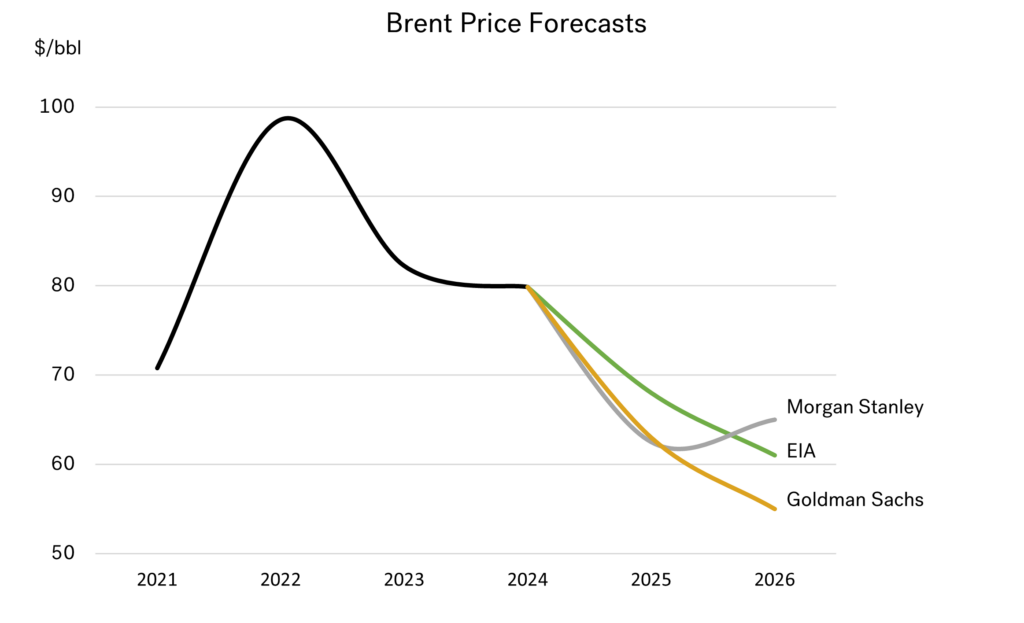 Source: Integr8 Fuels
To re-enforce the bearish sentiment, these projections were made before publication of the IMF’s latest economic report, which came out this week. The IMF forecasts are downbeat, and it is no surprise that the biggest revision was to the US, where GDP growth for 2025 has been downgraded to 1.8%, from 2.7% projected in their January report. Downward revisions for other major economies have been set at around 0.4-0.5%. If based on this, it could be that the next round of oil demand forecasts are even lower.
We are only talking about one thing; Trump’s actions
US tariffs and international responses, particularly from China, are now at the forefront of everyone’s mind. There are still the wars in Ukraine and Gaza, and issues surrounding sanctions on Russia, Iran, and Venezuela, but still everyone’s focus comes back to President Trump and tariffs.
A lot of US policy decisions have been hugely unpredictable. Looking at tariffs, continual downwards revisions to the economy and corresponding downgrades of growth in oil demand, the pointers are towards lower bunker prices.
But we don’t know what is going to happen next. The day the IMF launched its more gloomy prospects for the economy, Trump hinted at a softer position with China, and the financial and oil markets both rose; Trump trumps the IMF?
It is still possible that President Trump could remove the planned tariffs, make international agreements, and be ‘good friends’ with China’s President Xi. We do know markets are very quick to respond, and any signs that the US is going to reverse its strategy on tariffs would trigger a return to confidence in the global economy, give us much stronger financial markets, and instantaneously push oil (and bunker) prices much higher.
If, or when this happens is the great unknown. As is always said, forecasts are only based on what we know today; the unpredictable nature of President Trump is that this may be completely different to what we know tomorrow!
Steve Christy
Research Contributor
E: steve.christy@integr8fuels.com
Have We Reached the Bottom for Bunker Prices?
March 27, 2025
View this article as a PDF » Prices have dropped sharply again… In the past four months we have talked consistently about the bearish nature in oil markets, both on the fundamental and political fronts. The mantra of ‘too much oil’, and a Trump led end… Read More
Prices have dropped sharply again…
In the past four months we have talked consistently about the bearish nature in oil markets, both on the fundamental and political fronts. The mantra of ‘too much oil’, and a Trump led end to the wars in Ukraine and Gaza have, until now, led oil prices down sharply. Front month Brent has hit the low $70s, and is some $10/bbl below peak levels seen two months ago.
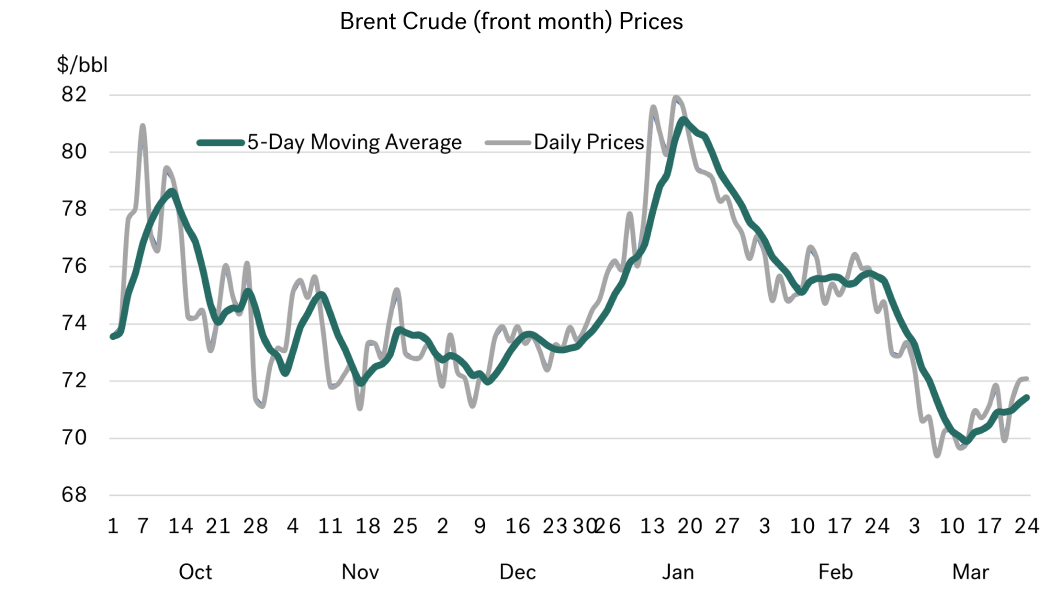 Source: Integr8 Fuels
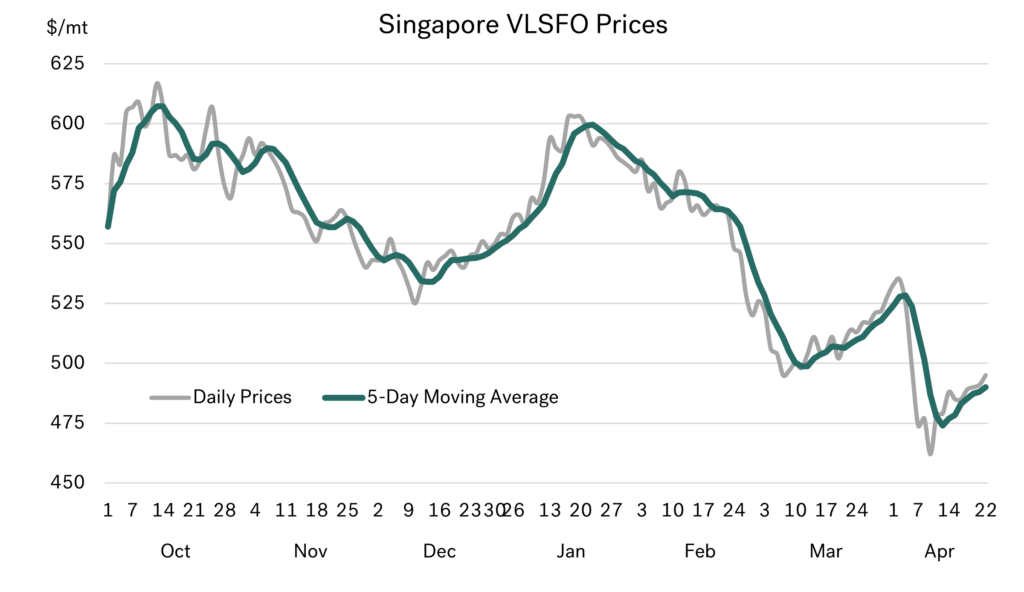
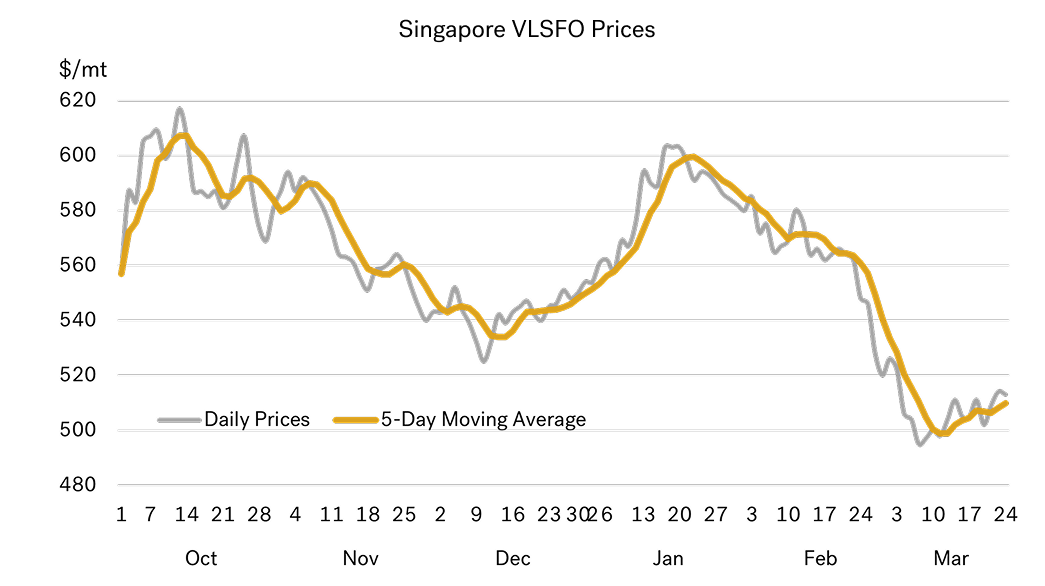
For us in bunkers, Singapore and Fujairah VLSFO prices have fallen by almost $100/mt in the past two months, to around $500/mt. The absolute drop in Rotterdam VLSFO prices has been less, at around $70/mt. But the main point is VLSFO bunker costs are now 13-15% lower than in mid-January.
 Source: Integr8 Fuels
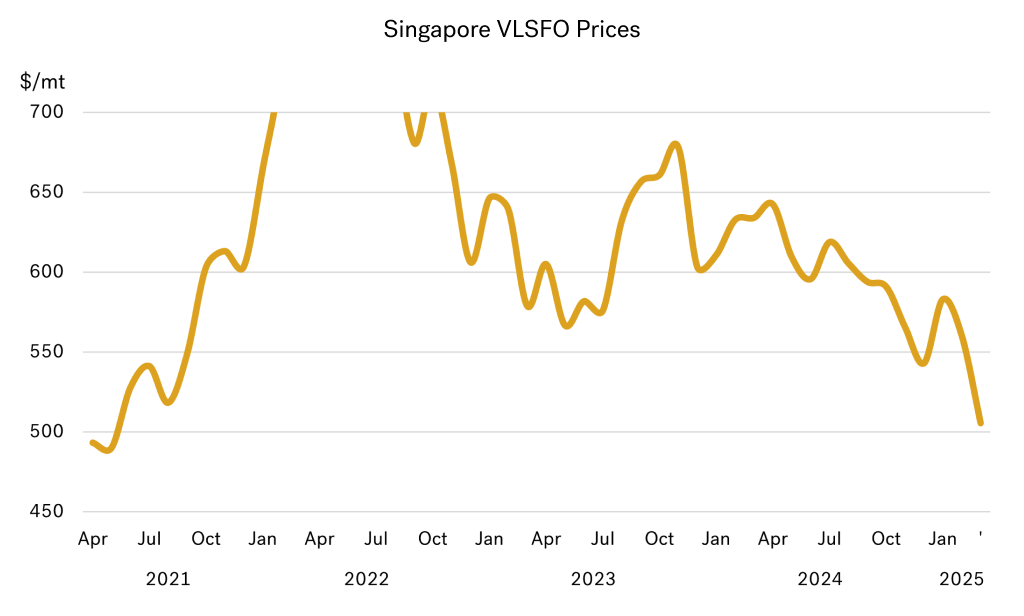
Singapore VLSFO at a 4-year low
Putting this in a more historical context, Singapore VLSFO prices are at their lowest for four years; back to levels we last saw in the first half of 2021.
 Source: Integr8 Fuels
Given this, are we now at a position where the downside risk to prices is far more limited?
Watching peace negotiations & OPEC+
There are always bullish and bearish factors to consider in our market; it’s just that over the past four months the bearish factors have been huge. Given where we are today, are we in a more ‘balanced position’ in terms of price direction?
We still have the potentially bearish issue of OPEC+ unwinding their voluntary production cutbacks starting in April. In early March, the group re-iterated the plan, but it looks like the increases will now be staggered and that any gain in April is likely to be minimal. These moves by OPEC+ are already factored into current prices, and so the group is likely to ‘take a backseat’ in determining oil price direction in the very near-term.
Another bearish fundamental is the expectation that there will be too much oil over the next 12-18 months, even before any increase in OPEC+ output. But again, this is largely baked into current prices.
The upside to prices is if there is any faltering in peace negotiations in the Ukraine/Russian war.
No one wants ‘failure’, but at the moment these negotiations are taking small steps and look highly precarious.
But everyone wants to know how far President Trump will go
In the short term it seems a lot of the sentiment in price direction will come from the US peace talks with Russia and Ukraine.
However, President Trump’s strategy and rhetoric on US tariffs means there is now another bearish factor to consider, which goes well beyond our market. Potential trade wars and any accompanying recession has already contributed to the bearish sentiment and the recent fall in oil prices. If the situation escalates and major tariffs are fully implemented, it is a double-edged sword for us; yes, we could see lower bunker prices, but this world be at the expense of recession and a reduction in world trade.
So, having said we have hit a four-year low in bunker prices and we could be at a more balanced view on the price outlook, there still seems to be more bearish stories around, rather than bullish!
And now for something completely different… Refining
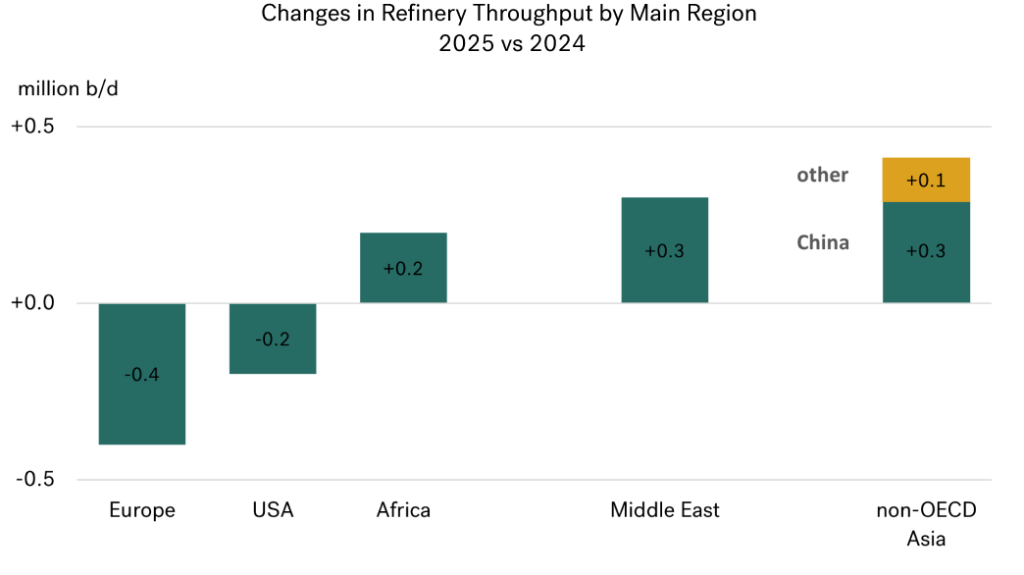
Taking a ‘side-step’ from looking at peace negotiations, tariffs, and economic prospects, here we look at some broad directions in the refining sector. Clearly supplies and blending in the oil bunker markets are dependent on refining and international trade. There is a clear direction here that refinery capacity and throughputs in Europe and the US are declining, whilst the reverse is happening in the Middle East and non-OECD Asia, with rising refinery investments and increased throughputs.
The graph below shows the clear shift in refinery operations this year from west to east, and, as highlighted in the following paragraphs, all the indications are that this trend will continue.
 Source: Integr8 Fuels
BP has plans to cut around 30% of its European refining interests. There are also at least three refineries in Germany up for sale, with more assets in France likely to go. There are further complications in the region, with the Russian companies Lukoil and Rosneft trying to disentangle themselves from their European refining interests by selling them. Although independent refiners and traders could takeover some of these refineries, the end result is still that European crude runs in the future will be less than this year.
In the bigger picture, oil demand is falling in the west, so the overall strategy of selling/closing refineries may appear ‘sensible’. But this could be a key issue for the bunker market. Although the moves towards EVs, renewables and electrification mean total oil demand in the west is falling, for us in bunkers, along with aviation, we are the two sectors where oil demand in the region is rising. There are a lot of ‘moving parts’ in the outlook, but the possibility is that more bunker products/blending components will have to be moved into Europe and less HSFO moved out.
Summing up
It is always worth looking at some of the longer-term issues in the bunker market, such as refining. BUT it is very hard to move away from some of the bearish sentiment still in the market, and what is happening now politically around President Trump, and what impact this will have on bunker prices going forward.
Taking all of this into account, many analysts are still lowering their crude price forecasts for next year, with a number projecting Brent in the mid/high $60s. So, overall, this is not the time to stop talking about falling bunker prices!
Steve Christy
Research Contributor
E: steve.christy@integr8fuels.com